. 2022 Mar 22:11:e73475.
doi: 10.7554/eLife.73475.

Combining genotypes and T cell receptor distributions to infer genetic loci determining V(D)J recombination probabilities

Affiliations

Combining genotypes and T cell receptor distributions to infer genetic loci determining V(D)J recombination probabilities

Magdalena L Russell et al. Elife. .

Abstract

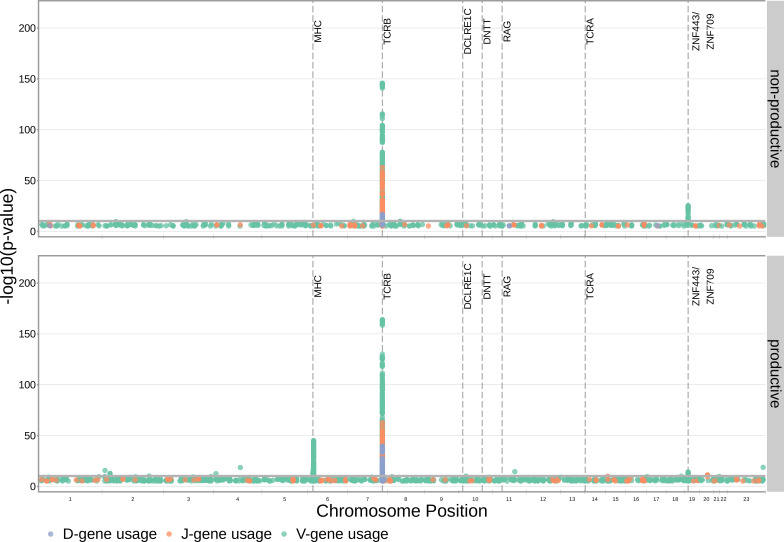
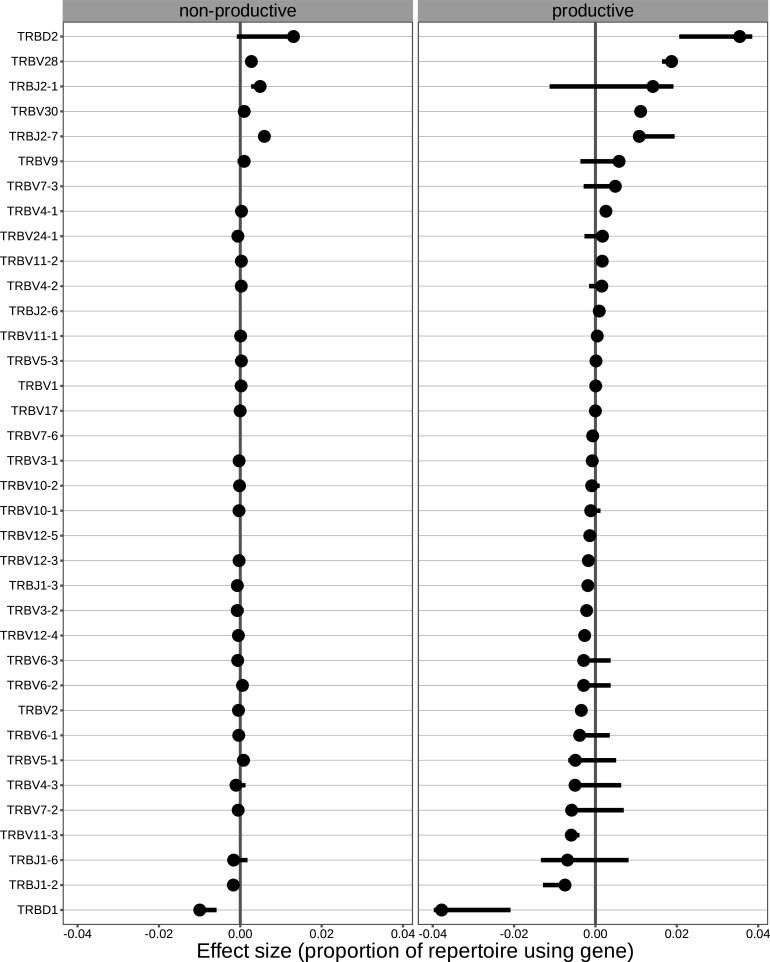
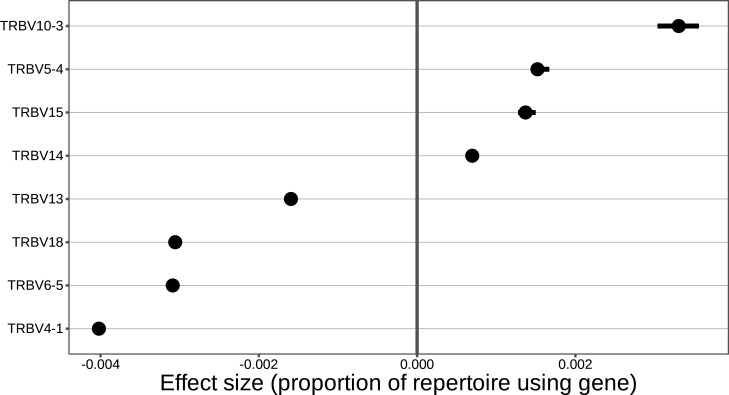
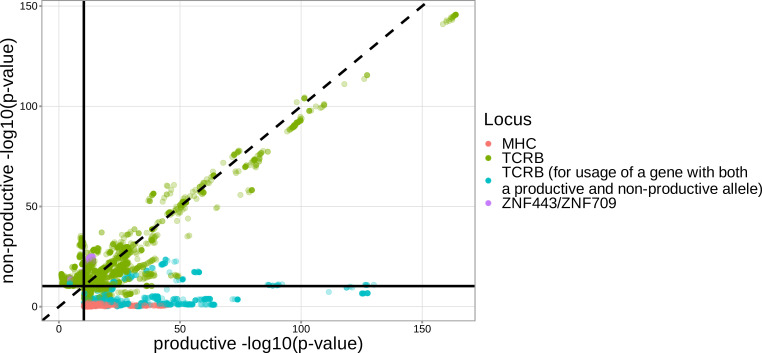
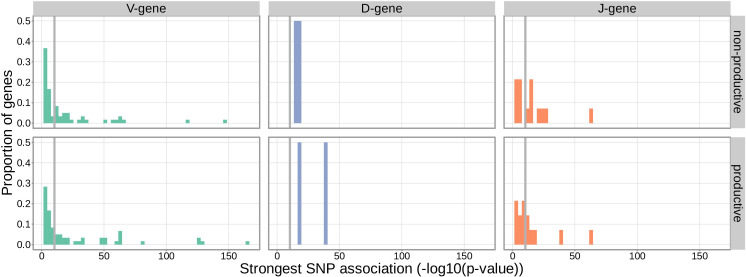
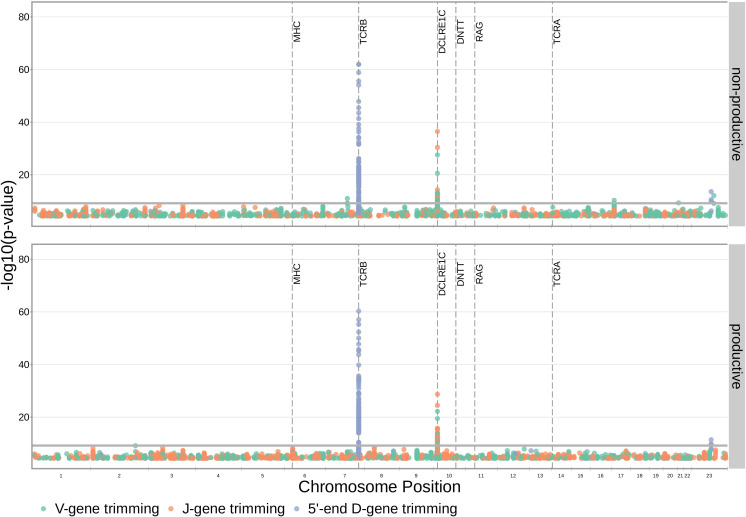
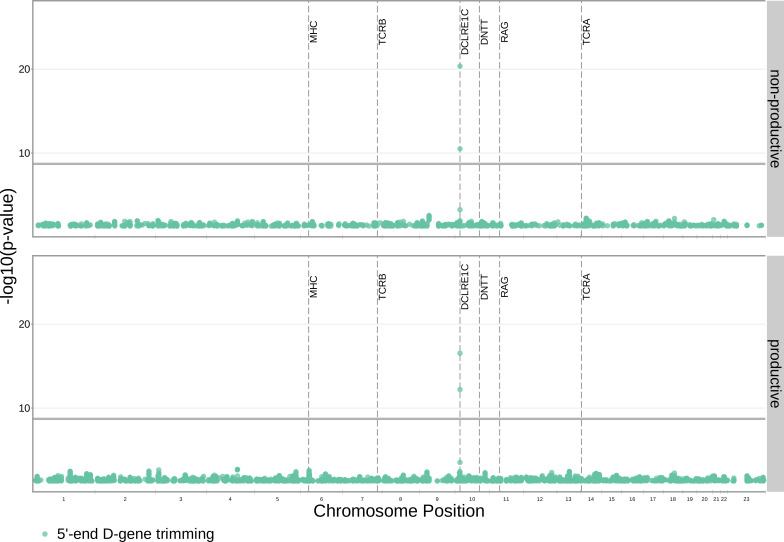
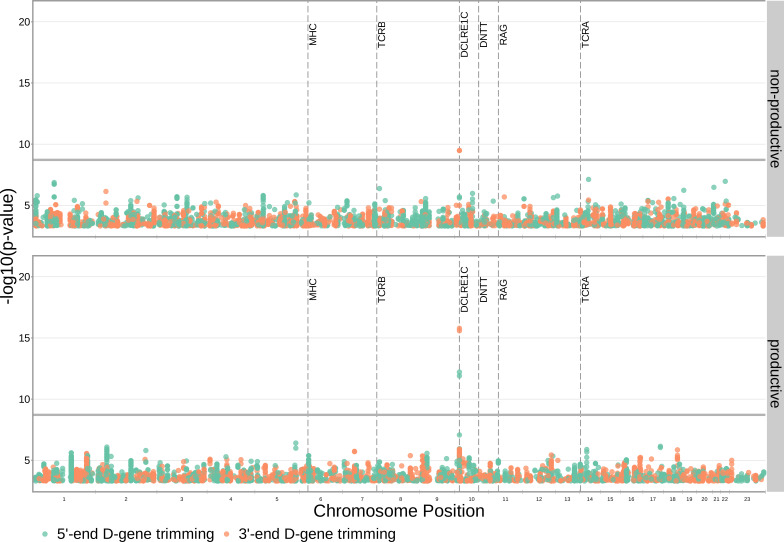
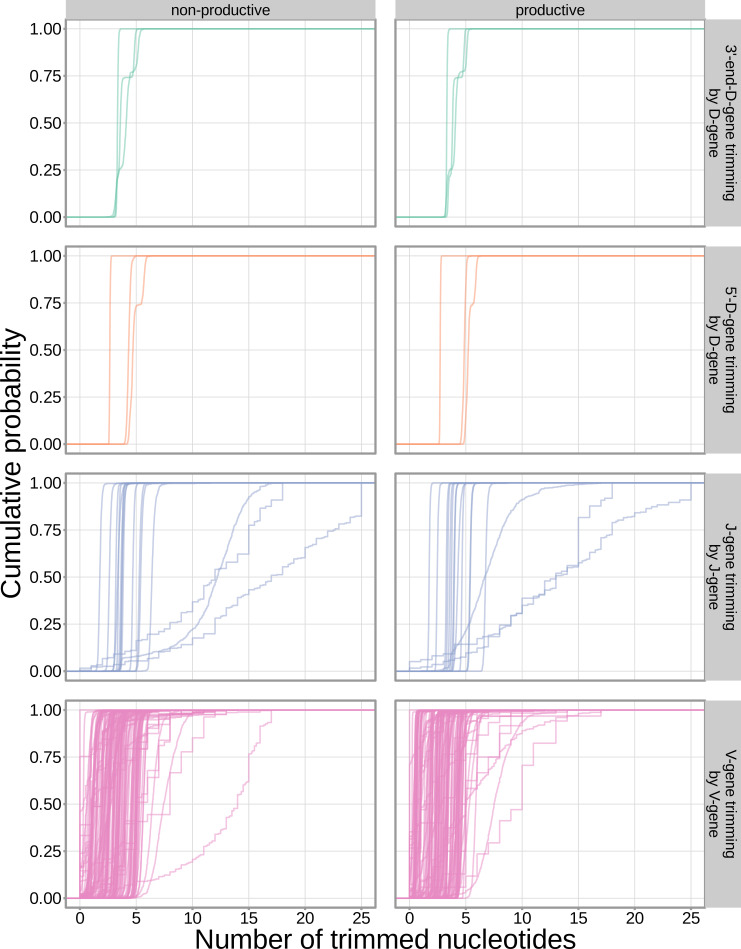
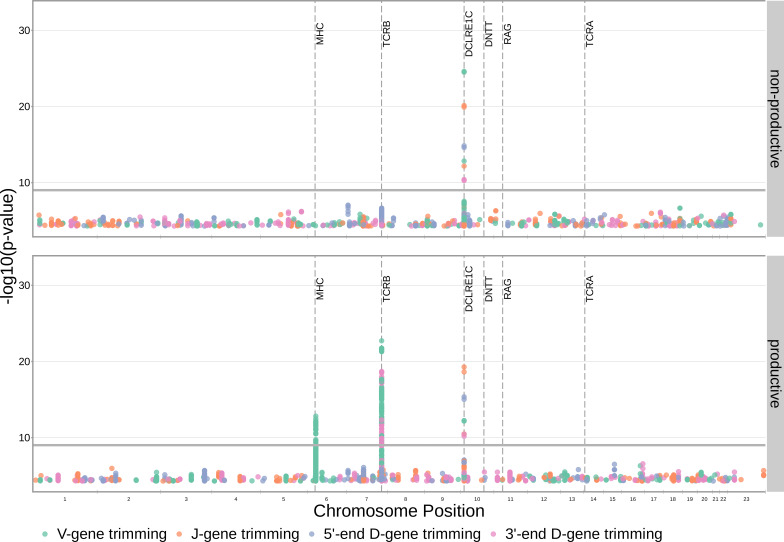
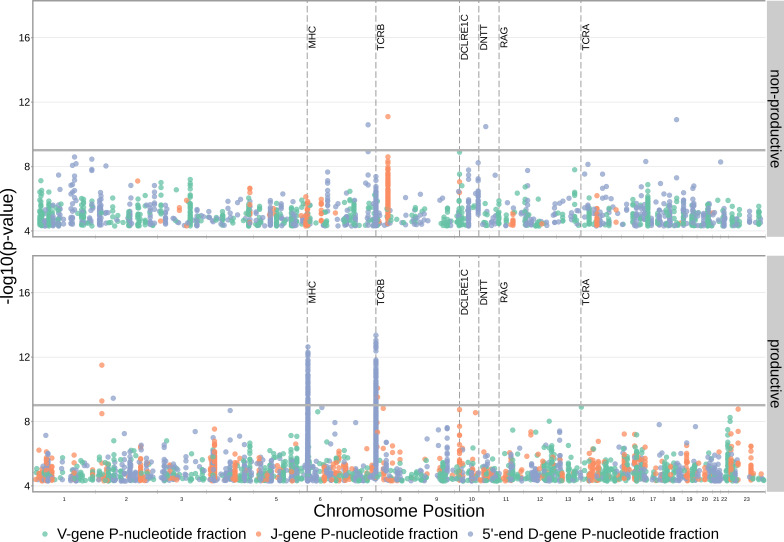
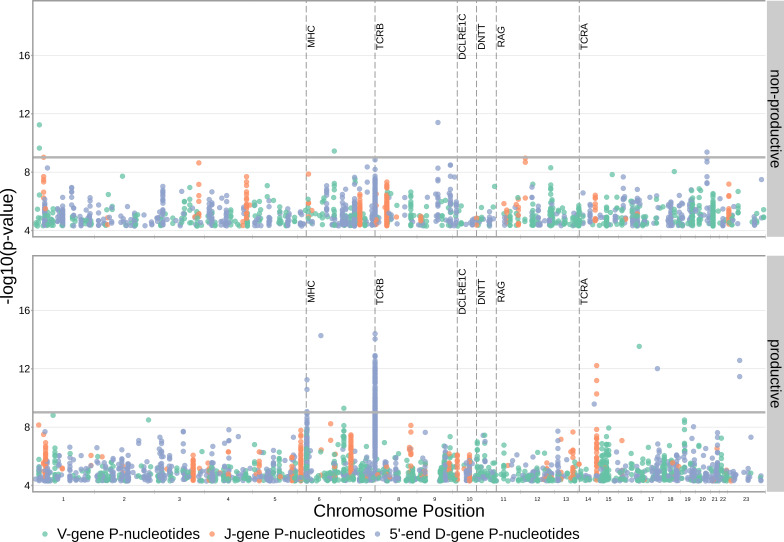
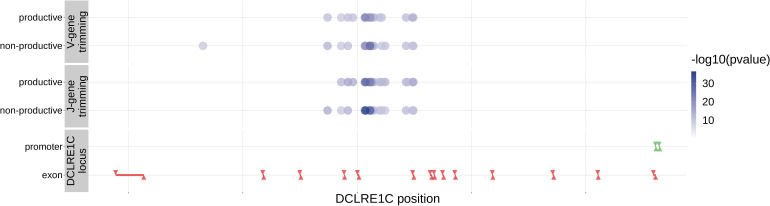
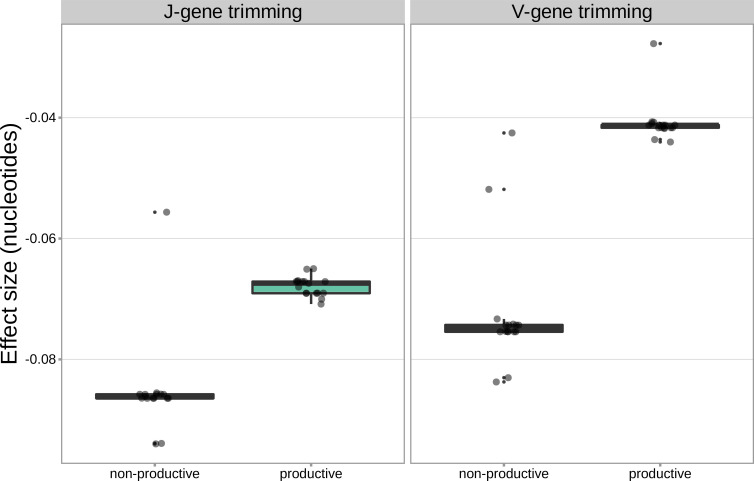
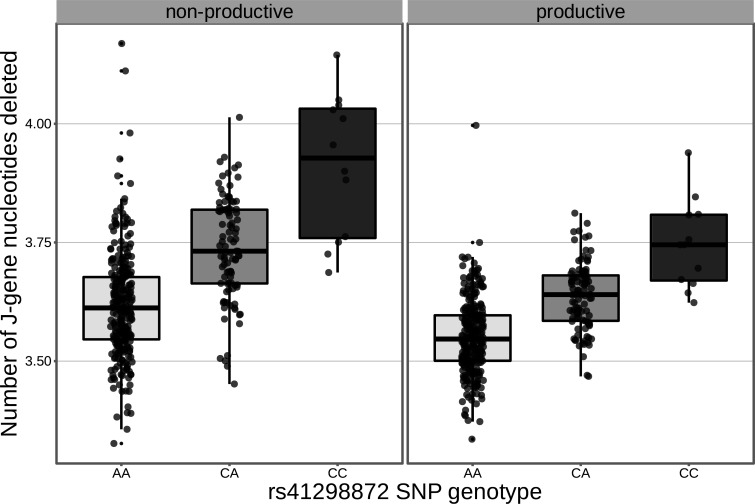
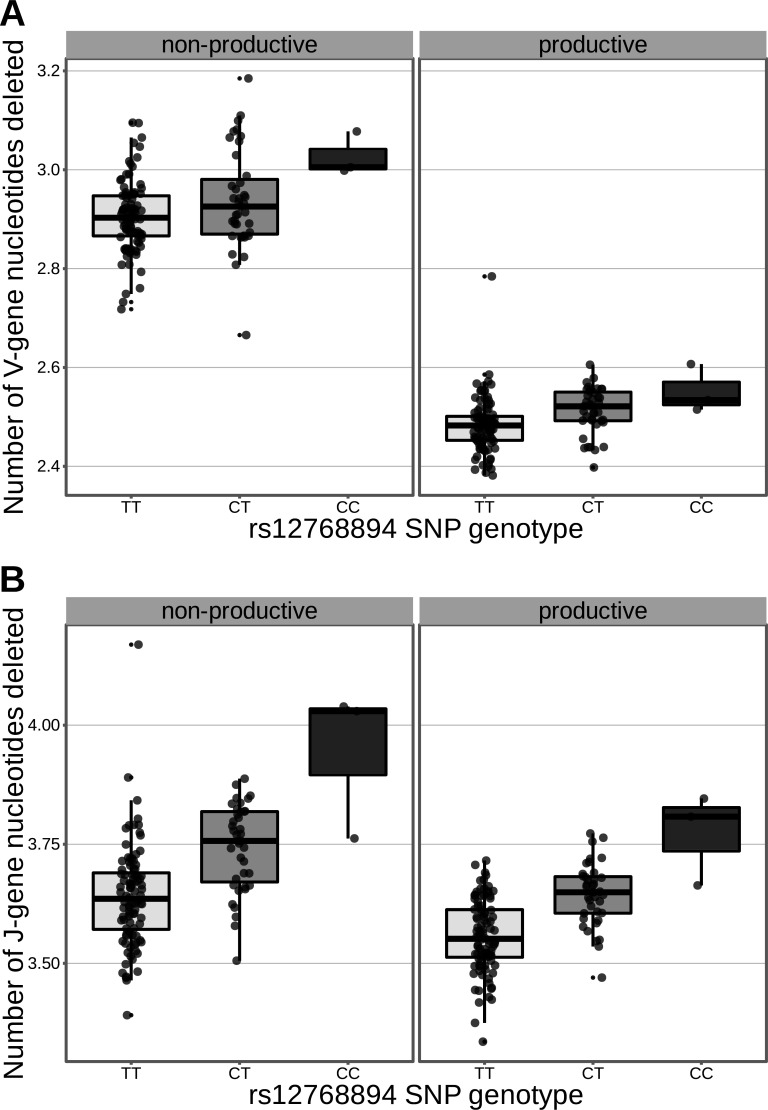
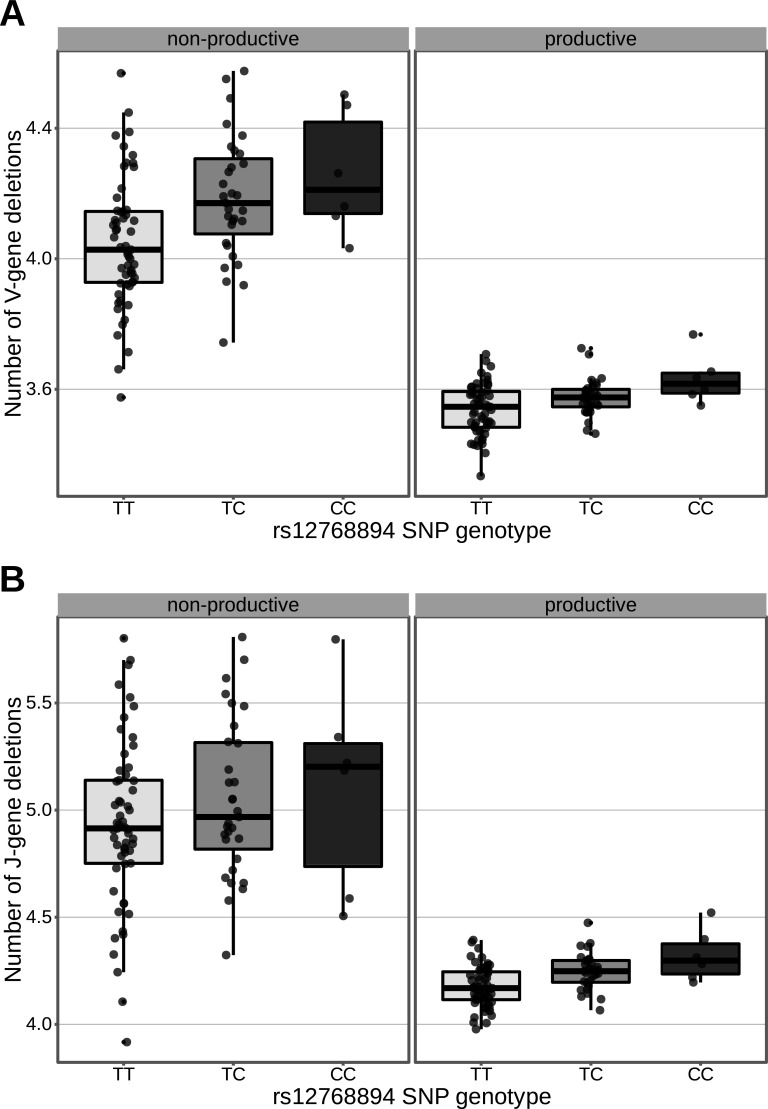
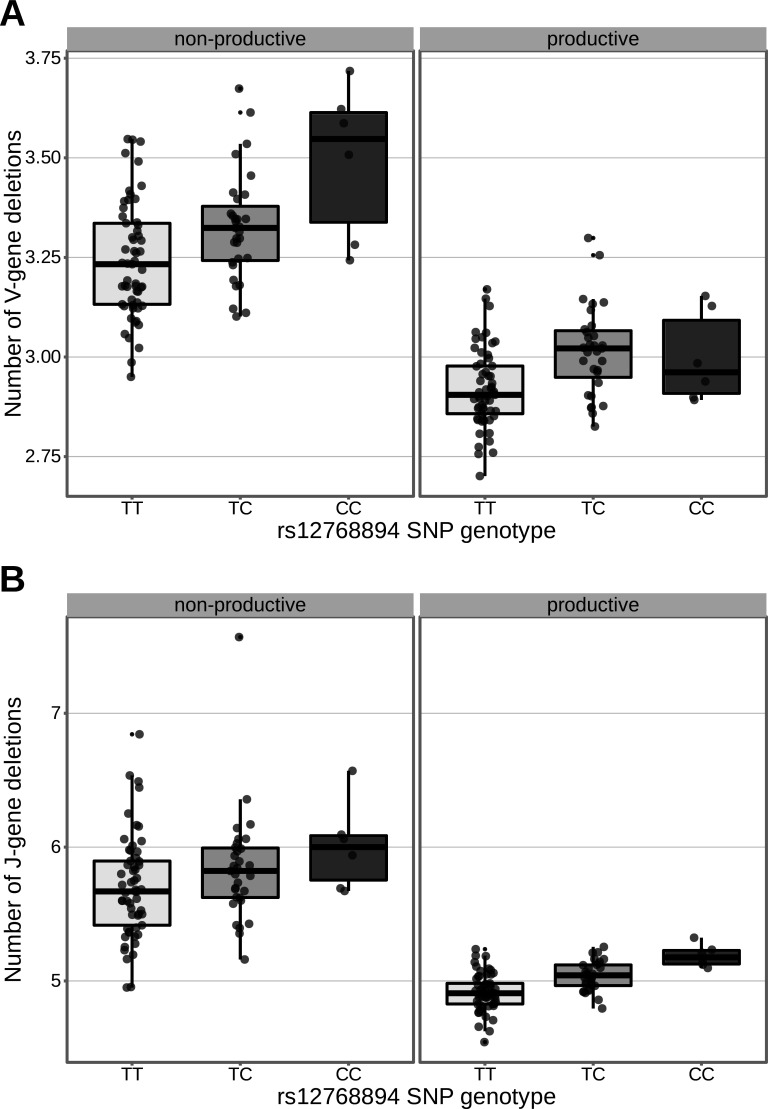
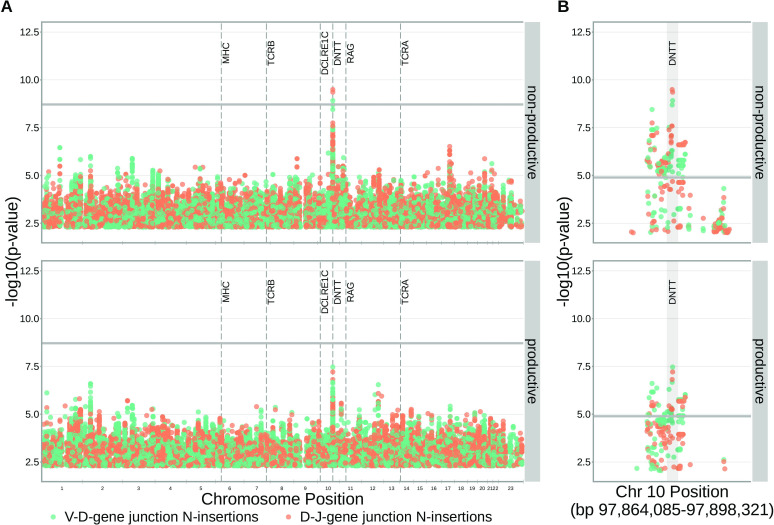
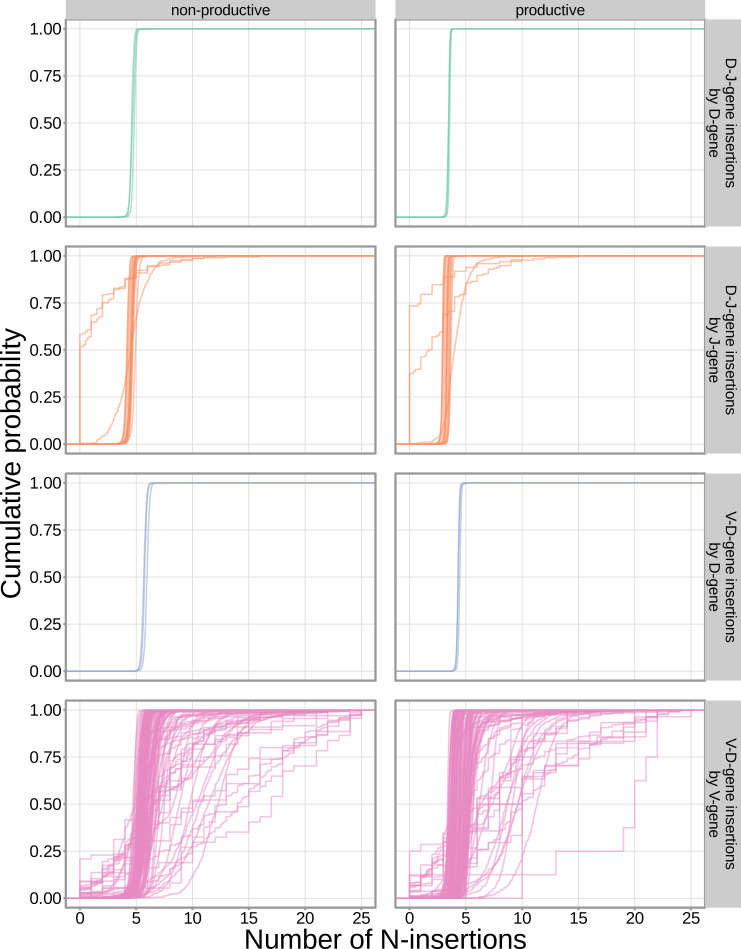
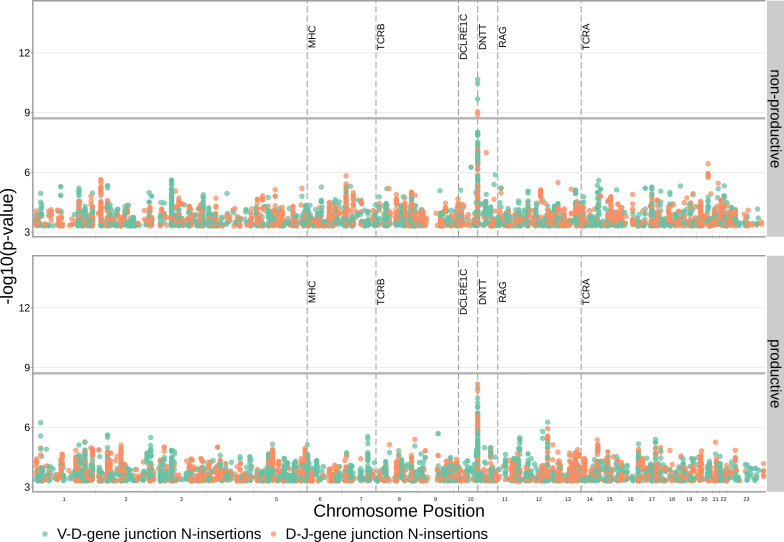
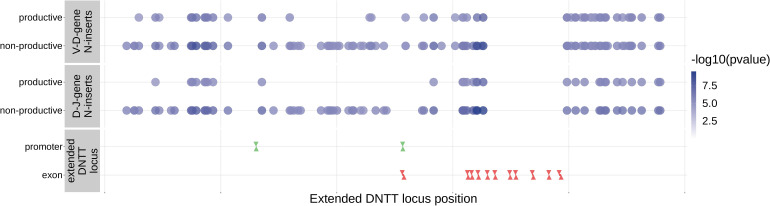
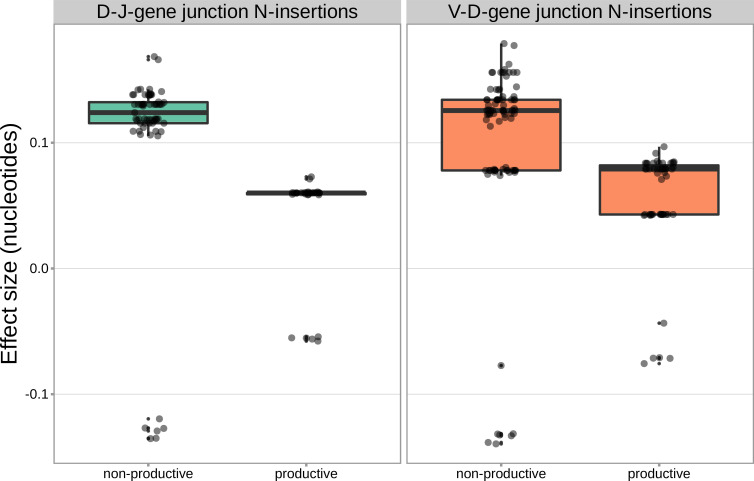
Every T cell receptor (TCR) repertoire is shaped by a complex probabilistic tangle of genetically determined biases and immune exposures. T cells combine a random V(D)J recombination process with a selection process to generate highly diverse and functional TCRs. The extent to which an individual's genetic background is associated with their resulting TCR repertoire diversity has yet to be fully explored. Using a previously published repertoire sequencing dataset paired with high-resolution genome-wide genotyping from a large human cohort, we infer specific genetic loci associated with V(D)J recombination probabilities using genome-wide association inference. We show that V(D)J gene usage profiles are associated with variation in the TCRB locus and, specifically for the functional TCR repertoire, variation in the major histocompatibility complex locus. Further, we identify specific variations in the genes encoding the Artemis protein and the TdT protein to be associated with biasing junctional nucleotide deletion and N-insertion, respectively. These results refine our understanding of genetically-determined TCR repertoire biases by confirming and extending previous studies on the genetic determinants of V(D)J gene usage and providing the first examples of trans genetic variants which are associated with modifying junctional diversity. Together, these insights lay the groundwork for further explorations into how immune responses vary between individuals.

Keywords: Artemis; GWAS; TdT; VDJ recombination probabilities; human; immunology; inflammation; t cell receptor repertoire.


Conflict of interest statement

MR, AS, DL, SS, EA, GK, NS, AB, FM, PB No competing interests declared, AG serves on a scientific advisory board for Janssen, PT consults for Johnson and Johnson, Immunoscape, Cytoagents, and PACT Pharma. He has received travel reimbursement from 10X Genomics and Illumina. He is an inventor on two pending US patent applications related to T cell receptor biology (US: 15/780,938 titled "Cloning and Expression System for T-Cell Receptors' and US: 17/616,279 titled "Kit and Method for Analyzing Singlet Cells')

Figures

Figure 1.
Figure 1.. Many strong associations are present between V-, D-, and J-gene usage frequency and various SNPs genome-wide for both productive and non-productive TCRs.
The most significant SNP associations for the frequency of each of the 60 V-genes, 2 D-genes, and 14 J-genes are located within the TCRB and MHC loci. Associations are colored by gene-type instead of by gene identity for simplicity. Only SNP associations whose P<5×10⁶ are shown here. The gray horizontal line corresponds to a Bonferroni-corrected p-value significance threshold of 5.09×10⁻¹¹.
Figure 1—figure supplement 1.
Figure 1—figure supplement 1.. For the significantly associated TCRB locus SNPs, the median association effect magnitude was largest for the expression of TRBD1 followed by the expression of TRBD2 and the expression of TRBV28 all in productive TCRs.
The median association effect magnitude for each gene is shown by each point and the interquartile range of the association effect sizes for each gene is given by each black horizontal line.
Figure 1—figure supplement 2.
Figure 1—figure supplement 2.. For the significantly associated MHC locus SNPs, the median association effect magnitude was largest for the expression of TRBV4-1 followed by the expression of TRBV10-3.
The median association effect magnitude for each gene is shown by each point and the interquartile range of the association effect sizes for each gene is given by each black horizontal line.
Figure 1—figure supplement 3.
Figure 1—figure supplement 3.. The majority of significantly associated TCRB locus SNPs had similar gene usage association P-values between non-productive and productive TCRs, but significantly associated MHC locus SNPs were only significant for gene usage of productive TCRs.
Notably, the majority of TCRB locus SNPs which were significant for productive TCRs and not significant for non-productive TCRs occurred for the usage of genes which have both productive and non-productive alleles (Dean et al., 2015). Only SNP associations which were significant for either productive TCRs, non-productive TCRs, or both are shown here. There were 15 significant associations which were not located within the MHC, TCRB or ZNF443/ZNF709 loci and are not shown here. The solid black horizontal and vertical lines correspond to the genome-wide Bonferroni-corrected P-value significance threshold of 5.09×10⁻¹¹. The dashed black line represents the non-productive -log10(P-value) equals productive -log10(P-value) line.
Figure 2.
Figure 2.. Gene-usage frequency of many V-gene, D-gene, and J-gene segments is significantly associated with variation in the TCRB locus.
The p-value of the strongest TCRB SNP, gene-usage association for each different V-gene, D-gene, and J-gene segment is given on the X-axis. The proportion of gene segments within each gene type is given on the Y-axis. The gray vertical lines correspond to a whole-genome-level Bonferroni-corrected p-value significance threshold of 5.09×10⁻¹¹.
Figure 3.
Figure 3.. SNP associations for all four trimming types reveal the most significant associations to be located within the TCRB and DCLRE1C loci for 5’ D- gene trimming and J-gene trimming, respectively, when conditioning out effects mediated by gene choice when calculating the strength of association.
Only SNP associations whose P<5×10⁵ are shown here. The gray horizontal line corresponds to a Bonferroni-corrected p-value significance threshold of 9.68×10⁻¹⁰.
Figure 3—figure supplement 1.
Figure 3—figure supplement 1.. The SNP genotype for the SNP (rs2367486) most significantly associated with 5’ end D-gene trimming within the TCRB locus is also associated with TRBD2*02 allele genotype.
Specifically, SNP genotype and TRBD2*02 allele genotype are significantly correlated (P<2.2×10¹⁶ and χ2=259.3) using a chi-square test of independence. The Y-axis integer genotypes correspond to the number of minor alleles within the rs2367486 SNP genotype. The X-axis integer genotypes correspond to the number of TRBD2*02 alleles within the TRBD2 gene locus genotype.
Figure 3—figure supplement 2.
Figure 3—figure supplement 2.. Significant associations are no longer observed between 5’ end D-gene trimming and variation in the TCRB locus after correcting for TRBD2 allele genotype in our model formulation.
Further, four new significant associations are present between 5’ end D-gene trimming and variation in the DCLRE1C locus. Only SNP associations whose P<5×10² are shown here. All genome-wide 3’ end D-gene trimming associations fell above this plotting threshold. The gray horizontal line corresponds to a p-value of 1.94×10⁻⁹ (calculated using whole-genome Bonferroni correction, see Materials and methods).
Figure 3—figure supplement 3.
Figure 3—figure supplement 3.. Significant associations are also no longer observed between 5’ end D-gene trimming and variation in the TCRB locus when restricting the analysis to TCRs which contain TRBJ1 genes (and consequently contain TRBD1).
Additionally, two new associations are present between 5’ end D-gene trimming and variation in the DCLRE1C locus for productive TCRs. Four new associations are present between 3’ end D-gene trimming and variation in the DCLRE1C locus. Only SNP associations whose P<5×10⁴ are shown here. The gray horizontal line corresponds to a P-value of 1.94×10⁻⁹ (calculated using whole-genome Bonferroni correction, see Materials and methods).
Figure 3—figure supplement 4.
Figure 3—figure supplement 4.. The extent of nucleotide deletion varies by the gene allele identity for all gene types.
An empirical cumulative distribution is drawn for each gene allele type within each indicated gene type (i.e. V-gene, D-gene, J-gene).
Figure 3—figure supplement 5.
Figure 3—figure supplement 5.. Significant SNP associations are located within the MHC, TCRB, and DCLRE1C loci for all four trimming types when calculating the strength of association without conditioning out effects mediated by gene choice.
Earlier findings relating variations in MHC and TCRB to gene usage changes, however, indicate that many of these associations are likely artefactual. Only SNP associations whose P<5×10⁵ are shown here. The gray horizontal line corresponds to a p-value of 9.68×10⁻¹⁰.
Figure 3—figure supplement 6.
Figure 3—figure supplement 6.. SNP associations for all fractions of non-gene-trimmed TCRs containing P-nucleotides are not significant within the DCLRE1C locus.
However, significant associations are present within the TCRB and MHC loci for the fraction of non-D-gene-trimmed, productive TCRs containing 5’ end D-gene P-nucleotides. Only SNP associations whose P<5×10⁵ are shown here. The gray horizontal line corresponds to a p-value of 9.68×10⁻¹⁰ (calculated using whole-genome Bonferroni correction, see Materials and methods).
Figure 3—figure supplement 7.
Figure 3—figure supplement 7.. SNP associations for the number of P-nucleotides are not significant within the DCLRE1C locus.
However, significant associations are present within the TCRB and MHC loci. Only SNP associations whose P<5×10⁵ are shown here. The gray horizontal line corresponds to a Bonferroni-corrected whole-genome p-value significance threshold of 9.68×10⁻¹⁰ (see Materials and methods).
Figure 4.
Figure 4.. Within the DCLRE1C locus, 93.8% of these significantly associated SNPs were located within introns.
Additionally, many of these significant SNP associations overlapped between trimming types. Downward arrows represent promoter/exon starting positions and upward arrows represent promoter/exon ending positions.
Figure 4—figure supplement 1.
Figure 4—figure supplement 1.. For the significantly associated DCLRE1C locus SNPs, the magnitudes of the effects were greater for non-productive TCRs compared to productive TCRs for both V-gene trimming and J-gene trimming.
Figure 4—figure supplement 2.
Figure 4—figure supplement 2.. The extent of J-gene trimming changes as a function of SNP genotype for the SNP (rs41298872) most significantly associated with J-gene trimming within the DCLRE1C locus.
Only TCRs containing TRBJ1-1*01 (the most frequently used TRBJ1 gene across subjects) were included when calculating the average number of J-gene nucleotides deleted for each subject.
Figure 4—figure supplement 3.
Figure 4—figure supplement 3.. The extent of V- and J-gene trimming of productive and non-productive TCRβ chains changes as a function of SNP genotype within the discovery cohort for a non-synonymous DCLRE1C SNP (rs12768894, c.728A>G).
Only TCRs containing TRBJ1-1*01 (the most frequently used TRBJ1 gene across subjects) were included when calculating the average number of J-gene nucleotides deleted for each subject. Only TCRs containing TRBV5-1*01 (the most frequently used TRBV gene across subjects) were included when calculating the average number of V-gene nucleotides deleted for each subject.
Figure 4—figure supplement 4.
Figure 4—figure supplement 4.. The extent of V-gene trimming.
(A) of productive and non-productive TCRβ chains and J-gene trimming (B) of productive TCRβ chains changes as a function of SNP genotype within the validation cohort for a non-synonymous DCLRE1C SNP (rs12768894, c.728A > G). The average number of nucleotides deleted was calculated across all TCRβ chains for each subject, regardless of gene-usage.
Figure 4—figure supplement 5.
Figure 4—figure supplement 5.. The extent of V- (A) and J-gene (B) trimming of productive and non-productive TCRα chains changes as a function of SNP genotype within the validation cohort for a non-synonymous DCLRE1C SNP (rs12768894, c728A>G).
The average number of nucleotides deleted was calculated across all TCRα chains for each subject, regardless of gene-usage.
Figure 5.
Figure 5.. SNPs within the DNTT locus are associated with the extent of N-insertion.
(A) There are three associations for SNPs within the DNTT locus which are significant when considered in the whole-genome context. The gray horizontal line corresponds to a whole-genome Bonferroni-corrected P-value significance threshold of 1.94×10⁻⁹. (B) Using a DNTT gene-level significance threshold, many more SNPs within the extended DNTT locus have significant associations for both N-insertion types. Here, the gray horizontal line corresponds to a gene-level Bonferroni-corrected P-value significance threshold of 1.28×10⁻⁵ (calculated using gene-level Bonferroni correction for the 977 SNPs within 200 kb of the DNTT locus, see Materials and methods). For both (A) and (B), only SNP associations whose P<5×10³ are shown.
Figure 5—figure supplement 1.
Figure 5—figure supplement 1.. The extent of N-insertion does not vary substantially by the gene allele identity for any gene type.
An empirical cumulative distribution is drawn for each gene allele type within each indicated gene type (i.e. V-gene, D-gene, J-gene).
Figure 5—figure supplement 2.
Figure 5—figure supplement 2.. Significant associations continue to be observed within the DNTT locus for both V-D- and D-J-gene-junction N-insertions when restricting the analysis to TCRs which contain TRBJ1 genes and consequently contain TRBD1.
Only SNP associations whose P<5×10⁴ are shown here. The gray horizontal line corresponds to a Bonferroni-corrected p-value significance threshold of 1.94×10⁹ (calculated using whole-genome Bonferroni correction, see Materials and methods).
Figure 6.
Figure 6.. Within the DNTT locus, many of the significant SNP associations overlapped between N-insertion types when using DNTT gene-level Bonferroni-corrected p-value significance threshold of 1.28×10⁻⁵.
Downward arrows represent promoter/exon starting positions and upward arrows represent promoter/exon ending positions.
Figure 6—figure supplement 1.
Figure 6—figure supplement 1.. For these significant DNTT locus SNP associations, the magnitudes of the effects were greater for non-productive TCRs compared to productive TCRs for both V-D-gene junction N-insertion and D-J-gene junction N-insertion.
Figure 6—figure supplement 2.
Figure 6—figure supplement 2.. The extent of V-D and D-J N-insertion of productive and non-productive TCRβ chains changes as a function of SNP genotype within the discovery cohort for an intronic DNTT SNP (rs3762093).
The average number of N-insertions was calculated across all TCRβ chains for each subject.
Figure 6—figure supplement 3.
Figure 6—figure supplement 3.. An intronic SNP (rs3762093) within the DNTT gene locus is not strongly associated with the number of V-D (A) or D-J (B) N-inserts within productive or non-productive TCRβ chains in the validation cohort.
However, the direction of the effect is the same as the discovery cohort for all N-insertion and productivity types. The average number of N-insertions was calculated across all TCRβ chains for each subject.
Figure 6—figure supplement 4.
Figure 6—figure supplement 4.. An intronic SNP (rs3762093) within the DNTT gene locus is significantly associated with the number of V-J N-inserts for productive TCRα chains in the validation cohort.
This SNP is not significantly associated with the number of V-J N-inserts for non-productive TCRα chains in the validation cohort. The average number of N-insertions was calculated across all TCRα chains for each subject.
Figure 7.
Figure 7.. The TCR repertoires for subjects in the ‘Asian’-associated PCA-cluster contain fewer N-insertions for productive TCRs when compared to the population mean computed across all 666 subjects (dashed, red horizontal line).
The p-values from a one-sample t-test (without Bonferroni multiple testing correction) for each PCA cluster compared to the population mean are reported at the top of the plot.
Figure 7—figure supplement 1.
Figure 7—figure supplement 1.. The population mean is dominated by subjects in the ‘Caucasian’-associated PCA-cluster.
Of the 398 subjects in the sample population, 81% are in the ‘Caucasian’-associated PCA-cluster.
Figure 8.
Figure 8.. SNPs within the DNTT region that are associated with fewer N-insertions have a higher mean allele frequency within the ‘Asian’-associated PCA-cluster when compared to the population mean allele frequency computed across the 398 discovery cohort subjects (dashed, red horizontal line).
The p-values from a one-sample t-test (without Bonferroni multiple testing correction) for each PCA cluster compared to the population mean are reported at the top of the plot. The population mean is dominated by subjects in the ‘Caucasian’-associated PCA cluster (Figure 7—figure supplement 1).
Figure 9.
Figure 9.. The top principal components calculated from genotype data reflect ancestry structure among samples.
(A) The majority of the ancestry-informative principal component analysis variance is explained by the first eight principal components. (B) The first eight principal components show distinct separation by PCA cluster. Each colored line represents one of the 398 samples. The first 32 principal components are shown on the X-axis and their scaled component values for each subject on the Y-axis.

Similar articles

Cited by

References

    1. Bradley P, Crawford JC, Fiore-Gartland A, Perry A, Diez D. TCRdist pipeline. 0.0.2GitHub. 2017 https://github.com/phbradley/tcr-dist
    1. Conomos MP, Miller MB, Thornton TA. Robust inference of population structure for ancestry prediction and correction of stratification in the presence of relatedness. Genetic Epidemiology. 2015;39:276–293. doi: 10.1002/gepi.21896. - DOI - PMC - PubMed
    1. Conomos MP, Laurie CA, Stilp AM, Gogarten SM, McHugh CP, Nelson SC, Sofer T, Fernández-Rhodes L, Justice AE, Graff M, Young KL, Seyerle AA, Avery CL, Taylor KD, Rotter JI, Talavera GA, Daviglus ML, Wassertheil-Smoller S, Schneiderman N, Heiss G, Kaplan RC, Franceschini N, Reiner AP, Shaffer JR, Barr RG, Kerr KF, Browning SR, Browning BL, Weir BS, Avilés-Santa ML, Papanicolaou GJ, Lumley T, Szpiro AA, North KE, Rice K, Thornton TA, Laurie CC. Genetic Diversity and Association Studies in US Hispanic/Latino Populations: Applications in the Hispanic Community Health Study/Study of Latinos. American Journal of Human Genetics. 2016;98:165–184. doi: 10.1016/j.ajhg.2015.12.001. - DOI - PMC - PubMed
    1. Corporation M, Weston S. doParallel: Foreach Parallel Adaptor for the ’parallel’ Package. R package version 1.0.16R Package 2020
    1. Dash P, Fiore-Gartland AJ, Hertz T, Wang GC, Sharma S, Souquette A, Crawford JC, Clemens EB, Nguyen THO, Kedzierska K, La Gruta NL, Bradley P, Thomas PG. Quantifiable predictive features define epitope-specific T cell receptor repertoires. Nature. 2017;547:89–93. doi: 10.1038/nature22383. - DOI - PMC - PubMed

Publication types

Substances

Associated data