. 2022 Apr 15;17(4):829-839.
doi: 10.1021/acschembio.1c00732. Epub 2022 Mar 22.

Decoding the Mechanism of Specific RNA Targeting by Ribosomal Methyltransferases

Affiliations

Decoding the Mechanism of Specific RNA Targeting by Ribosomal Methyltransferases

Juhi Singh et al. ACS Chem Biol. .

Abstract

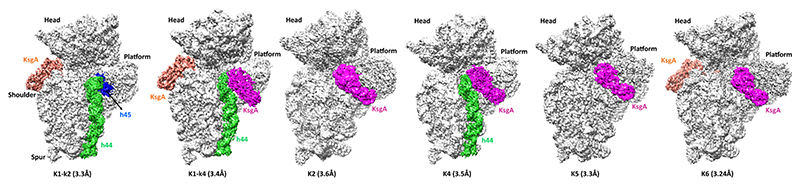
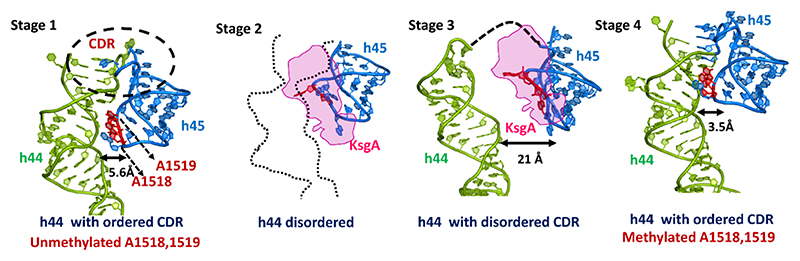
Methylation of specific nucleotides is integral for ribosomal biogenesis and also serves as a common mechanism to confer antibiotic resistance by pathogenic bacteria. Here, by determining the high-resolution structure of the 30S-KsgA complex by cryo-electron microscopy, a state was captured, where KsgA juxtaposes between helices h44 and h45 of the 30S ribosome, separating them, thereby enabling remodeling of the surrounded rRNA and allowing the cognate site to enter the methylation pocket. With the structure as a guide, several mutant versions of the ribosomes, where interacting bases in the catalytic helix h45 and surrounding helices h44, h24, and h27, were mutated and evaluated for their methylation efficiency revealing factors that direct the enzyme to its cognate site with high fidelity. The biochemical studies show that the three-dimensional environment of the ribosome enables the interaction of select loop regions in KsgA with the ribosome helices paramount to maintain selectivity.


Figures

None
Graphical abstract
Figure 1
Figure 1. Cryo-EM structure of the KsgA−30S complex.
The maps of cryo-EM classes reported in this study (sharpened map from the Relion postprocess procedure). Class K1-k2 has KsgA density near helix 16, and very weak density at the platform region indicates a potential initial scanning of protein on the 30S platform. In class K1-k4, KsgA density is present at the platform as well as near h16 of the 30S ribosome. Additionally, remodeled helix 44 is unique for this state, which enabled us to understand the mode of KsgA binding on the 30S platform region. Classes K2 and K5 show KsgA density at cognate position, similar to that reported by Stephan et al. Class K4 is similar to K1-k4 class, but KsgA is observed at only cognate position. Class K6 has an additional KsgA near h16 but otherwise similar to K2 and K5 classes. These classes also show swiveling motion in the 30S ribosomal subunit head.
Figure 2
Figure 2. Cryo-EM structure of the KsgA−30S complex.
(A) Cryo-EM reconstruction corresponding to K1-k4 class; KsgA (magenta) binds to the platform and is surrounded by rRNA: h45 (blue), h27 (orange), h24 (yellow), and the upper region (green) of h44. (B) Electrostatic surface potential map of KsgA colored by surface charge [calculated with adaptive Poisson−Boltzmann solver; the scale ranges from −5 kT/e (red) to 5 kT/e (blue)] in complex with h45 (dark blue), h44, h24, and h27. (C) Cryo-EM densities of h44 and h45 showing the arrangement of helices in the 30S−KsgA complex. (D) The panel shows the displacement of h44 compared to the unbound state (gray) vs bound (green) to accommodate the KsgA β6/7 linker and loop1 onto the 30S platform. KsgA is shown in magenta with highlighted loop1, and C-domain is shown in firebrick red. (E) In order to present the target residue (red) to KsgA, the displacement of h44 and h45 is depicted. The unbound 30S h44 and h45 helices are shown in gray (PDB ID: 3OTO), whereas the bound forms of h44 and h45 are shown in green and blue, respectively (numbering shown in bracket is for Tt). To clearly visualize the ribosomal structural rearrangement, the model of KsgA is not shown.
Figure 3
Figure 3
Steps involved in KsgA methylation during biogenesis to achieve mature 30S. Stage 1 is the premethylated stage where h44 (green) and h45 are loosely packed. At stage 2, h44 adopts a flexible conformation (shown as dotted line) allowing the entry of KsgA (magenta) (similar to the state observed by Stephan et al.). This later rearranges in stage 3 to a conformation where h45 (marine blue) presents A1518 and A1519 (red) to the KsgA catalytic pocket for methylation. In stage 4, methylation leads to the dissociation of KsgA and orders the h44 and h45 conformation so as to achieve an active central decoding center. PDB ID: 3OTO (unmethylated A1518/19, stage 1) and 4B3R (methylated A1518/19, stage 4). Stage 2 (K5) and stage 3 (K1-k4) are experimentally observed as cryo-EM maps in this work.
Figure 4
Figure 4. Effect of mutagenesis of select bases in h45 and h44 of 30S present near the KsgA interaction region.
(A) Schematic diagram depicting the interaction of the GGAA tetraloop of h45 and KsgA from class K1-k4. (B) The active site of KsgA with key residues shown in stick representation pockets with flipped A1519 (red) (numbering shown in bracket is for Tt) into the catalytic pocket; carbon atoms of the interacting residue are shown in magenta and salmon and those of SAM are shown in yellow, while oxygen and nitrogen atoms are colored in red and blue, respectively. SAM is modeled by using PDB ID: 6IFT, not present in the 30S−KsgA complex structure. (C) Interaction of G1516 (blue) (numbering shown in bracket is for Tt) with KsgA via a pocket formed at the interface of its N- and C-terminal domain. Loop12, C-terminal domain residues are shown in salmon and N-terminal residues are shown in magenta. (D) Design of h45 and h44 mutants; KsgA target residues are highlighted in red, and residues encircled are subjected to mutagenesis. (E) In vitro KsgA methylation assay with constructs harboring mutation in the h45 tetraloop. (F) In vitro KsgA methylation assay with altered target site constructs of h44. Data for three experimental replicates are shown with the mean and standard deviation. Histogram colors are as per the scheme chosen for each 30S helix in Figure 1. Student’s t-tests were used to calculate P-values (**P < 0.01, ***P < 0.001) for the comparisons of 30S_WT (wild type) with the 30S mutant variant. Results show that methylation efficiency is significantly affected on perturbation of these important regions.
Figure 5
Figure 5. Probing tertiary interactions of KsgA with h24 and h27.
(A) The highly basic loop14 of KsgA-targeting domain recognizes the juxtaposition of helix 27 and 24 through multiple interactions with the rRNA backbone (numbering shown in bracket is for Tt). (B) Loop1 interaction with the helix 24 (790-loop) phosphate backbone (numbering shown in bracket is for Tt). The density for the residues 773−779 is poor in all classes with KsgA bound and not modeled. In this figure, using the K1-k2 model, this region has been extrapolated to show potential interaction built on the K1-k4 map. (C) Design of h27 (GCAA, green, a conserved 900-loop) and h24 mutants. The residues that were mutated/inserted/deleted are highlighted in maroon and black for h27 and h24, respectively. (D) In vitro methylation assay using 3H-SAM with native and ΔC-KsgA. Histogram colors are as per the scheme chosen for each 30S helix in Figure 1. Data for three experimental replicates are shown with the mean and standard deviation. Student’s t-tests were used to calculate P-values (**P < 0.01, ***P < 0.001) for the comparisons of 30S_WT (wild type) with the 30S mutant variant.
Figure 6
Figure 6. Tetraloop conformational flexibility.
(A) An overlay of the h45 tetraloop bound to KsgA (marine blue) and the unbound state (green) (PDB ID: 3OTO) of the Tt ribosome showing the conformational differences. (B) Conformational difference of the h45 tetraloop in the bound state with KsgA (marine blue) and TFB1M (yellow) (PDB ID: 6AAX). (C) Overlay of the Tt h45 tetraloop (marine blue) in the bound state with BsKsgA and the Ec h45 tetraloop (salmon) with EcKsgA (PDB ID: 7O5H) (numbering shown in bracket is for Tt). (D) Proposed mechanism of dimethylation. Tetraloop conformational change induces A1519 flips into the active pocket. Dimethylation of A1519 results in the further local flipping of the adjacent A1518 base. Finally, dimethylation of A1518 dissociates the enzyme from 30S and h45 resumes its native conformation as observed in the mature 30S ribosomal subunit.
Figure 7
Figure 7. Targeting determinant of methyltransferase.
(A) Comparison of longer loop12 and loop14 of KsgA (firebrick red) with shorter respective loops of ErmC′ (green, PDB ID: 1QAM), interacting with the h45 stem region and (B) other 30S platform helices h27 and h24. (C) Similarly, longer loop1 of KsgA (firebrick red) than ErmC′ (green) interacts with h24. Respective sequence differences of KsgA and ErmC′ loops are highlighted in the inset.

Similar articles

Cited by

References

    1. Wilson DN. Ribosome-targeting antibiotics and mechanisms of bacterial resistance. Nat Rev Microbiol. 2014;12:35–48. - PubMed
    1. Arenz S, Wilson DN. Blast from the Past: Reassessing Forgotten Translation Inhibitors, Antibiotic Selectivity, and Resistance Mechanisms to Aid Drug Development. Mol Cell. 2016;61:3–14. - PubMed
    1. Kavčič B, Tkačik G, Bollenbach T. Mechanisms of drug interactions between translation-inhibiting antibiotics. Nat Commun. 2020;11:4013. doi: 10.1038/s41467-020-17734-z. - DOI - PMC - PubMed
    1. Blair JMA, Webber MA, Baylay AJ, Ogbolu DO, Piddock LJV. Molecular mechanisms of antibiotic resistance. Nat Rev Microbiol. 2015;13:42–51. - PubMed
    1. Alekshun MN, Levy SB. Molecular mechanisms of antibacterial multidrug resistance. Cell. 2007;128:1037–1050. - PubMed

Publication types

LinkOut - more resources