. 2022 Dec;18(12):2830-2850.
doi: 10.1080/15548627.2022.2051880. Epub 2022 Mar 22.

TFEB- and TFE3-dependent autophagy activation supports cancer proliferation in the absence of centrosomes

Affiliations

TFEB- and TFE3-dependent autophagy activation supports cancer proliferation in the absence of centrosomes

Chien-Han Kao et al. Autophagy. 2022 Dec.

Abstract

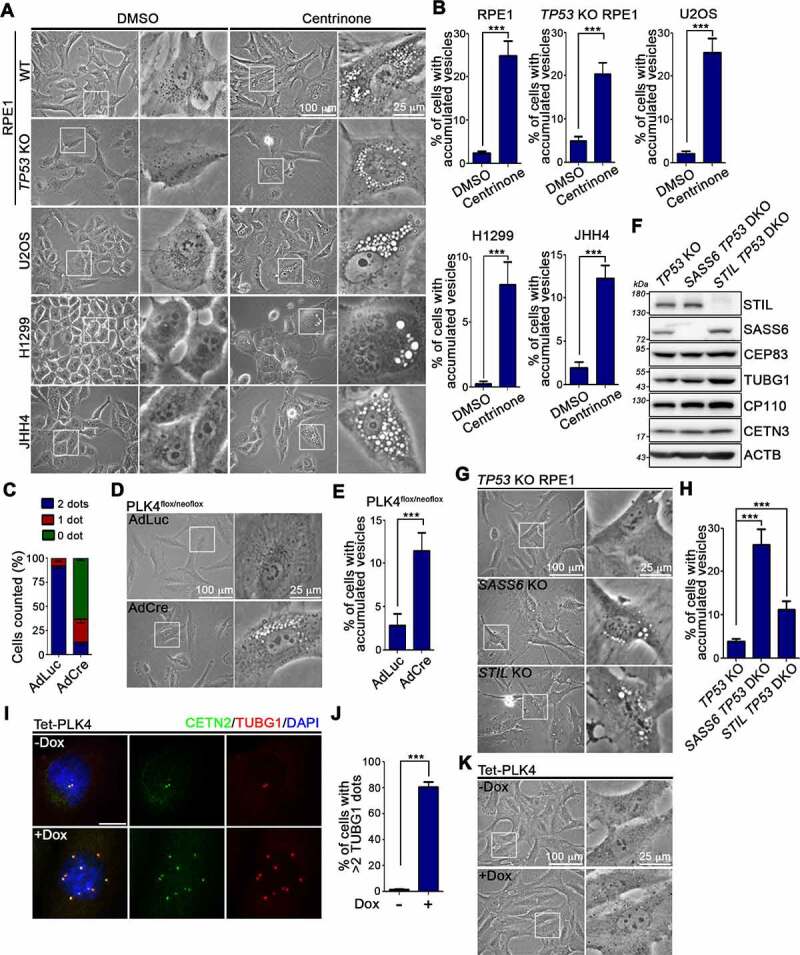
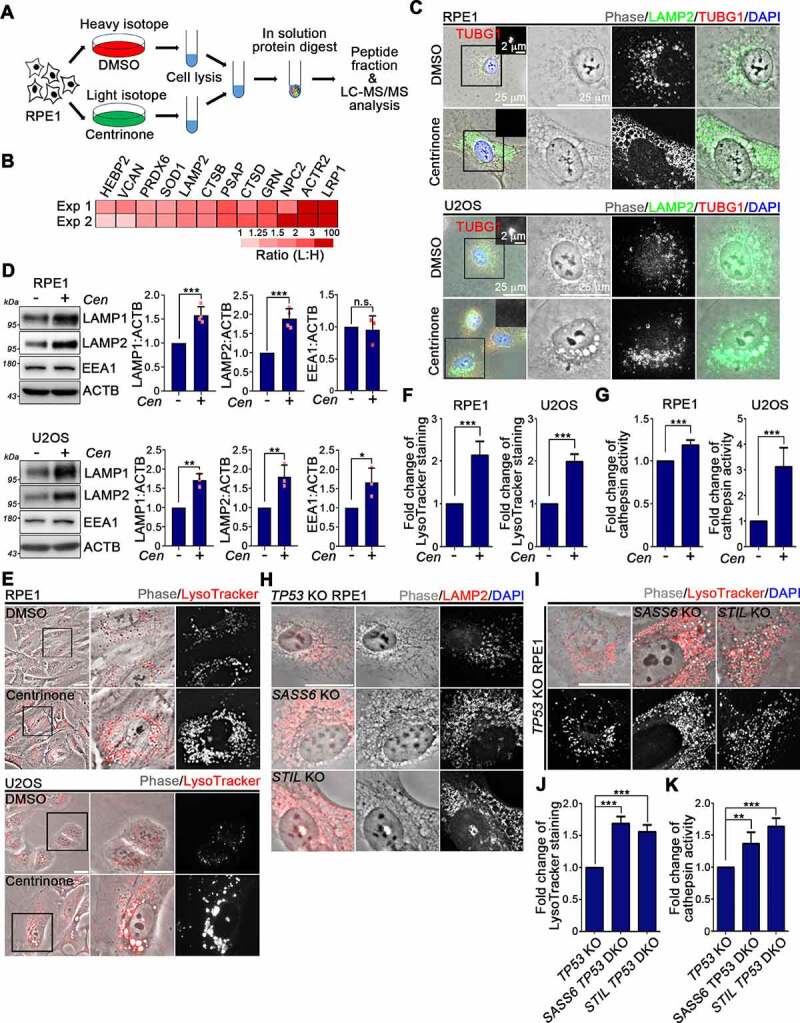
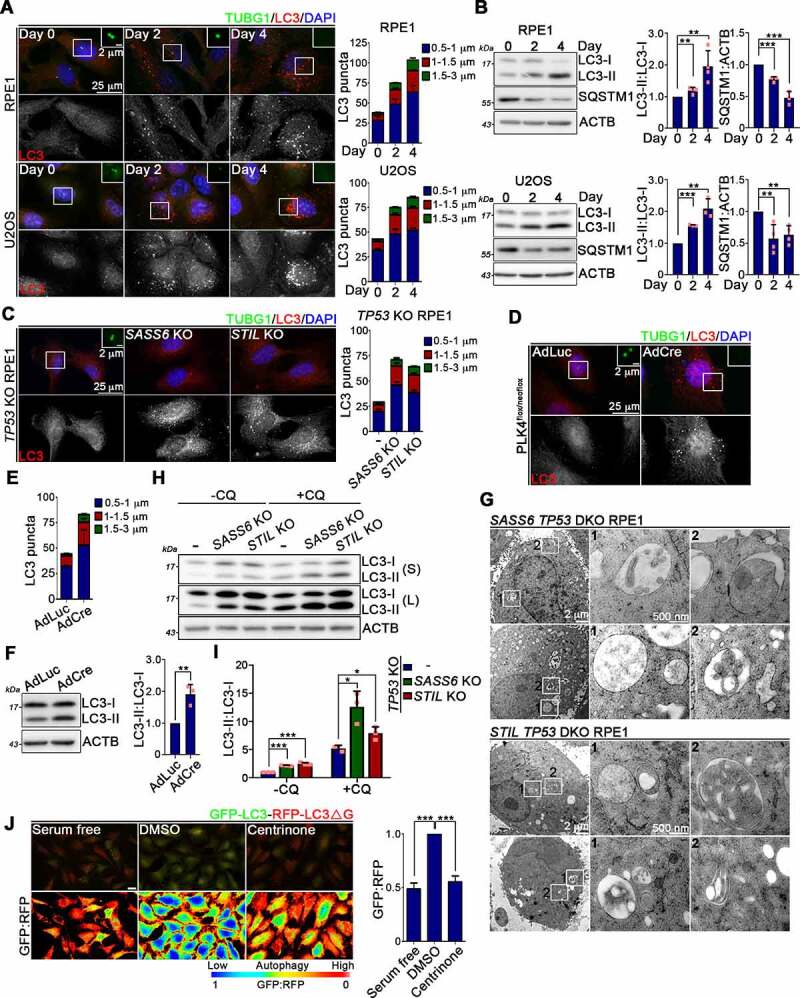
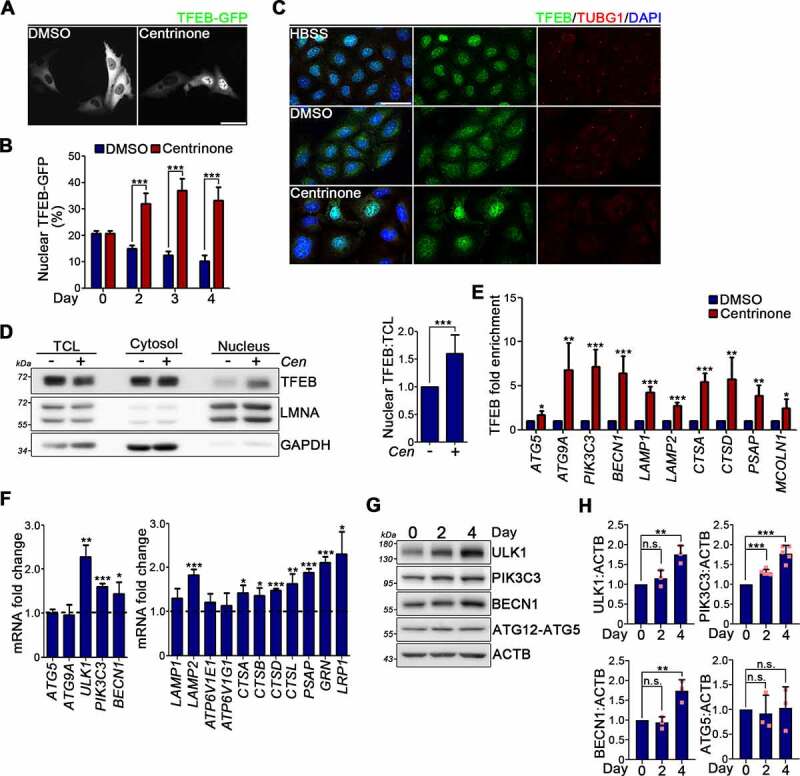
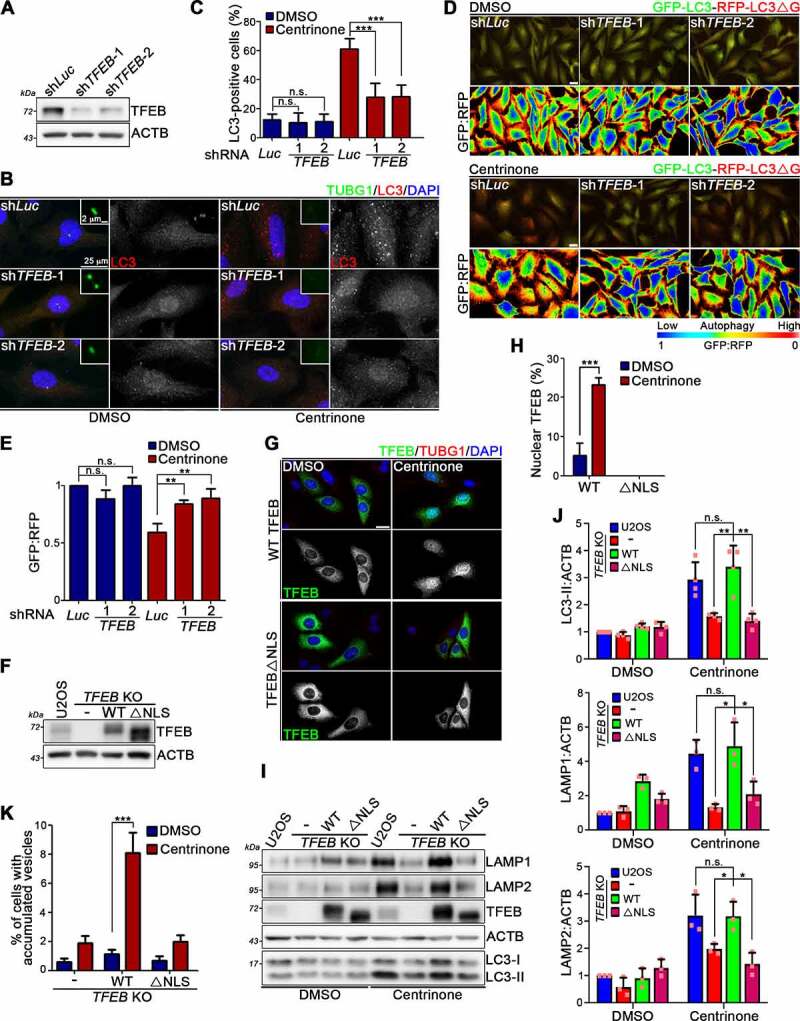
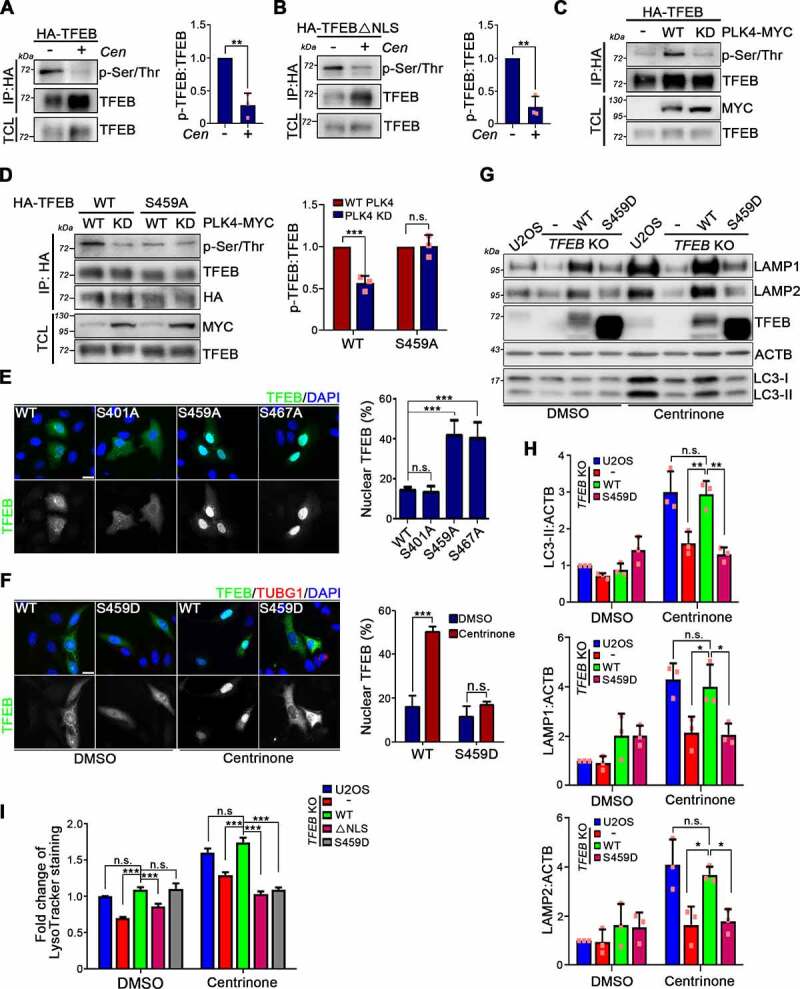
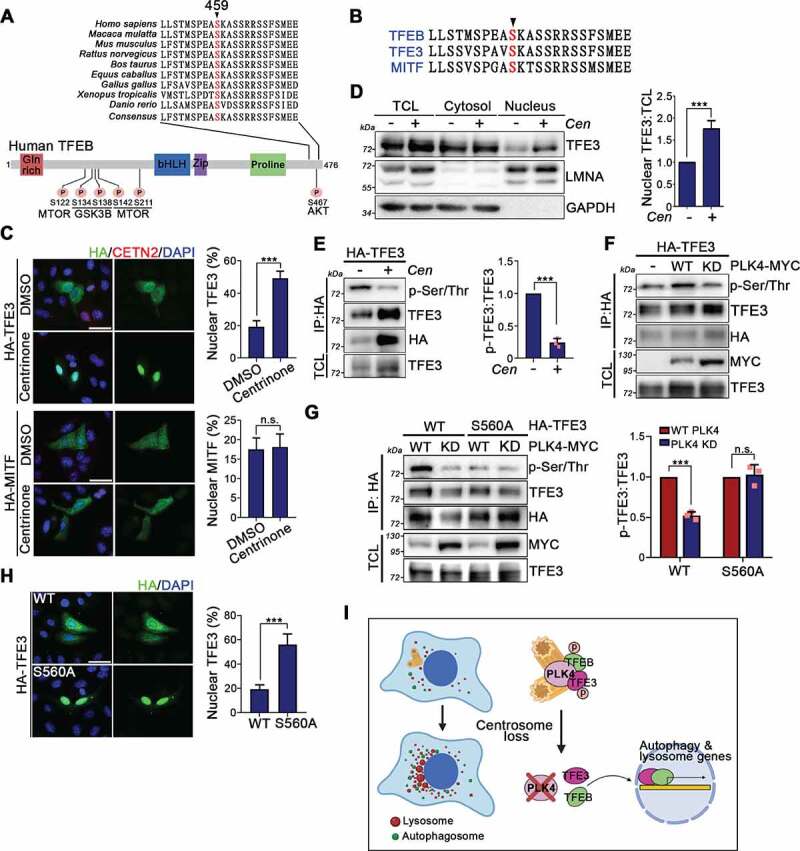
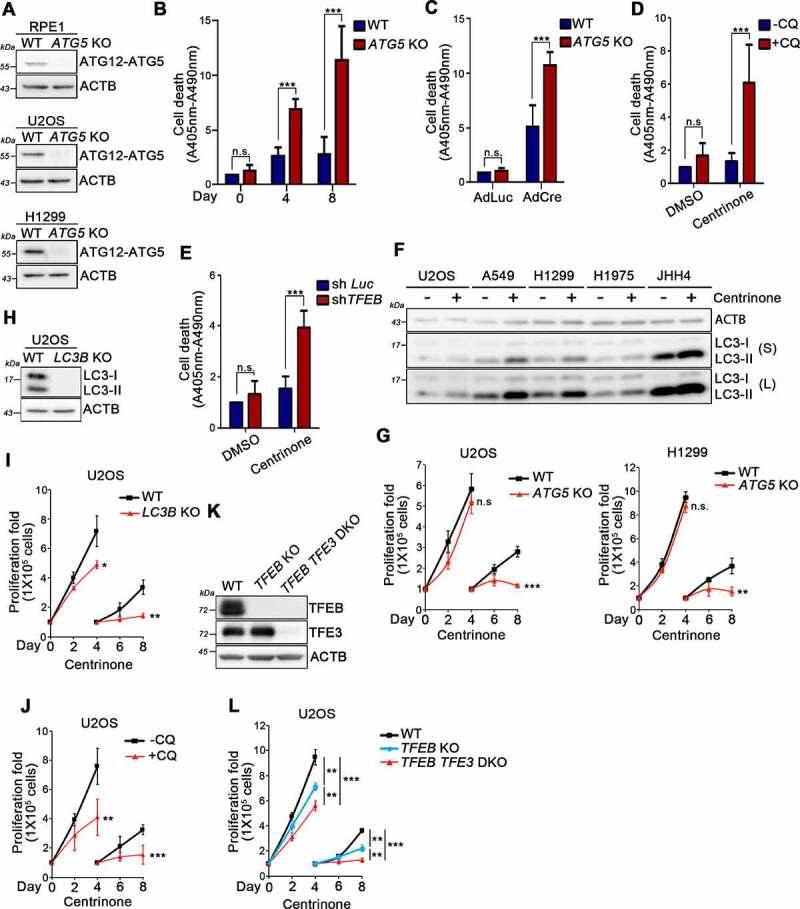
Centrosome amplification is a phenomenon frequently observed in human cancers, so centrosome depletion has been proposed as a therapeutic strategy. However, despite being afflicted with a lack of centrosomes, many cancer cells can still proliferate, implying there are impediments to adopting centrosome depletion as a treatment strategy. Here, we show that TFEB- and TFE3-dependent autophagy activation contributes to acentrosomal cancer proliferation. Our biochemical analyses uncover that both TFEB and TFE3 are novel PLK4 (polo like kinase 4) substrates. Centrosome depletion inactivates PLK4, resulting in TFEB and TFE3 dephosphorylation and subsequent promotion of TFEB and TFE3 nuclear translocation and transcriptional activation of autophagy- and lysosome-related genes. A combination of centrosome depletion and inhibition of the TFEB-TFE3 autophagy-lysosome pathway induced strongly anti-proliferative effects in cancer cells. Thus, our findings point to a new strategy for combating cancer.Abbreviations: AdCre: adenoviral Cre recombinase; AdLuc: adenoviral luciferase; ATG5: autophagy related 5; CQ: chloroquine; DAPI: 4',6-diamidino-2-phenylindole; DKO: double knockout; GFP: green fluorescent protein; KO: knockout; LAMP1: lysosomal associated membrane protein 1; LAMP2: lysosomal associated membrane protein 2; LTR: LysoTracker Red; MAP1LC3B/LC3B: microtubule associated protein 1 light chain 3 beta; MITF: melanocyte inducing transcription factor; PLK4: polo like kinase 4; RFP: red fluorescent protein; SASS6: SAS-6 centriolar assembly protein; STIL: STIL centriolar assembly protein; TFEB: transcription factor EB; TFEBΔNLS: TFEB lacking a nuclear localization signal; TFE3: transcription factor binding to IGHM enhancer 3; TP53/p53: tumor protein p53.

Keywords: Anti-cancer therapy; PLK4; autophagy; centrosome; lysosomal biogenesis; transcription factor E3; transcription factor EB.


Conflict of interest statement

No potential conflict of interest was reported by the author(s).

Figures

Figure 1.
Figure 1.
Centrosome loss induces vesicle accumulation within cells. (A) Cells were treated with DMSO or centrinone for 4 days and then performed phase-contrast imaging. Regions within the marked boxes were magnified in right to highlight the changes. Scale bars are as indicated. (B) Percentage of cells showing abnormally vacuole accumulation was quantified. (C) PLK4flox/neoflox cells were infected with AdLuc or AdCre for 4 days. Centrosome number was counted by TUBG1 staining. (D) AdLuc- or AdCre-infected PLK4flox/neoflox cells were cultured for 4 days. Images were taken by phase-contrast light microscope. Regions within the marked boxes were magnified in right. Scale bars are as indicated. (E) Percentage of cells showing abnormally vacuole accumulation from (D) was quantified. (F) WB analysis of the control (TP53 KO) and two acentrosome (SASS6 TP53 DKO and STIL TP53 DKO) RPE1 cells was performed using antibodies as indicated. (G) Phase-contrast imaging of the TP53 KO, SASS6 TP53 DKO, and STIL TP53 DKO RPE1 cells. Regions within the marked boxes were magnified in right. Scale bars are as indicated. (H) Percentage of cells showing vacuole accumulation was quantified. (I) Cells were treated with doxycycline (1 μg/ml) for 4 days. Cells were fixed followed by staining with indicated antibodies. Nuclei were stained with DAPI (blue). Scale bar: 25 μm. (J) The percentage of cells showing more than 2 TUBG1 foci was quantified. (K) Images from (I) were taken by phase-contrast light microscope. Regions within the marked boxes were magnified in right. Scale bars are as indicated. In (B), (C), (E), (H), and (J), at least 200 cells from n = 3 independent experiments were tested. Error bars represent the mean ± SEM. *** P < 0.001 by Student’s t test.
Figure 2.
Figure 2.
Centrosome loss enhances lysosome biogenesis. (A) Experimental workflow of SILAC-based proteomic analysis. (B) Heatmap shows lysosomal proteins that were identified in the screen from two independent experiments (Exp 1 and Exp 2). (C) Cells were treated with DMSO or centrinone for 4 days followed by immunostaining using anti-LAMP2 (green) and anti-TUBG1 (red) antibodies. Regions within the marked boxes were magnified for clarity. Scale bars are as indicated. (D) Cells were treated with DMSO or centrinone (Cen) for 4 days. The levels of LAMP1, LAMP2, and EEA1 were analyzed by WB analyses. Band intensities were quantified using ImageJ software. Data were collected from at least three independent experiments. Error bars represent the mean ± SD. n.s. not significant, *** P < 0.001, ** P < 0.01, * P < 0.05 by Student’s t test. (E) Cells were treated with DMSO or centrinone for 4 days followed by loading with LysoTracker Red dye for 30 min before imaging. Regions within the marked boxed were cropped and magnified in the right. Scale bar: 25 μm. (F) The relatively fluorescent intensities of LysoTracker signals from (E) were quantified. (G) Lysosomal activity was measured by performing Z-FR-AMC cleavage assay. (H) Cells were stained with the anti-LAMP2 antibody. Scale bar: 25 μm. (I) LysoTracker Red was loaded in cells for 30 min before imaging. Scale bar: 25 μm. (J) The fluorescent intensities of LysoTracker signals from (I) were quantified. (K) Lysosomal activity was measured by performing Z-FR-AMC cleavage assay. In (F) (G), (J), and (K), three independent experiments were tested. Error bars represent the mean ± SEM. *** P < 0.001, ** P < 0.01 by Student’s t test.
Figure 3.
Figure 3.
Centrosome loss leads to autophagy activation. (A) RPE1 and U2OS cells were treated with DMSO or centrinone and stained with antibodies as indicated. Regions within the marked boxes were magnified for clarity. Nuclei were stained with DAPI. Scale bars are as indicated. The size and number of LC3 puncta were quantified and shown in the right. (B) WB analysis was performed to examine the levels of LC3 and SQSTM1/p62 with ACTB as the loading control. The fold changes of LC3-II to LC3-I ratio and SQSTM1/p62 levels were quantified. (C) Cells were fixed and processed for immunofluorescence with anti-TUBG1 (green) and anti-LC3 (red) antibodies. Nuclei were stained with DAPI. The representative images were shown. Scale bars are as indicated. Graph represents the size and number of LC3 puncta per cell. (D) PLK4flox/neoflox cells were infected with AdLuc or AdCre for 4 days. Cells were fixed and stained with antibodies as indicated. Regions within the marked boxes were magnified for clarity. Nuclei were stained with DAPI. Scale bars are as indicated. (E) Graph represents the size and number of LC3 puncta per cell. (F) WB analysis was performed to examine LC3 level in AdLuc- or AdCre-treated cells. ACTB was served here as the loading control. The LC3-II to LC3-I ratio was quantified and shown in the right. (G) Representative TEM u-ltrastructural images of SASS6 TP53 DKO and STIL TP53 DKO cells. Regions within the marked boxed were magnified and shown in the right. Scale bars are as indicated. (H) Cells were treated with or without chloroquine (CQ) for 16 h followed by WB analysis using antibodies as indicated. S: short exposure. L: long exposure. (I) Band intensities were measured using ImageJ software. (J) DMSO or centrinone was treated in cells stably expressed GFP-LC3-RFP-LC3ΔG for 4 days. For serum free experiment, cells were serum starved for 24 h. Cells were directly visualized under fluorescence microscopy. The GFP:RFP ratiometric comparison was also shown. Scale bar: 25 μm. The quantification of the GFP:RFP ratio was shown in the right. In (A), (C), (E), and (J), at least 200 cells were analyzed per experiment. Data were collected from three independent experiments. Error bars represent the mean ± SEM. *** P < 0.001 by Student’s t test. In (B), (F), and (I), data were collected from at least three independent experiments. Error bars represent the mean ± SD. *** P < 0.001, ** P < 0.01, * P < 0.05 by Student’s t test.
Figure 4.
Figure 4.
Centrosome loss promotes TFEB nuclear translocation. (A) TFEB-GFP was transiently expressed in U2OS cells following DMSO or centrinone treatment for indicated days. The subcellular distribution of TFEB-GFP was seen directly under microscopy. Scale bar: 50 μm. (B) Quantification of TFEB-GFP in the nucleus was shown. More than 150 cells were analyzed per experiment. Data were collected from three independent experiments. Error bars represent the mean ± SEM. *** P < 0.001 by Student’s t test. (C) U2OS cells were treated with DMSO or centrinone for 4 days. For HBSS experiment, cells were treated with HBSS buffer for 2 h. Cells were fixed and stained with antibodies as indicated. Scale bar: 50 μm. (D) Cells were subjected to nuclear and cytosolic fractionation followed by WB analysis with antibodies as indicated. LMNA and GAPDH was used as nuclear and cytosolic marker, respectively. TCL: total cell lysate. The nuclear:TCL ratio of TFEB from the immunoblots was quantified. (E) HA-TFEB-expressing cells were treated with DMSO or centrinone for 4 days. TFEB-ChIP-qPCR analysis was performed to analyze the binding of TFEB at its target genes. The increased folds of TFEB at those genes were quantified by normalizing the centrinone-treated samples to DMSO-treated controls. (F) U2OS cells were treated with DMSO or centrinone for 4 days. The expression of TFEB target genes was analyzed by qPCR analysis. Data were normalized to an internal control (RPL19) and plotted as fold change induction above DMSO arbitrarily set as 1. In (E) and (F), error bars represent the mean ± S.D. from at least three independent experiments. *** P < 0.001, ** P < 0.01, * P < 0.05 by Student’s t test. (G) U2OS cells were treated with centrinone for different days. Cell lysate described above was analyzed by WB analysis using antibodies as indicated. (H) Band intensities from (G) were quantified. In (D) and (H), data were from three independent experiments. Error bars represent the mean ± SD. n.s. not significant, *** P < 0.001, ** P < 0.01 by Student’s t test.
Figure 5.
Figure 5.
TFEB is involved in regulating centrosome loss-induced autophagy and lysosome biogenesis. (A) RPE1 cells were infected with lentivirus carrying luciferase or TFEB shRNAs followed by treating with DMSO or centrinone for additional 4 days. The TFEB levels were examined by WB analysis with ACTB as the loading control. (B) RPE1 cells were infected with lentivirus carrying luciferase or TFEB shRNAs followed by DMSO or centrinone treatment for 4 days. Cells were fixed and stained with antibodies as indicated. Typical images were presented. Scale bars: 25 μm. (C) The percentage of cells showing more than 30 LC3 puncta (diameter from 1 to 3 μm) per cell was quantified. (D) GFP-LC3-RFP-LC3ΔG-expressing RPE1 cells were infected with lentivirus carrying luciferase or TFEB shRNAs followed by DMSO or centrinone treatment for 4 days. Cells were visualized under fluorescent microscopy. The GFP:RFP ratiometric comparison was also shown. Scale bar: 25 μm. (E) The GFP:RFP ratio from (D) was quantified. (F) WT TFEB and its NLS mutant (TFEBΔNLS) were stably expressed in TFEB KO U2OS cells. WB analysis was performed with anti-TFEB and anti-ACTB antibodies. (G) Cells were treated with DMSO or centrinone for 4 days and stained with antibodies as indicated. Nuclei were stained withDAPI. Scale bar: 25 μm. (H) Quantification of TFEB signals in the nucleus from (G) was shown. (I) WB analyses were performed to examine the levels of LAMP1, LAMP2, TFEB, and LC3. ACTB was used here as the internal control. (J) Band intensities of LC3-II, LAMP1, and LAMP2 were quantified using ImageJ software. Data were collected from at least three independent experiments. Error bars represent the mean ± SD. n.s. not significant, ** P < 0.01, * P < 0.05 by Student’s t test. (K) Percentage of cells showing abnormally vesicle accumulation was quantified. In (C), (E), (H) and (K), at least 200 cells from n = 3 independent experiments were tested. Error bars represent the mean ± SEM. n.s. not significant, *** P < 0.001 by Student’s t test.
Figure 6.
Figure 6.
Phosphorylation of TFEB by PLK4 prevents TFEB activation. (A and B) HA-tagged WT TFEB (A) and TFEBΔNLS (B) were stably expressed in TFEB KO U2OS cells. Cells were treated with DMSO or centrinone (Cen) for 3 days. Anti-HA IP assay was performed to pull down HA-tagged WT TFEB and TFEBΔNLS followed by WB analyses with antibodies as indicated. TFEB phosphorylation was quantified and shown in the right. (C) WT PLK4 and PLK4 KD were ectopically expressed in HA-TFEB-expressing cells. Anti-HA IP assay was performed to pull down HA-TFEB followed by WB analyses with antibodies as indicated. (D) WT PLK4 and PLK4 KD were ectopically expressed in cells that stably expressed HA-tagged WT TFEB or TFEBS459A. Anti-HA IP assay was performed to pull down HA-TFEB followed by WB with antibodies as indicated. The levels of WT TFEB and TFEBS459A phosphorylation were quantified and shown in the right. (E) HA-tagged WT TFEB, TFEBS401A, TFEBS459A, and TFEBS467A were transiently expressed in TFEB KO U2OS cell followed by TFEB staining. DAPI staining indicates the nucleus. Scale bar: 25 μm. The percentage of cells that showed nucleus-localized TFEB was quantified. (F) HA-tagged WT TFEB and TFEBS459D were stably expressed in TFEB KO U2OS. Cells were treated with DMSO or centrinone for 4 days. TFEB subcellular localization was analyzed. DAPI staining indicates the nucleus. Scale bar: 25 μm. The percentage of cells that showed nucleus-localized TFEB was quantified. (G) WB analysis was performed with antibodies as indicated. (H) Band intensities of LC3-II, LAMP1, and LAMP2 from (G) were quantified. (I) DMSO or centrinone was treated in HA-tagged WT TFEB, TFEBΔNLS, and TFEBS459D-expressing cells for 4 days. LysoTracker Red was loaded into cells for 30 min before imaging. The fluorescent intensities of LysoTracker were quantified. In (A), (B), (D), and (H), data were from three independent experiments. Error bars represent the mean ± SD. n.s. not significant, *** P < 0.001, ** P < 0.01, * P < 0.05 by Student’s t test. In (E), (F), and (I), at least 200 cells from n = 3 independent experiments were tested. Error bars represent the mean ± SEM. n.s. not significant, *** P < 0.001 by Student’s t test.
Figure 7.
Figure 7.
PLK4 phosphorylates TFE3 at Ser560. (A) Sequence alignment of TFEB proteins at C-terminus from the following species. A region surrounding the PLK4 phosphorylation site on human TFEB was magnified here. Position 459 refers to the human TFEB protein sequence. The relevant TFEB phosphorylation sites are also listed. (B) The intra-family sequence alignment of TFEB Ser459 residue. (C) HA-tagged TFE3- and MITF-expressing cells were treated with DMSO or centrinone for 4 days. Cells were fixed and stained with antibodies as indicated. Scale bar: 50 μm. Quantifications of HA-TFE3 and HA-MITF signals in the nucleus were shown. (D) Cells were subjected to nuclear and cytosolic fractionation followed by WB analysis with antibodies as indicated. LMNA and GAPDH was used as nuclear and cytosolic marker, respectively. TCL: total cell lysate. The nuclear:TCL ratio of TFE3 from the immunoblots was quantified. (E) HA-TFE3-expressing cells were treated with DMSO or centrinone (Cen) for 4 days. HA-TFE3 was pulled down and TFE3 phosphorylation was examined. TCL: total cell lysate. The levels of TFE3 phosphorylation were quantified. (F) WT PLK4 and PLK4 KD were ectopically expressed in cells that stably expressed HA-TFE3. Anti-HA IP assay was performed to pull down HA-TFE3 followed by WB analysis to measure TFE3 phosphorylation. (G) WT PLK4 and PLK4 KD were ectopically expressed in cells that stably expressed HA-TFE3 or HA-TFE3S560A. Anti-HA IP assay was performed to pull down HA-TFE3 followed by WB analysis with antibodies as indicated. The levels of WT TFE3 and TFE3S560A phosphorylation were quantified and shown in the right. (H) HA-TFE3 and HA-TFE3S560A were expressed in U2OS cells. Cells were fixed and stained with anti-HA antibody. DNA was stained by DAPI. Scale bar: 50 μm. The percentage of cells showing nuclear TFE3 signal was quantified and shown in the right. In (C) and (H), at least 200 cells for each condition from n = 3 independent experiments were tested. Error bars represent the mean ± SEM. n.s. not significant, *** P < 0.001 by Student’s t test. In (D), (E), and (G), immunoblots were quantified. Error bars represent the mean ± S.D. from at least three independent experiments. n.s. not significant, *** P < 0.001, ** P < 0.01 by Student’s t test. (I) The diagram shows that centrosome loss inactivates PLK4 and results in TFEB and TFE3 dephosphorylation and nuclear translocation to promote autophagy and lysosome biogenesis.
Figure 8.
Figure 8.
Autophagy is required for centrosome loss-induced cell-cycle arrest in normal cells and supports cancer proliferation in the absence of centrosomes. (A) ATG5 gene was knocked out in RPE1, U2OS, and H1299 cells. WB analysis was performed to confirm the depletion of ATG5 protein. ACTB was used as the loading control. (B) WT and ATG5 KO RPE1 cells were treated with centrinone for indicated days. Cell death was examined. (C) PLK4flox/neoflox cells were infected with AdLuc or AdCre for 8 days and assayed for the cell death. (D) RPE1 cells were treated with centrinone, chloroquine, or their combination for 8 days and assayed for the cell death. (E) Control and TFEB knockdown RPE1 cells were treated with DMSO or centrinone for 8 days and assayed for the cell death. (F) Cancer cells were treated with DMSO or centrinone for 4 days and performed WB analysis to examine LC3-II level. ACTB was served here as the loading control. S: short exposure. L: long exposure. (G) WT and ATG5 KO U2OS and H1299 cells were treated with DMSO or centrinone for indicated days. Cancer cell proliferation was quantified. (H) LC3B gene was knocked out in U2OS cells. WB analysis was performed to confirm the depletion of LC3B protein. ACTB was used as the loading control. (I) WT and LC3B KO U2OS cells were treated with centrinone followed by performing the cell proliferation assay. (J) Cell proliferation assay was performed in U2OS cells treated with centrinone or the combination of centrinone and chloroquine (CQ). (K) WB analysis was performed with indicated antibodies. ACTB was used as the loading control. (L) WT, TFEB KO, and TFEB TFE3 DKO U2OS cells were treated with centrinone followed by performing the cell proliferation assay. In (B), (C), (D), (E), (G), (I), (J), and (L), data were collected from three independent experiments (n = 3). Error bars represent the mean ± SEM. n.s. not significant, * P < 0.05, ** P < 0.01, *** P < 0.001 by Student’s t test.

Similar articles

Cited by

References

    1. Carvalho-Santos Z, Azimzadeh J, Pereira-Leal JB, et al. Evolution: tracing the origins of centrioles, cilia, and flagella. J Cell Biol. 2011;194:165–175. doi:10.1083/jcb.201011152. - DOI - PMC - PubMed
    1. Hodges ME, Scheumann N, Wickstead B, et al. Reconstructing the evolutionary history of the centriole from protein components. J Cell Sci. 2010;123:1407–1413. doi:10.1242/jcs.064873. - DOI - PMC - PubMed
    1. Azimzadeh J, Bornens M.. Structure and duplication of the centrosome. J Cell Sci. 2007;120:2139–2142. doi:10.1242/jcs.005231. - DOI - PubMed
    1. Zheng Y, Wong ML, Alberts B, et al. Nucleation of microtubule assembly by a gamma-tubulin-containing ring complex. Nature. 1995;378:578–583. doi:10.1038/378578a0. - DOI - PubMed
    1. Pala R, Alomari N, Nauli SM. Primary cilium-dependent signaling mechanisms. Int J Mol Sci. 2017;18:2272. doi:10.3390/ijms18112272. - DOI - PMC - PubMed

Publication types

MeSH terms

Substances