

Distance Correlation-Based Brain Functional Connectivity Estimation and Non-Convex Multi-Task Learning for Developmental fMRI Studies
- PMID: 35316180
- PMCID: PMC9594860
- DOI: 10.1109/TBME.2022.3160447
Distance Correlation-Based Brain Functional Connectivity Estimation and Non-Convex Multi-Task Learning for Developmental fMRI Studies
Abstract
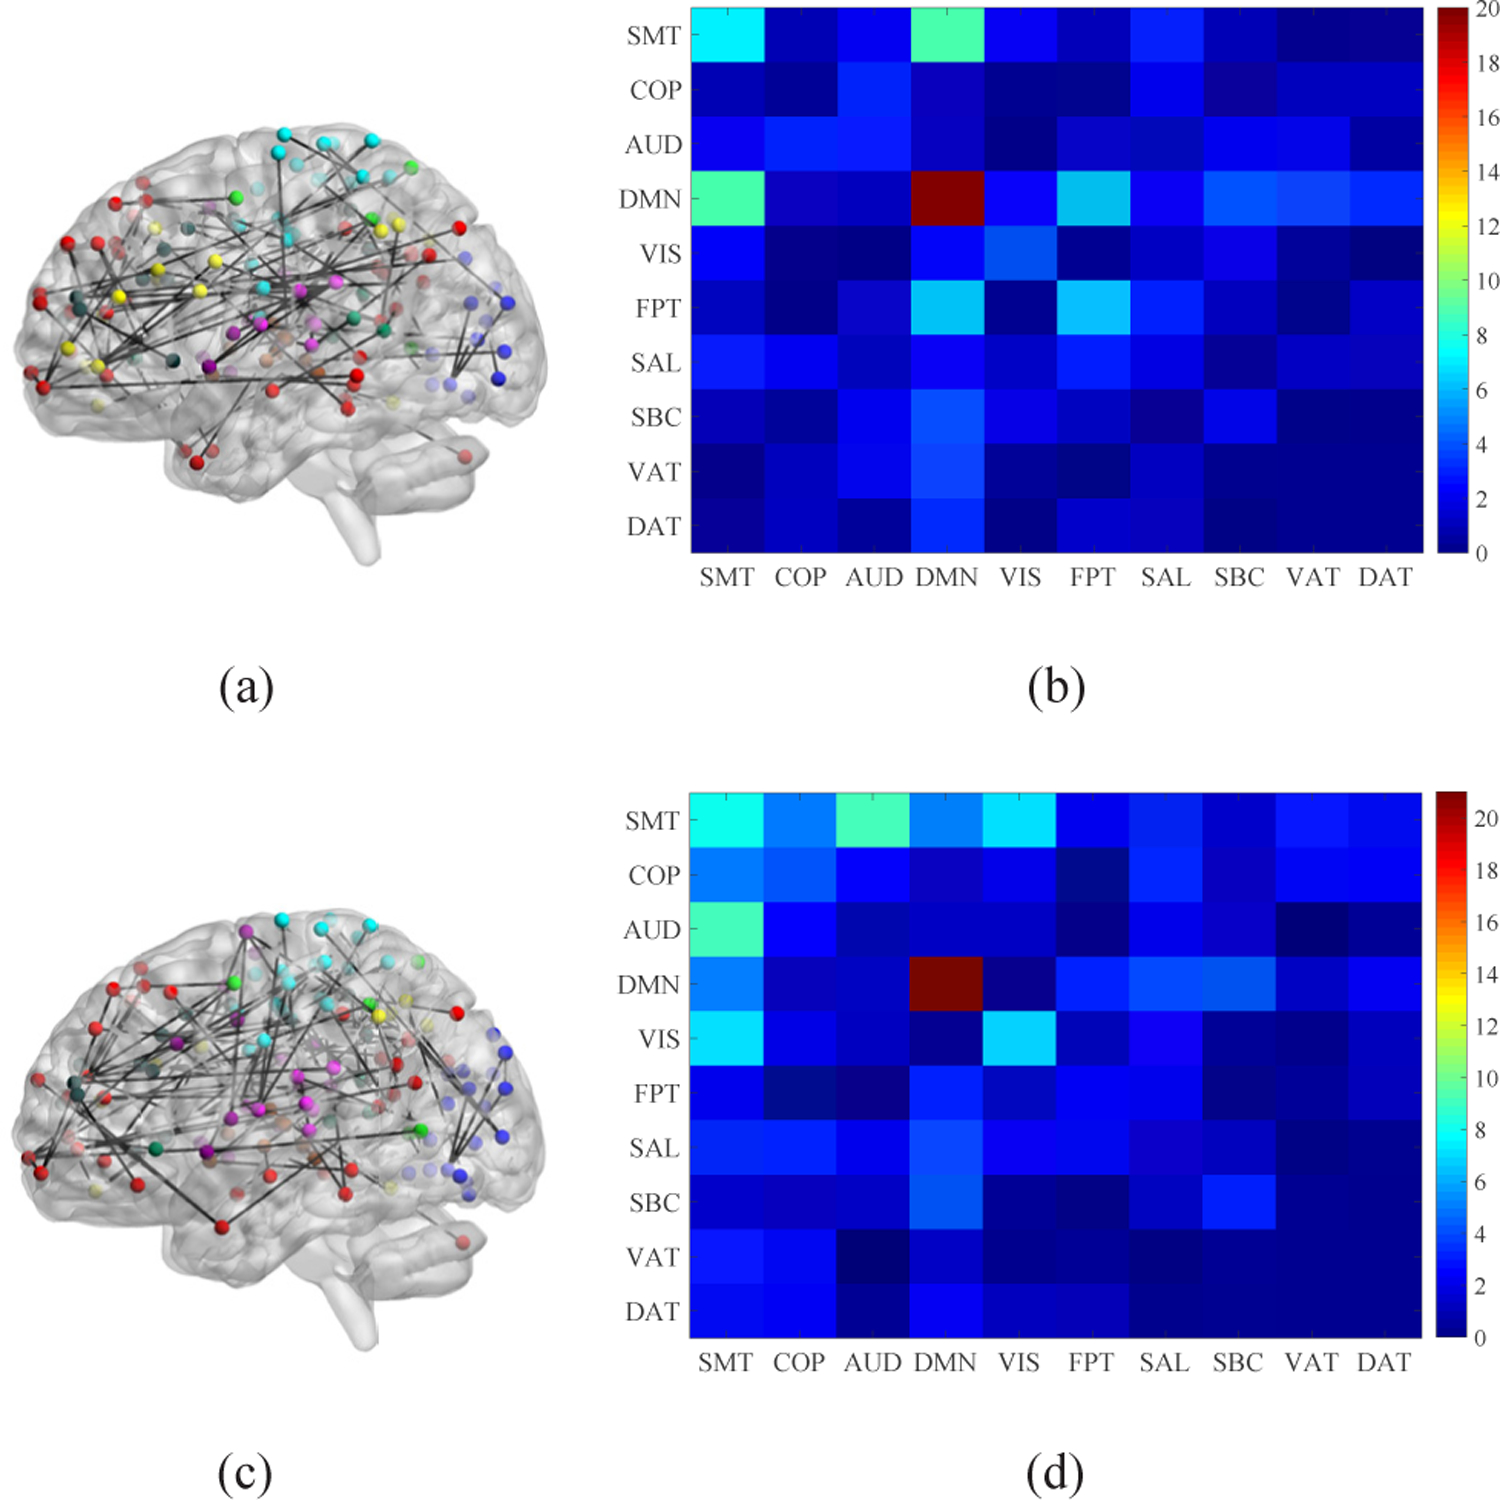
Objective: Resting-state functional magnetic resonance imaging (rs-fMRI)-derived functional connectivity (FC) patterns have been extensively used to delineate global functional organization of the human brain in healthy development and neuropsychiatric disorders. In this paper, we investigate how FC in males and females differs in an age prediction framework.
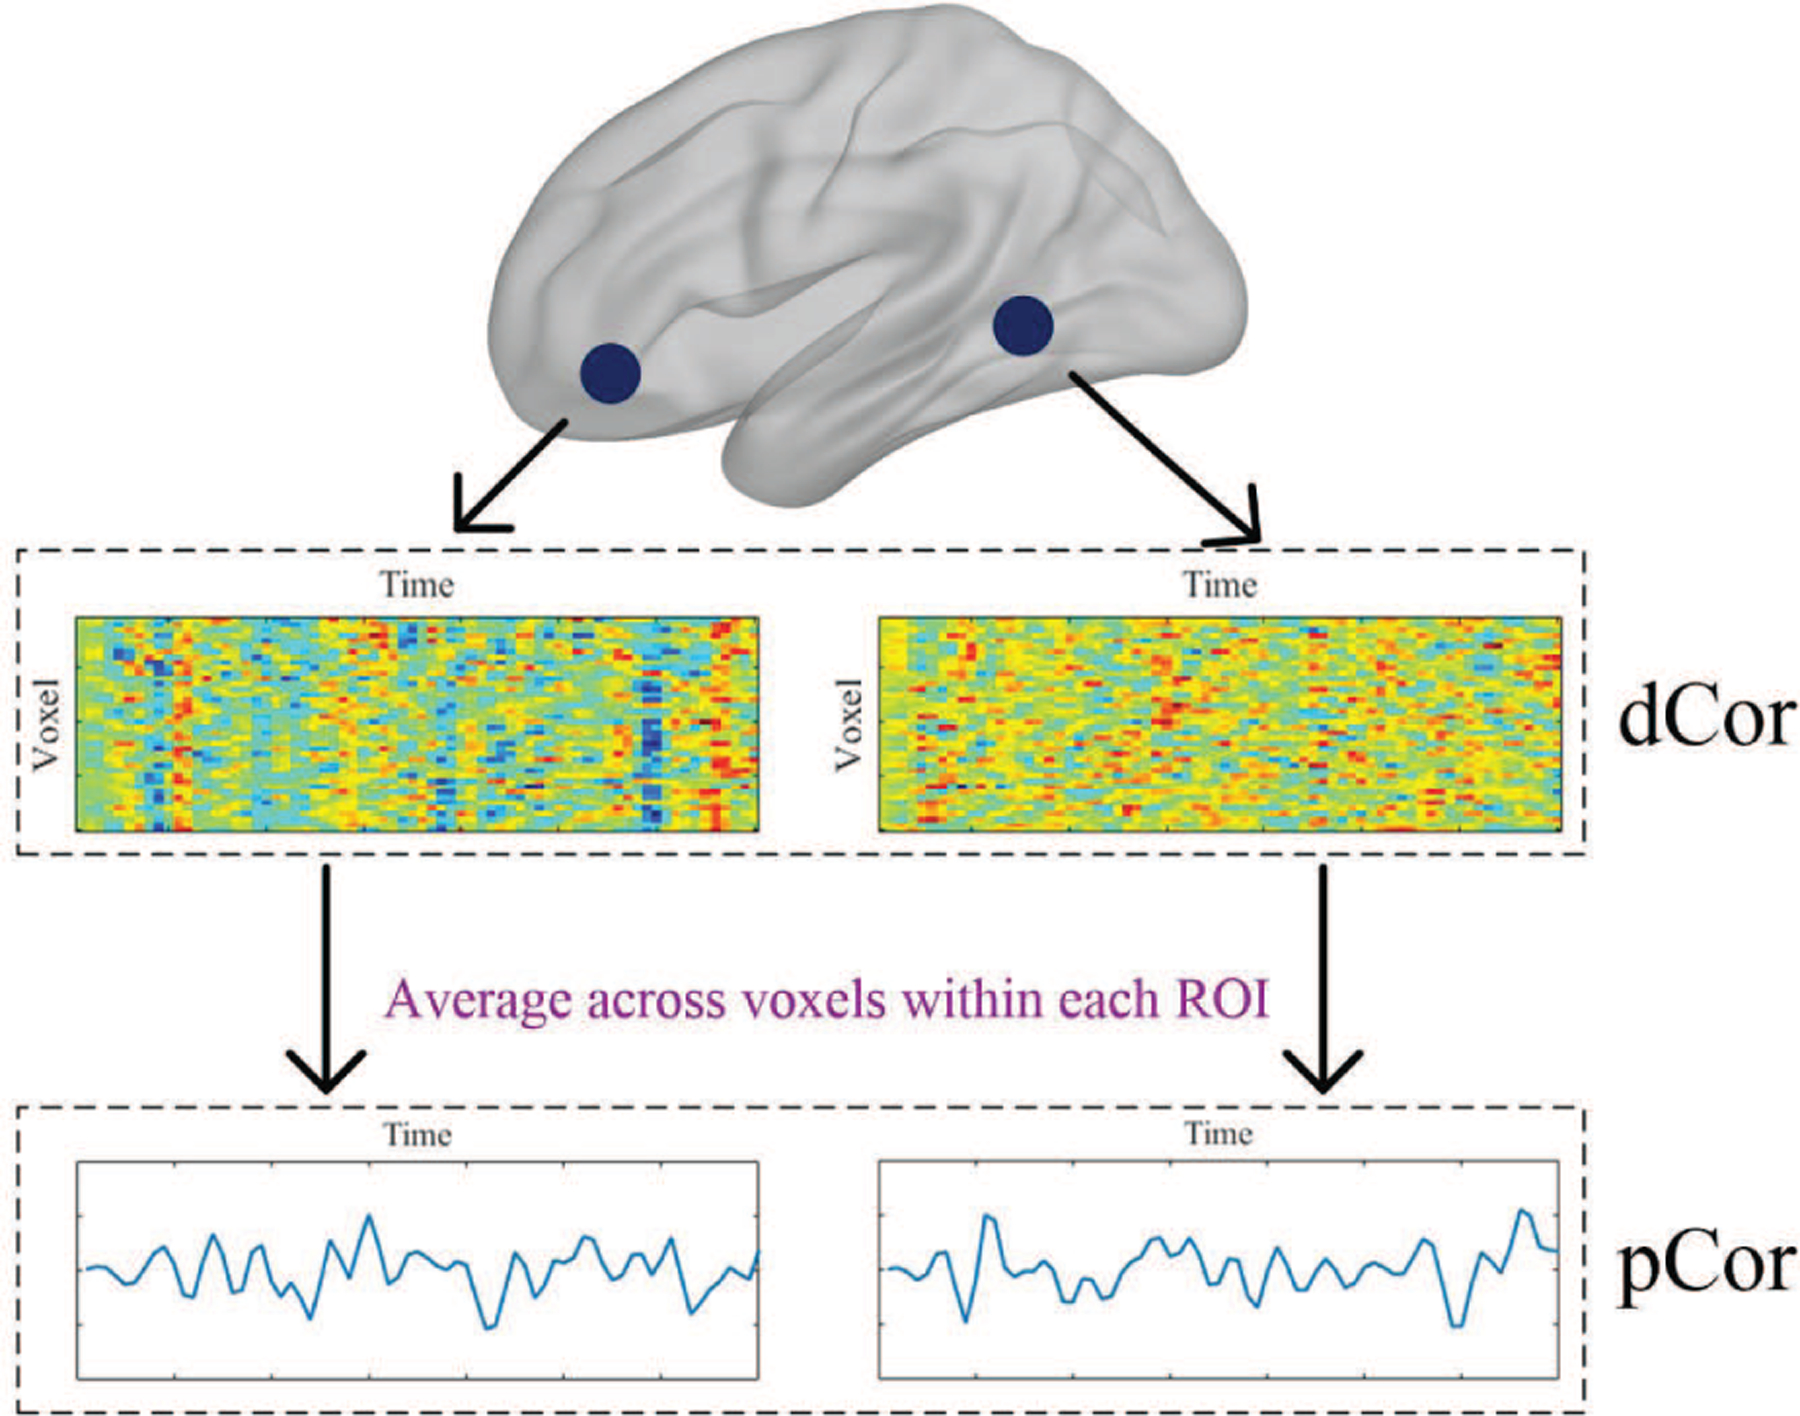
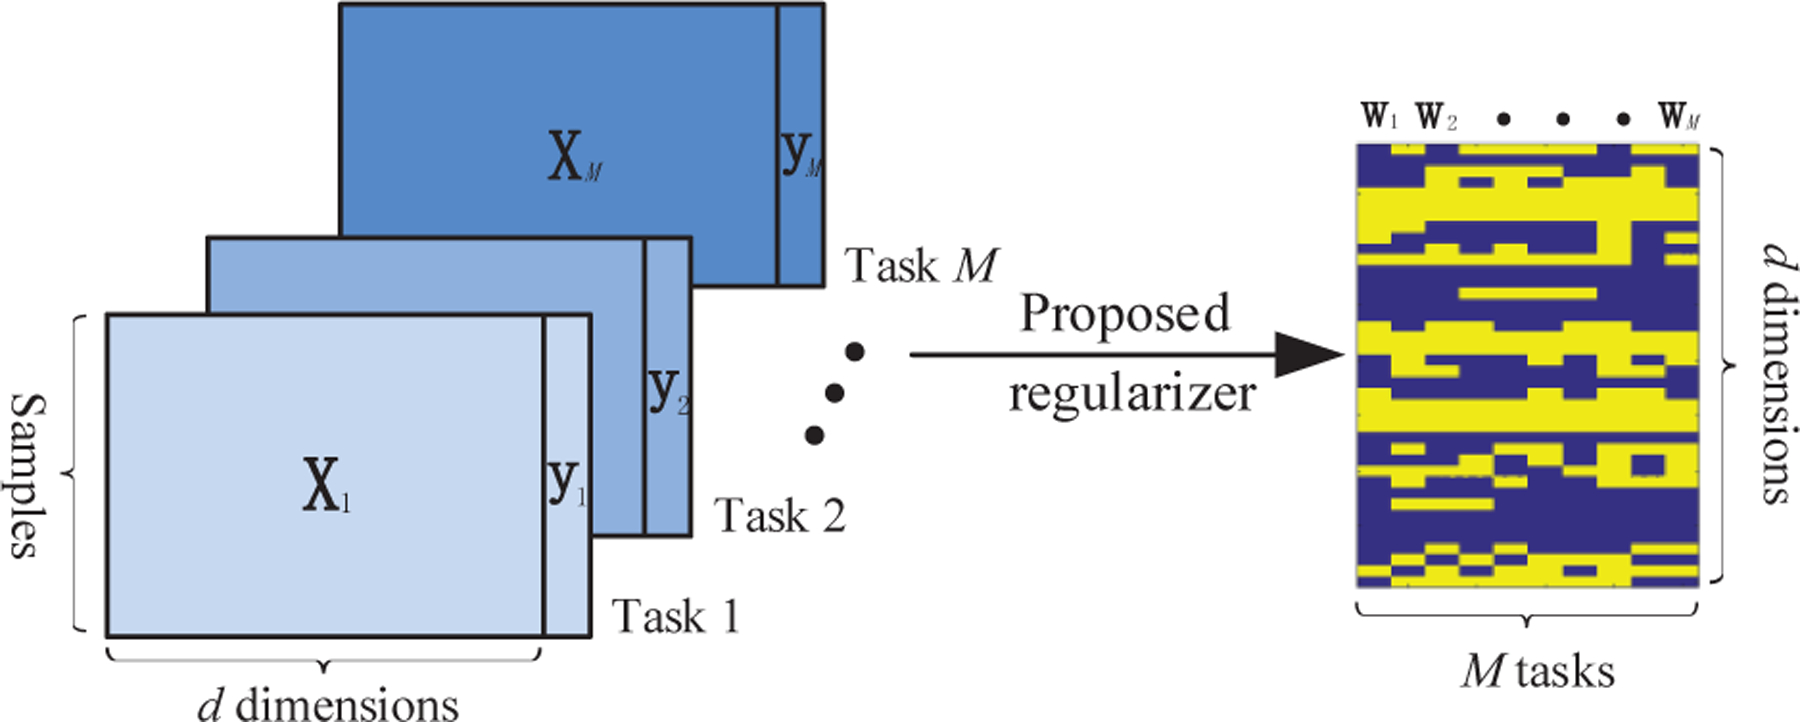
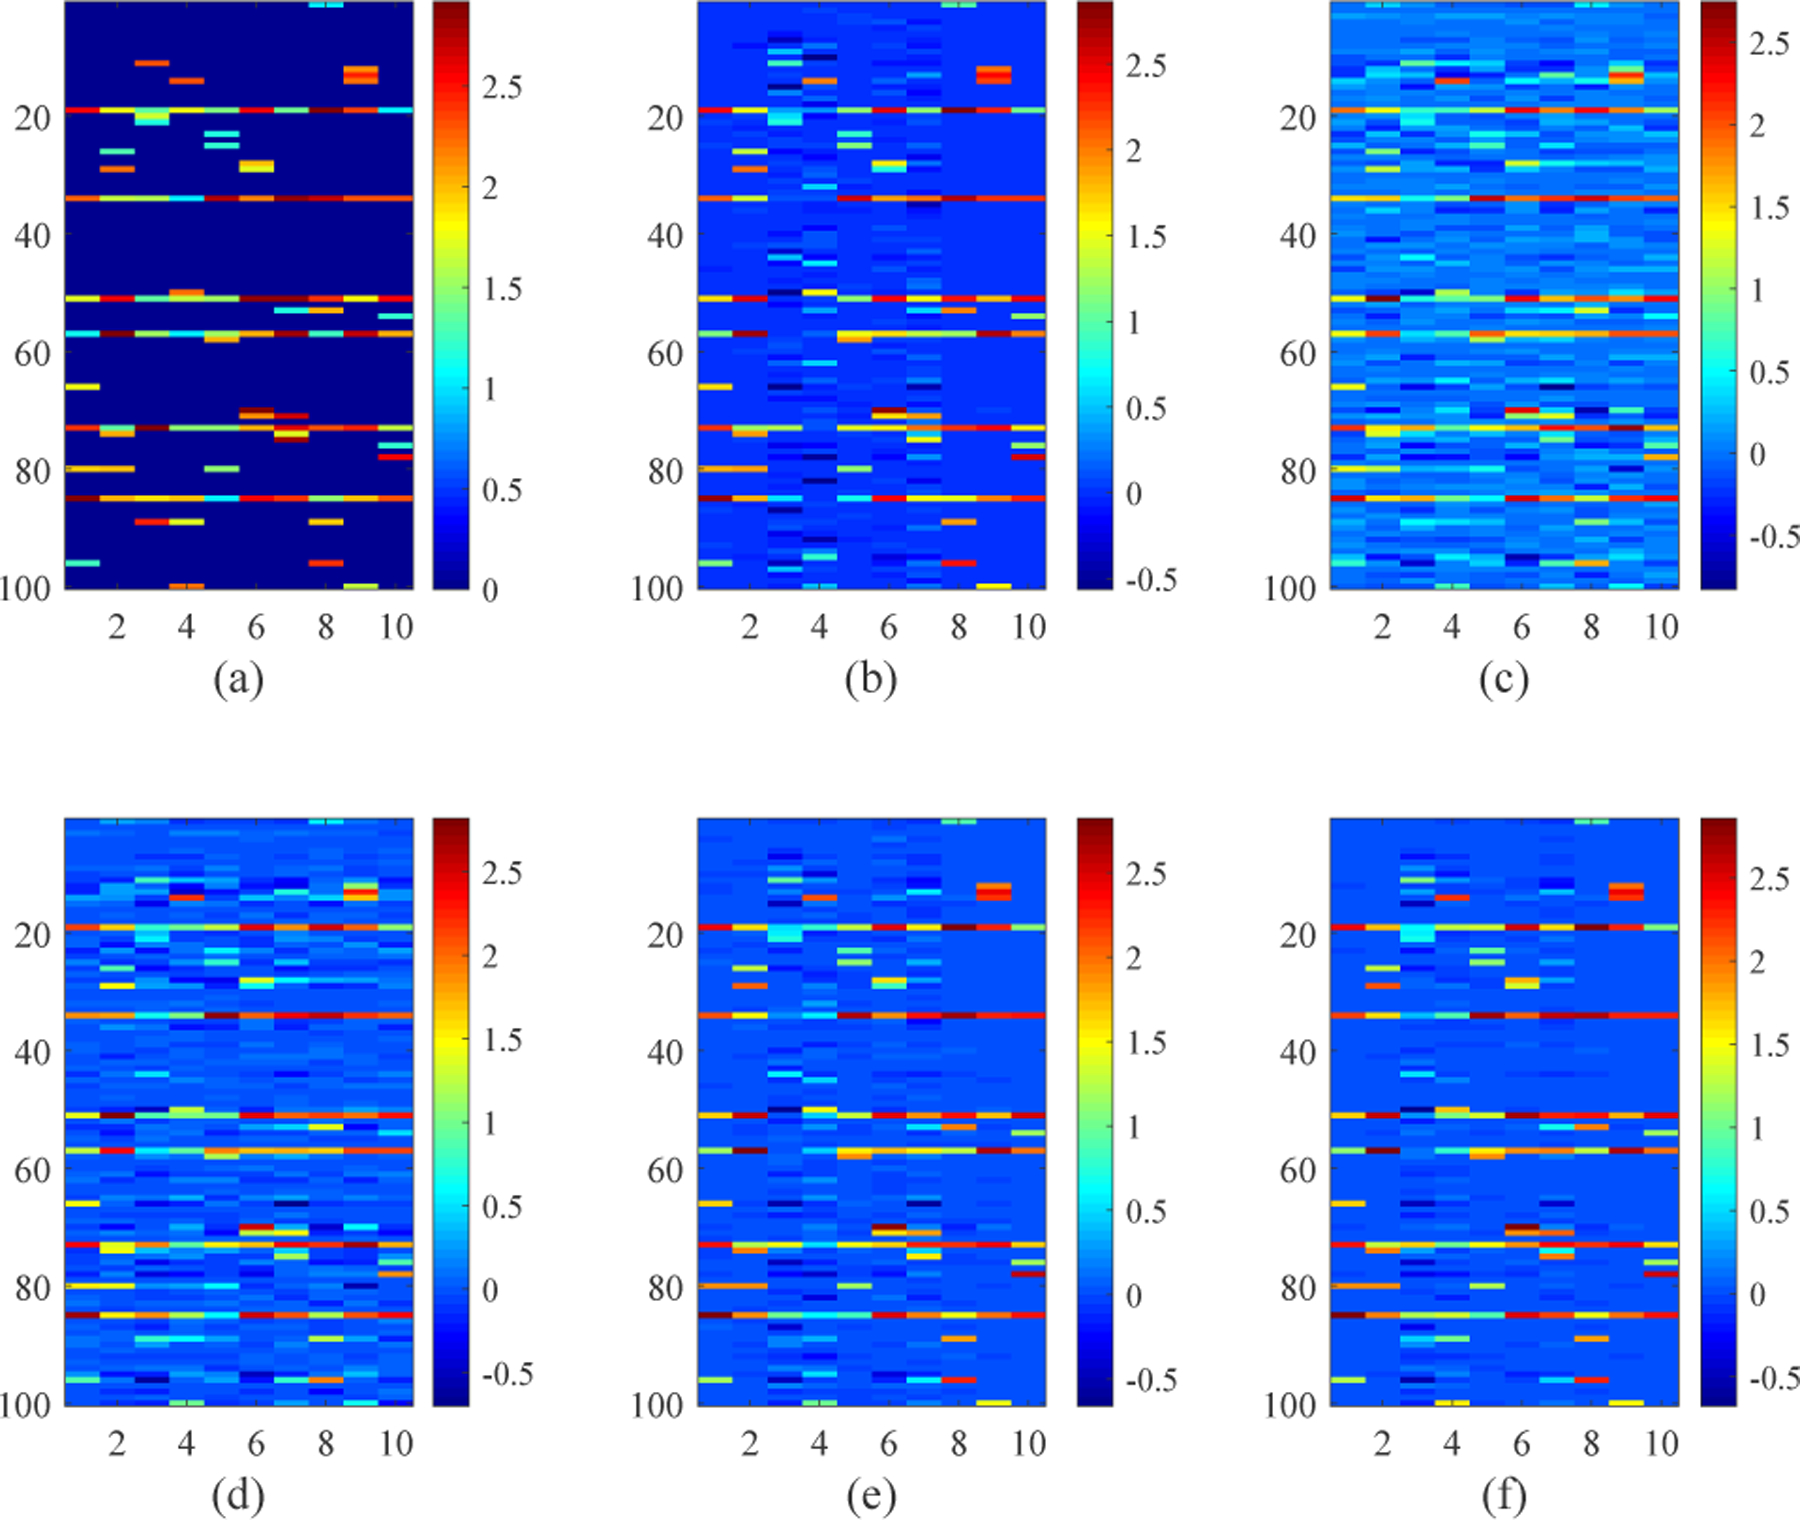
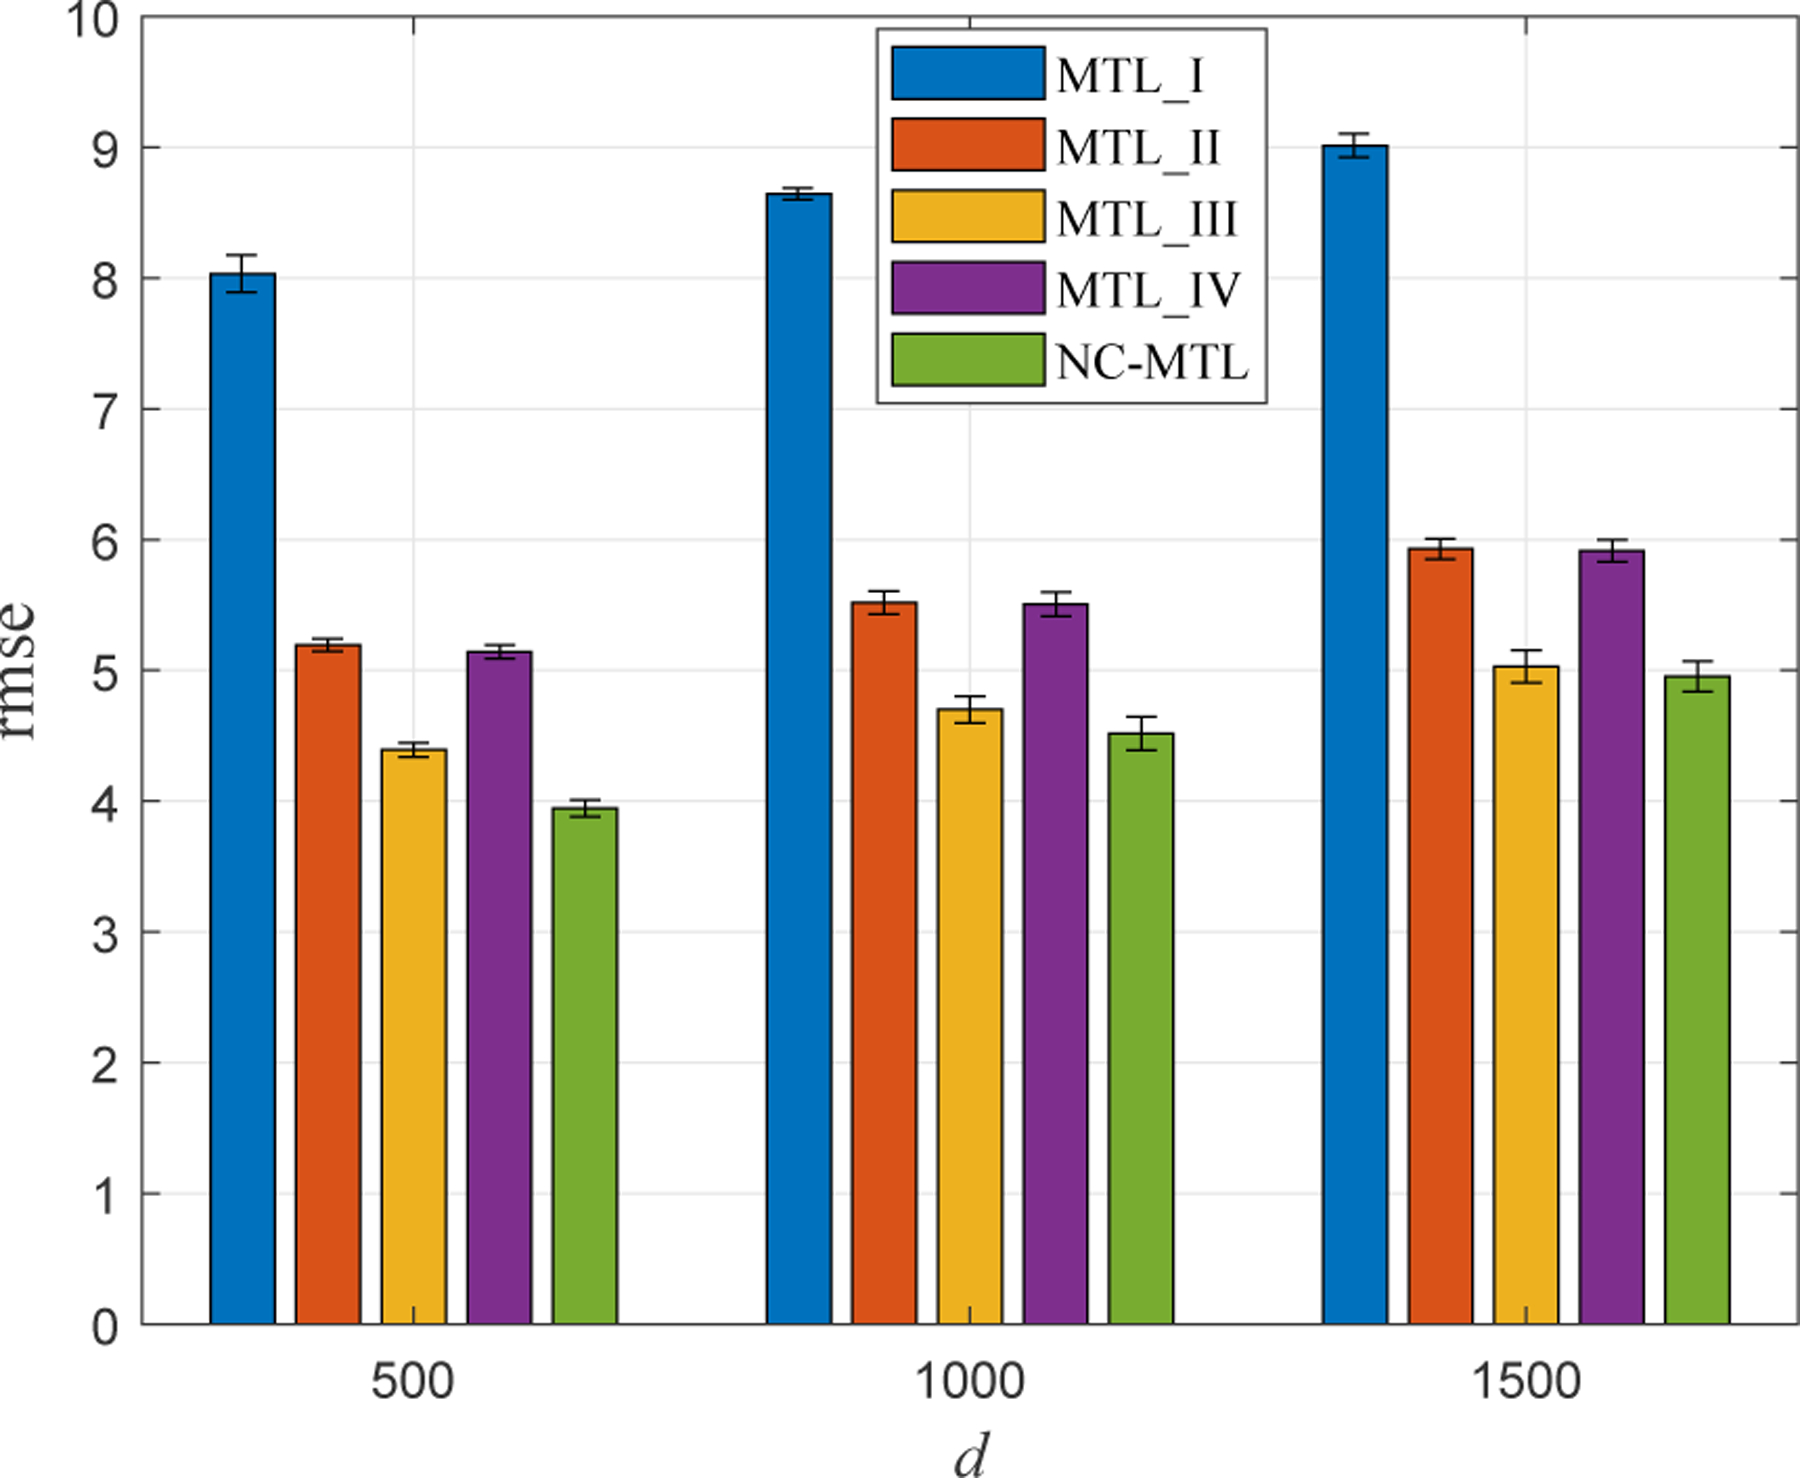
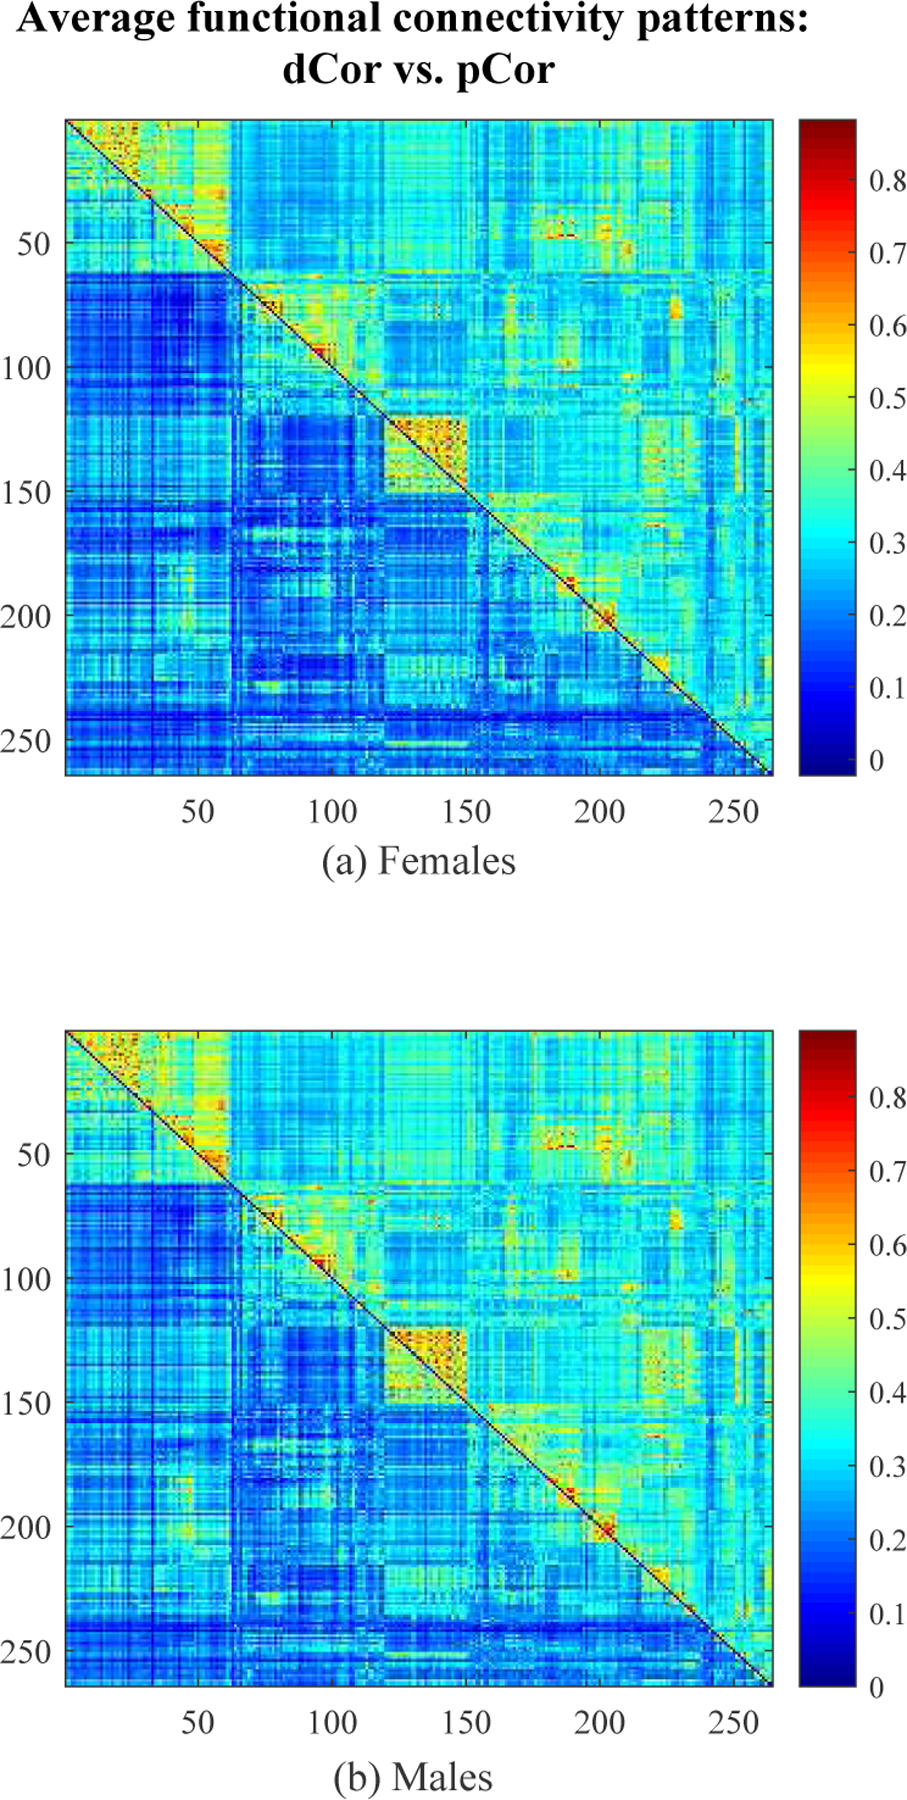
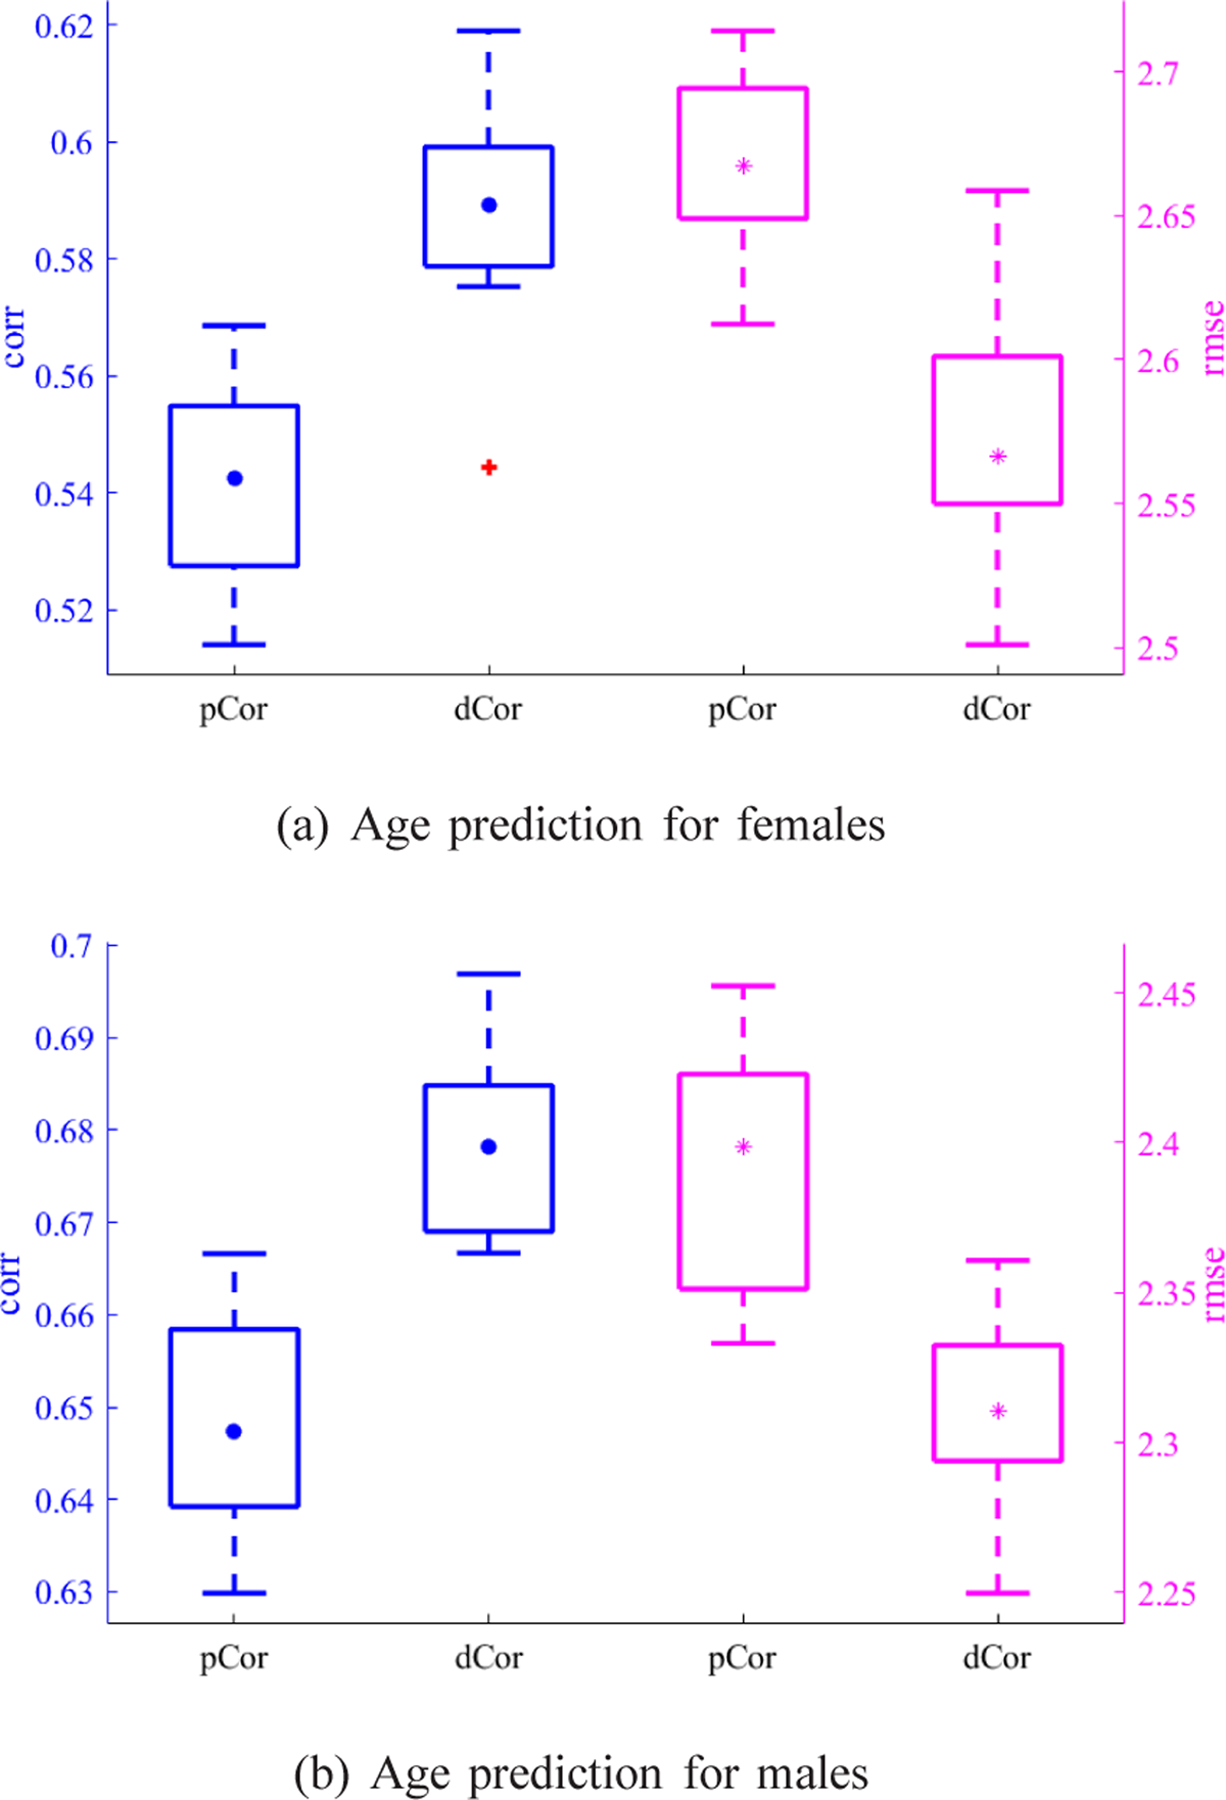
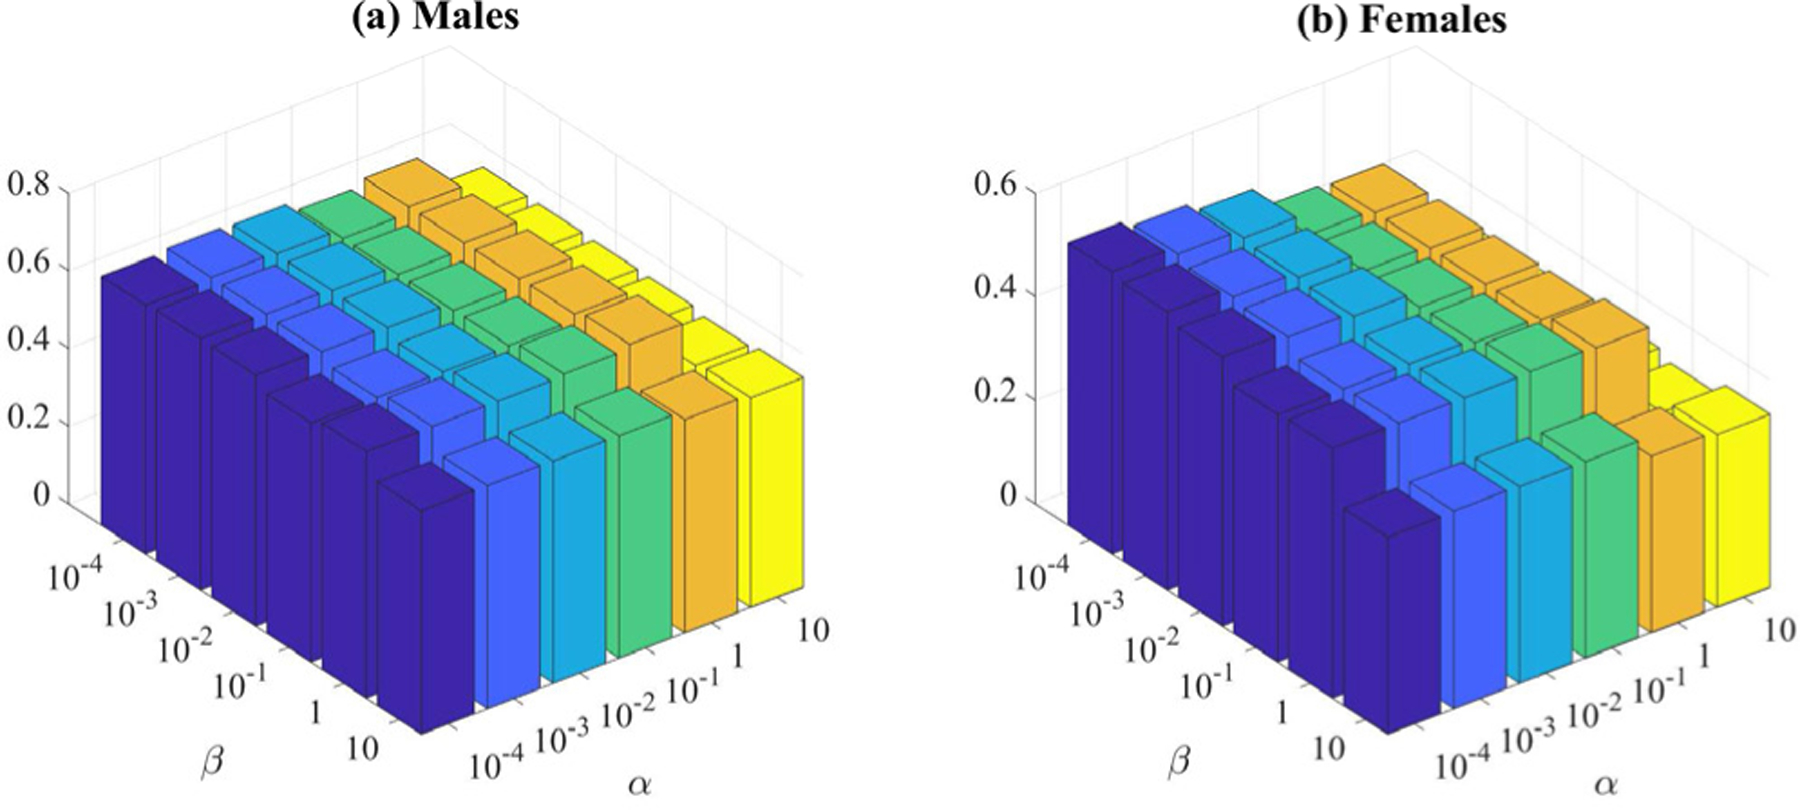
Methods: We first estimate FC between regions-of-interest (ROIs) using distance correlation instead of Pearson's correlation. Distance correlation, as a multivariate statistical method, explores spatial relations of voxel-wise time courses within individual ROIs and measures both linear and nonlinear dependence, capturing more complex between-ROI interactions. Then, we propose a novel non-convex multi-task learning (NC-MTL) model to study age-related gender differences in FC, where age prediction for each gender group is viewed as one task, and a composite regularizer with a combination of the non-convex l2,1-2 and l1-2 terms is introduced for selecting both common and task-specific features.
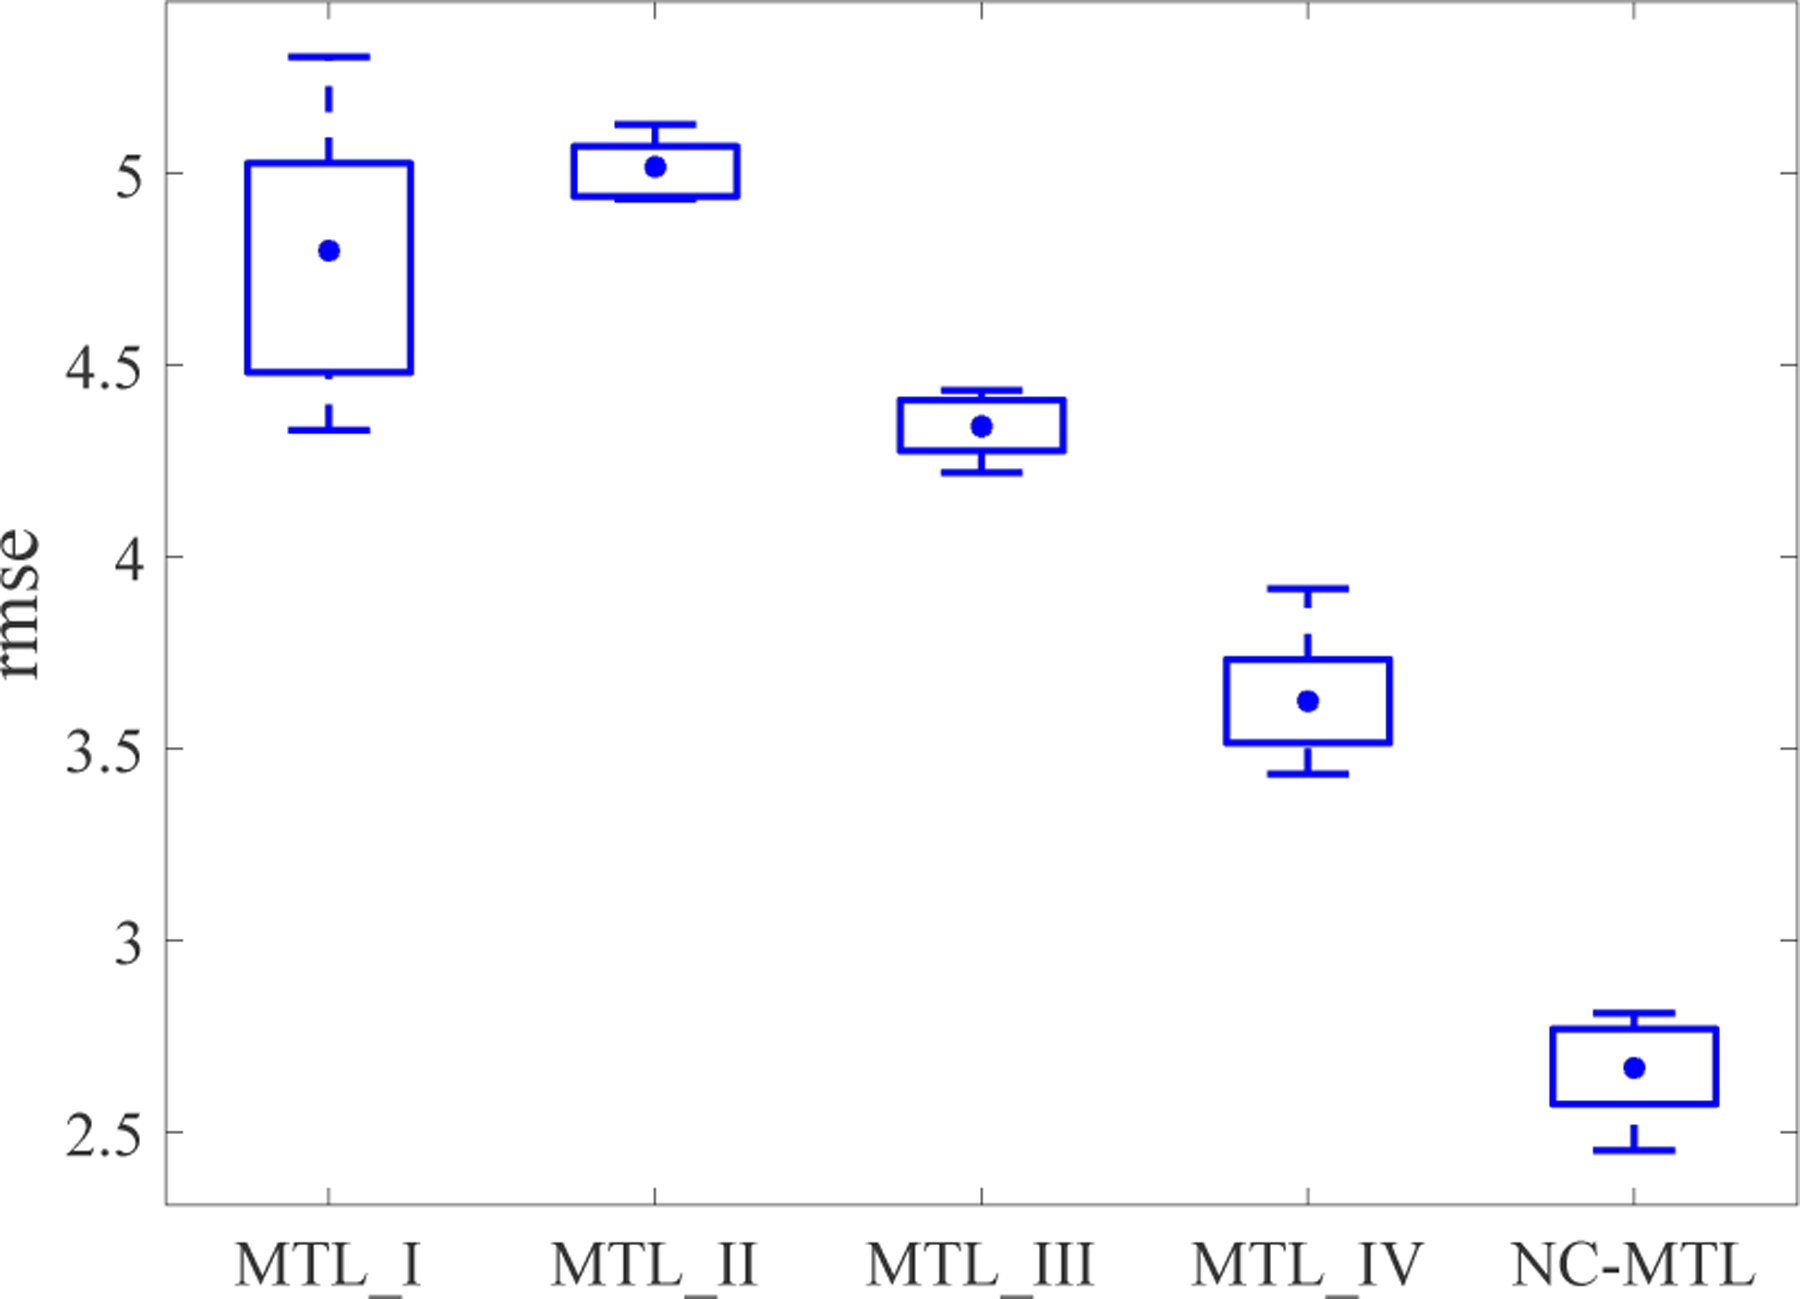
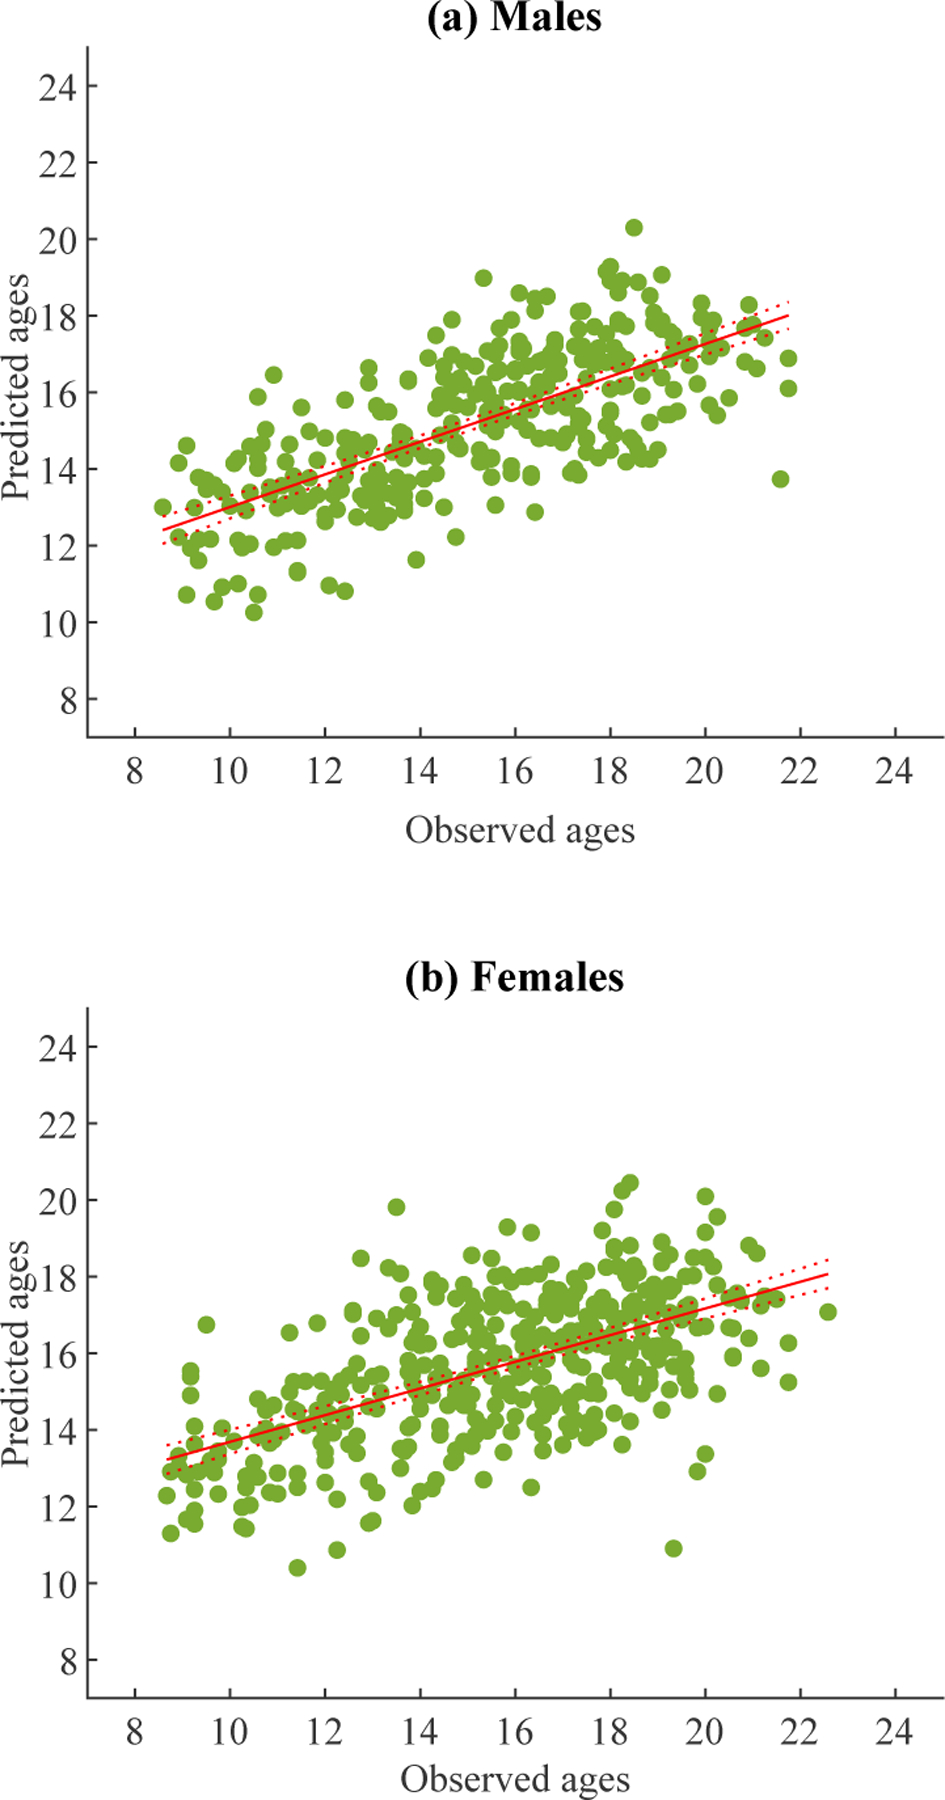
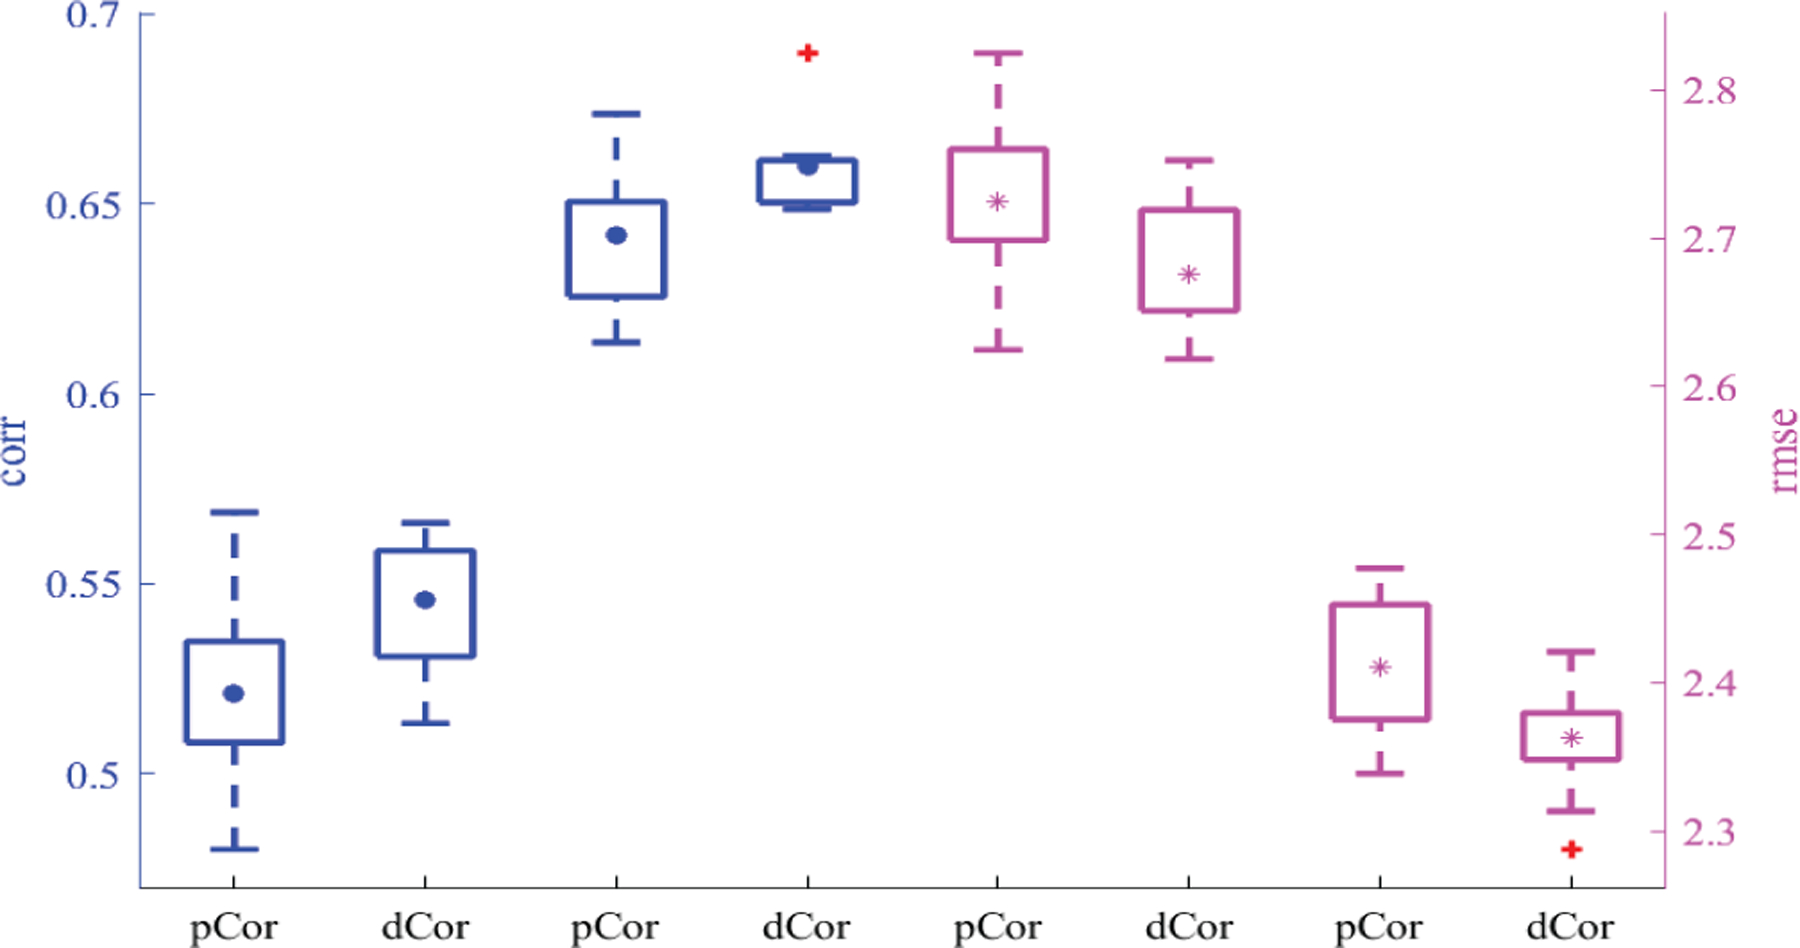
Results and conclusion: We validate the effectiveness of our NC-MTL model with distance correlation-based FC derived from rs-fMRI for predicting ages of both genders. The experimental results on the Philadelphia Neurodevelopmental Cohort demonstrate that our NC-MTL model outperforms several other competing MTL models in age prediction. We also compare the age prediction performance of our NC-MTL model using FC estimated by Pearson's correlation and distance correlation, which shows that distance correlation-based FC is more discriminative for age prediction than Pearson's correlation-based FC.
Significance: This paper presents a novel framework for functional connectome developmental studies, characterizing developmental gender differences in FC patterns.
Figures
Similar articles
-
An information network flow approach for measuring functional connectivity and predicting behavior.Brain Behav. 2019 Aug;9(8):e01346. doi: 10.1002/brb3.1346. Epub 2019 Jul 9. Brain Behav. 2019. PMID: 31286688 Free PMC article.
-
Connectome-based predictive modeling of attention: Comparing different functional connectivity features and prediction methods across datasets.Neuroimage. 2018 Feb 15;167:11-22. doi: 10.1016/j.neuroimage.2017.11.010. Epub 2017 Nov 6. Neuroimage. 2018. PMID: 29122720 Free PMC article.
-
Correlation Guided Graph Learning to Estimate Functional Connectivity Patterns From fMRI Data.IEEE Trans Biomed Eng. 2021 Apr;68(4):1154-1165. doi: 10.1109/TBME.2020.3022335. Epub 2021 Mar 18. IEEE Trans Biomed Eng. 2021. PMID: 32894705 Free PMC article.
-
Partial Correlation-Based Retinotopically Organized Resting-State Functional Connectivity Within and Between Areas of the Visual Cortex Reflects More Than Cortical Distance.Brain Connect. 2016 Feb;6(1):57-75. doi: 10.1089/brain.2014.0331. Brain Connect. 2016. PMID: 26415043 Free PMC article.
-
Interpreting temporal fluctuations in resting-state functional connectivity MRI.Neuroimage. 2017 Dec;163:437-455. doi: 10.1016/j.neuroimage.2017.09.012. Epub 2017 Sep 12. Neuroimage. 2017. PMID: 28916180 Review.
Cited by
-
Integrated Brain Connectivity Analysis with fMRI, DTI, and sMRI Powered by Interpretable Graph Neural Networks.ArXiv [Preprint]. 2025 Apr 13:arXiv:2408.14254v2. ArXiv. 2025. Update in: Med Image Anal. 2025 Jul;103:103570. doi: 10.1016/j.media.2025.103570. PMID: 39253637 Free PMC article. Updated. Preprint.
-
Age-related changes in human brain functional connectivity using graph theory and machine learning techniques in resting-state fMRI data.Geroscience. 2024 Oct;46(5):5303-5320. doi: 10.1007/s11357-024-01128-w. Epub 2024 Mar 18. Geroscience. 2024. PMID: 38499956 Free PMC article.
-
A Bayesian incorporated linear non-Gaussian acyclic model for multiple directed graph estimation to study brain emotion circuit development in adolescence.Netw Neurosci. 2024 Oct 1;8(3):791-807. doi: 10.1162/netn_a_00384. eCollection 2024. Netw Neurosci. 2024. PMID: 39355441 Free PMC article.
References
Publication types
MeSH terms
Grants and funding
- R01 AR059781/AR/NIAMS NIH HHS/United States
- P20 GM144641/GM/NIGMS NIH HHS/United States
- R01 GM109068/GM/NIGMS NIH HHS/United States
- U19 AG055373/AG/NIA NIH HHS/United States
- P20 GM130447/GM/NIGMS NIH HHS/United States
- R01 MH116782/MH/NIMH NIH HHS/United States
- R01 MH104680/MH/NIMH NIH HHS/United States
- R01 MH107354/MH/NIMH NIH HHS/United States
- P20 GM103472/GM/NIGMS NIH HHS/United States
- R56 MH124925/MH/NIMH NIH HHS/United States
- R01 EB005846/EB/NIBIB NIH HHS/United States
- R01 MH121101/MH/NIMH NIH HHS/United States
- R01 EB006841/EB/NIBIB NIH HHS/United States
- R01 MH103220/MH/NIMH NIH HHS/United States
LinkOut - more resources
Full Text Sources
Medical
