. 2022 May 16;132(10):e156125.
doi: 10.1172/JCI156125.

Aerobic exercise elicits clinical adaptations in myotonic dystrophy type 1 patients independently of pathophysiological changes

Affiliations

Aerobic exercise elicits clinical adaptations in myotonic dystrophy type 1 patients independently of pathophysiological changes

Andrew I Mikhail et al. J Clin Invest. .

Abstract

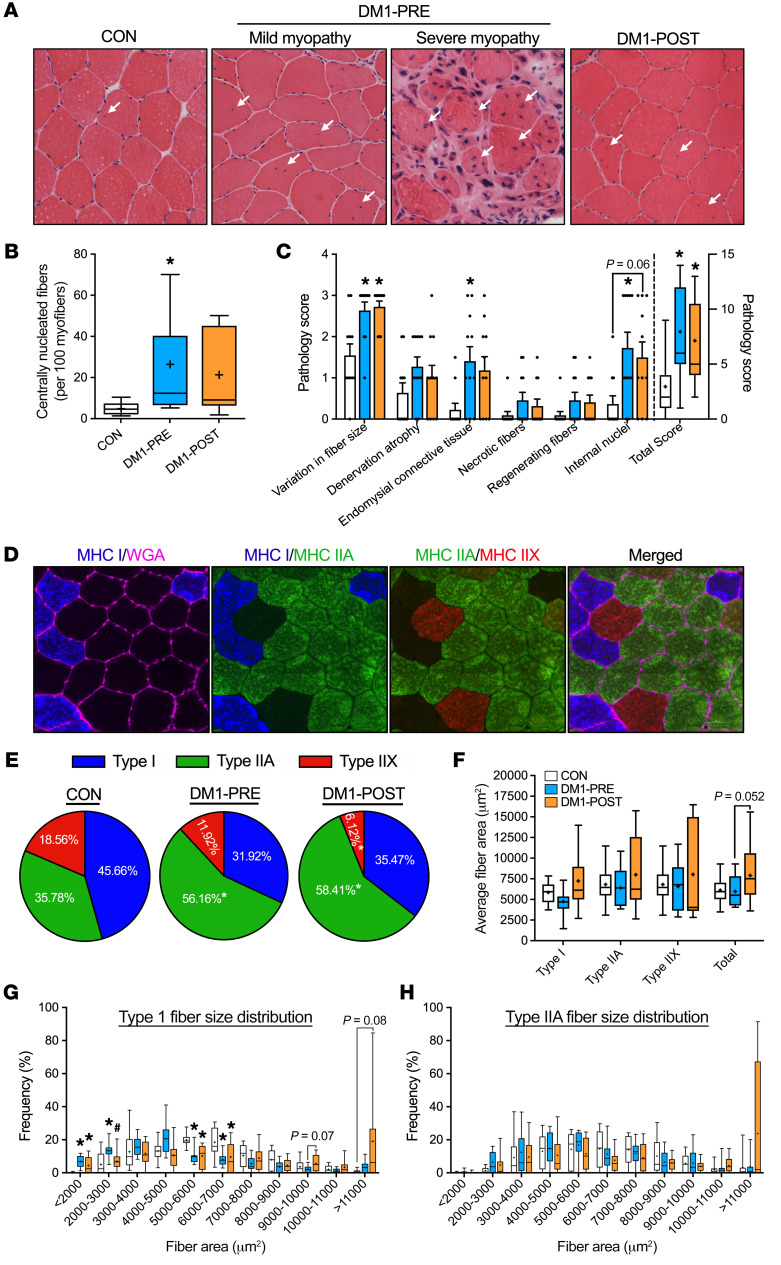
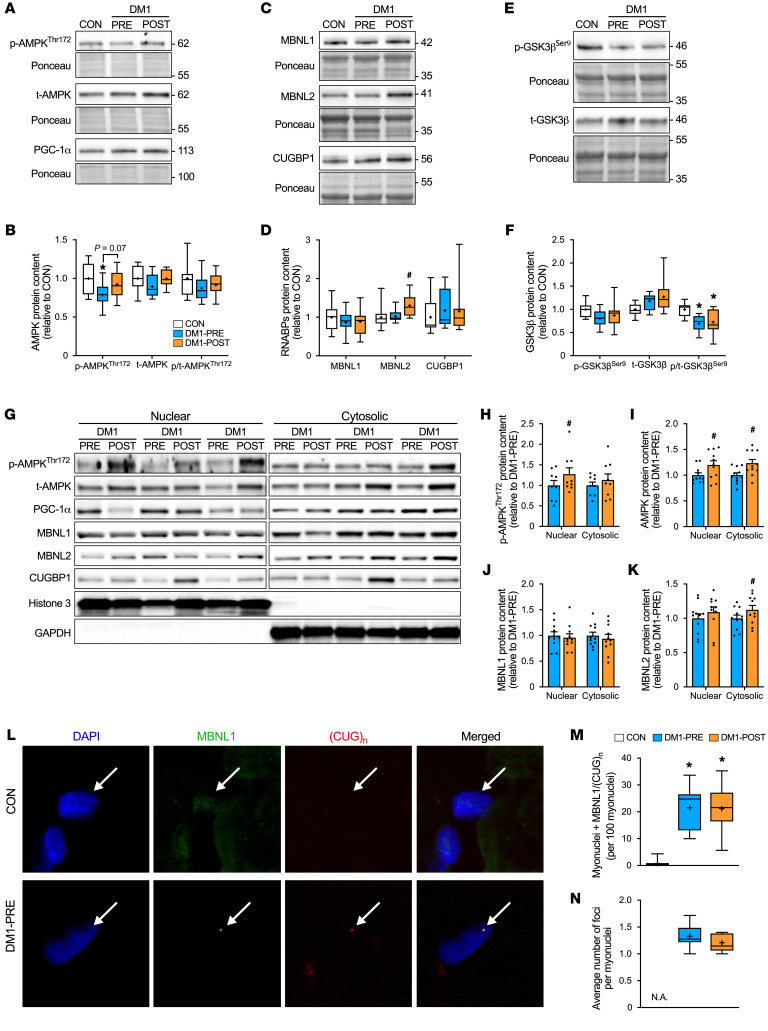
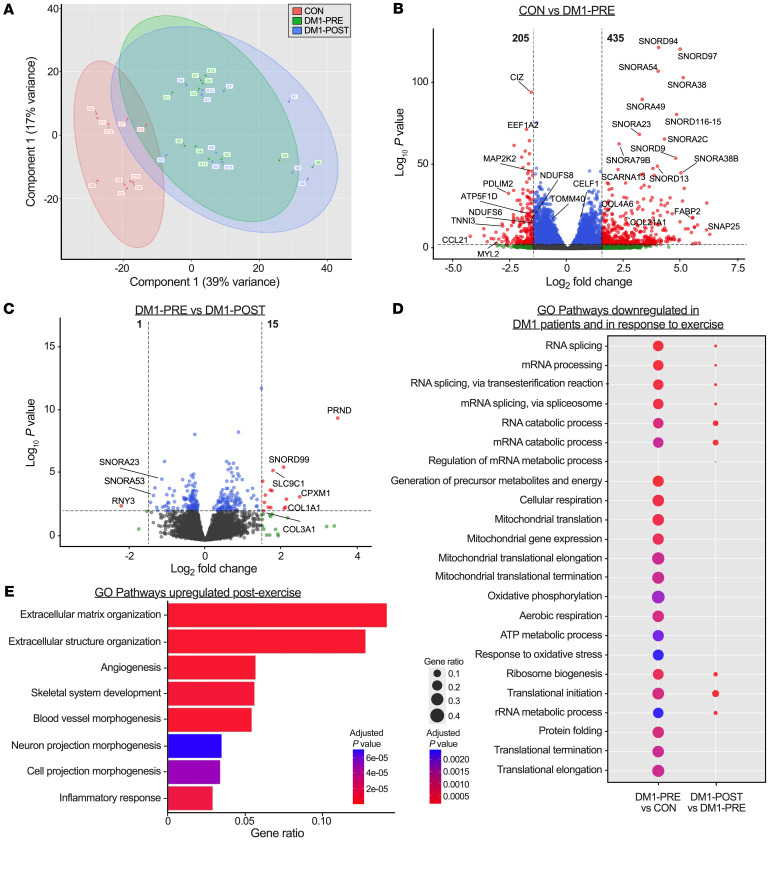
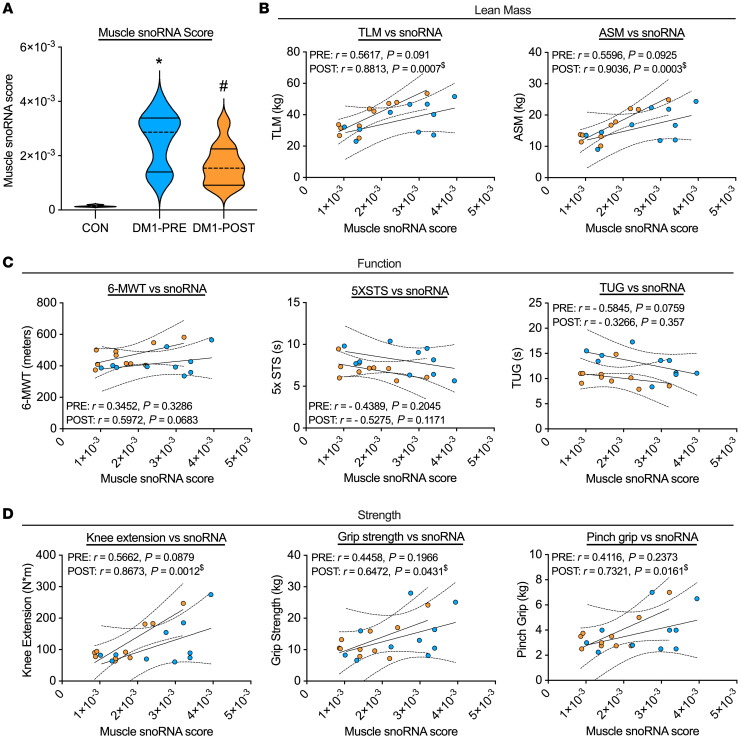
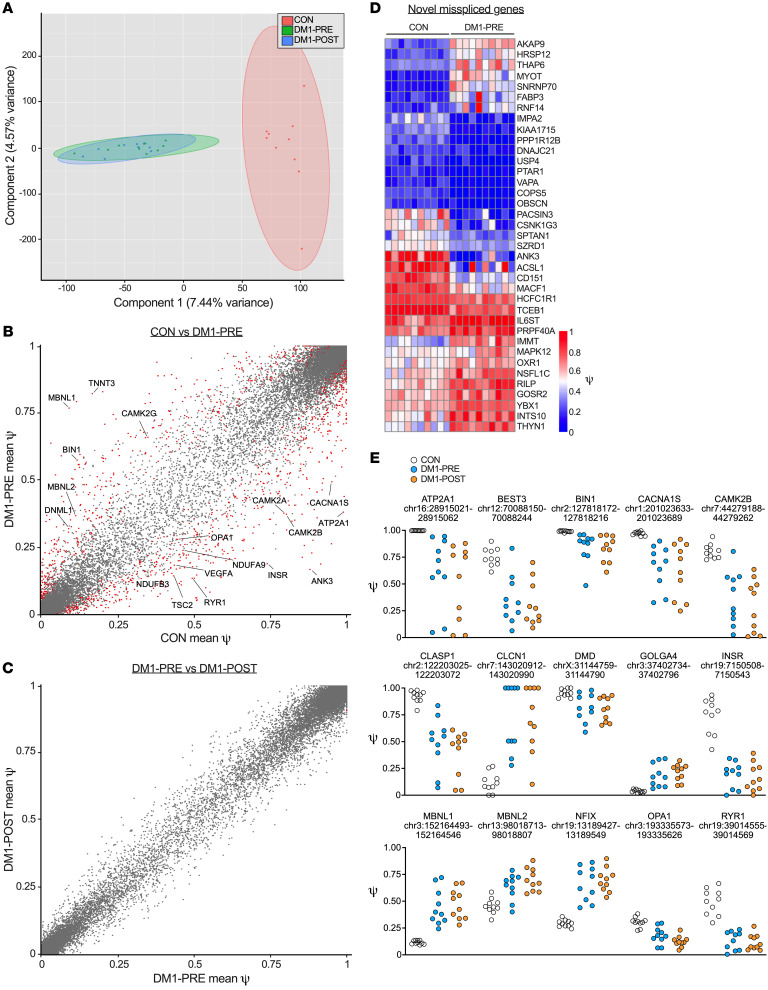
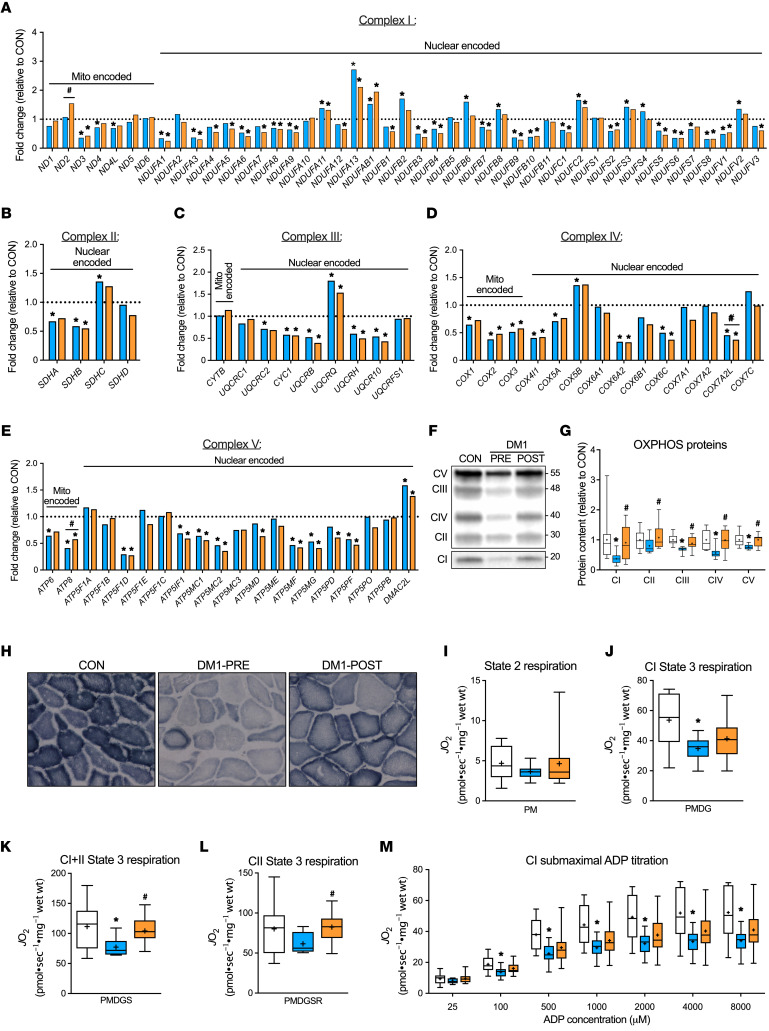
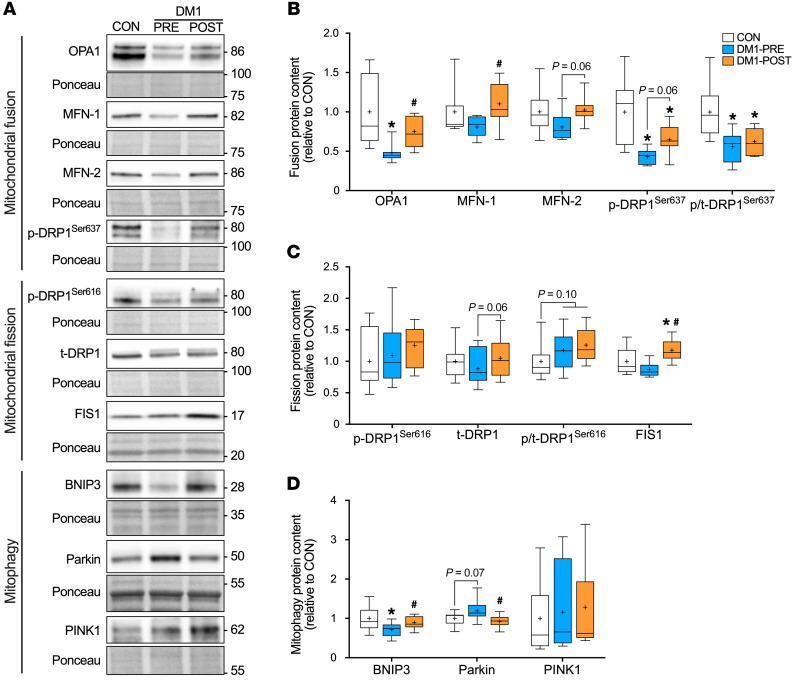
BackgroundMyotonic dystrophy type 1 (DM1) is a complex life-limiting neuromuscular disorder characterized by severe skeletal muscle atrophy, weakness, and cardiorespiratory defects. Exercised DM1 mice exhibit numerous physiological benefits that are underpinned by reduced CUG foci and improved alternative splicing. However, the efficacy of physical activity in patients is unknown.MethodsEleven genetically diagnosed DM1 patients were recruited to examine the extent to which 12 weeks of cycling can recuperate clinical and physiological metrics. Furthermore, we studied the underlying molecular mechanisms through which exercise elicits benefits in skeletal muscle of DM1 patients.RESULTSDM1 was associated with impaired muscle function, fitness, and lung capacity. Cycling evoked several clinical, physical, and metabolic advantages in DM1 patients. We highlight that exercise-induced molecular and cellular alterations in patients do not conform with previously published data in murine models and propose a significant role of mitochondrial function in DM1 pathology. Finally, we discovered a subset of small nucleolar RNAs (snoRNAs) that correlated to indicators of disease severity.ConclusionWith no available cures, our data support the efficacy of exercise as a primary intervention to partially mitigate the clinical progression of DM1. Additionally, we provide evidence for the involvement of snoRNAs and other noncoding RNAs in DM1 pathophysiology.Trial registrationThis trial was approved by the HiREB committee (no. 7901) and registered under ClinicalTrials.gov (NCT04187482).FundingNeil and Leanne Petroff. Canadian Institutes of Health Research Foundation (no. 143325).

Keywords: Cell Biology; Mitochondria; Muscle Biology; Neuromuscular disease; RNA processing.


Conflict of interest statement

Conflict of interest: MAT is the founder, CEO, and CSO of Exerkine Corp. PLN is the founder, owner, and CMO of Praxis Genomics.

Figures

Figure 1
Figure 1. Flowchart of study enrollment and design.
(A) CONSORT figure of the recruitment process. All DM1 patients at the Neuromuscular and Neurometabolic Clinic at McMaster University were considered for this trial. A total of 13 patients complied with the inclusion/exclusion criteria and were interested in participating. Eleven patients were included in the final analysis. (B) Brief schematic of the study design for DM1 patients and healthy CON. DM1 patients completed the full exercise trial (visits 1–6), while CON performed baseline testing only (visits 1–3) for reference values. Visits 1 and 4 consisted of anthropometric measures, body composition assessment, electrocardiography, and cardiorespiratory fitness assessment. Visits 2 and 5 included functional testing (6-MWT, 5XSTS, and TUG tests), spirometry testing, and strength testing (maximal isometric knee extension, grip strength, and pinch grip). Finally, participants reported fasting to the laboratory for visits 3 and 6 for a blood draw and a skeletal muscle biopsy from the vastus lateralis.
Figure 2
Figure 2. Exercise does not exacerbate myopathy and augments myofiber size in DM1 patients.
(A) Representative images of H&E staining of the vastus lateralis muscle from CON (left) and DM1 patients before exercise with mild myopathy (DM1-PRE, middle left), DM1-PRE with severe myopathy (middle right), and patients following exercise (DM1-POST, right). Arrows indicate CNF. (B) Graphical summary of the frequency of CNF. (C) Average scores of pathology examination for CON, DM1-PRE, and DM1-POST. (D) Representative images of IF staining for wheat germ agglutinin (WGA) (cyan) and MHC type I (blue), type IIA (green), and type IIX (red). Original magnification, ×20. (E) Pie charts of fiber-type distribution in each group. (F) Average fiber-type–specific and total CSA. (G and H) Size distribution of fiber CSA for type I and type IIA fibers, respectively. Data are expressed as box and whisker plots with plus signs representing the mean (B and FH) or bar graphs as mean ± SEM (C). n = 11. *P < 0.05 versus CON, 1-way ANOVA followed by Bonferroni’s correction; #P < 0.05 versus DM1-PRE, 2-tailed paired t test corrected for multiple comparisons.
Figure 3
Figure 3. Aerobic exercise modestly increased cytosolic content of MBNL2, but does not alter MBNL1 sequestration.
(A) Representative Western blot of p-AMPKThr172, t-AMPK, and PGC-1α in the vastus lateralis muscle. (B) Graphical summary of p-AMPKThr172, t-AMPK, and PGC-1α expression. (C) Representative Western blot of MBNL1, MBNL2, and CUGBP1. (D) Graphical summary of MBNL1, MBNL2, and CUGBP1 expression. (E) Representative Western blot of p-GSK3βSer9 and t-GSK3β. (F) Graphical summary of p-GSK3βSer9, t-GSK3β, and inhibition status (p-GSK3βSer9 relative to t-GSK3β) expression. A typical Ponceau stain displayed below demonstrates sample loading. (G) Representative Western blot of p-AMPKThr172, t-AMPK, MBNL1, MBNL2, and CUGBP1 in nuclear and cytosolic fractions from DM1-PRE and DM1-POST. Histone 3 and GAPDH proteins displayed below to indicate nuclear and cytosolic fraction purity. Approximate molecular weights (kDa) shown at right of blots in A, C, and E. (H–K) Graphical summary of p-AMPKThr172, t-AMPK, MBNL1, and MBNL2 in nuclear and cytosolic fractions. (L) Representative images of combined FISH probing for CUG repeats ([CUG]n) and IF staining of MBNL1 along with DAPI to mark myonuclei and merged image. Original magnification, ×60 with a ×10 digital imaging zoom, for final magnification of ×600. (M) Summary of the numbers of MBNL1/(CUG)n-positive myonuclei as an indicator of MBNL1 sequestration. (N) Average number of foci within MBNL1/(CUG)n-positive myonuclei. Data are expressed as box and whisker plots with plus signs representing the mean (BF, M, and N) or bar graphs as mean ± SEM (HK). n = 9–11. *P < 0.05 versus CON, 1-way ANOVA followed by Bonferroni’s correction; #P < 0.05 versus DM1-PRE, 2-tailed paired t test corrected for multiple comparisons.
Figure 4
Figure 4. Bulk RNA-Seq reveals a unique transcriptional profile between DM1 patients and healthy CON.
(A) PCA of bulk RNA-Seq for CON (red), DM1-PRE (green), and DM1-POST (blue). (B and C) Volcano plots of differential expression analysis between CON versus DM1-PRE (B) and DM1-PRE versus DM1-POST (C). Significantly different (|log2(FC)| > 1.5, P < 0.005) genes are indicated with red dots, and nonsignificant genes are indicated in blue (|log2(FC)| < 1.5, P < 0.005) and green (|log2(FC)| > 1.5, P > 0.005). (D) Bubble plot of downregulated pathways examined through GO pathway analysis. (E) GO pathway analysis of biological processes upregulated in DM1 patients in response to exercise training. n = 10–11.
Figure 5
Figure 5. snoRNAs are upregulated in DM1 patients and are correlated with clinical outcomes.
(A) Violin plot of computed muscle snoRNAs score in CON, DM1-PRE, and DM1-POST. Correlation graphs and values of the muscle snoRNA score against metrics of (B) lean mass (TLM and appendicular skeletal muscle [ASM]), (C) function (6-MWT, 5XSTS, and TUG tests), and (D) strength (maximal knee extension, grip strength, and pinch grip). n = 10. *P < 0.05 versus CON, 1-way ANOVA followed by Bonferroni’s correction; #P < 0.05 versus DM1-PRE, 2-tailed paired t test corrected for multiple comparisons; $P < 0.05, linear regression analysis.
Figure 6
Figure 6. Twelve weeks of cycle ergometry does not influence missplicing in skeletal muscle of DM1 patients.
(A) PCA of whole-genome exon splicing data examining differences in genome-wide alternative splicing events for CON (red), DM1-PRE (green), and DM1-POST (blue). (B and C) Scatterplots of mean PSI (or ψ) for (B) healthy CON versus DM1 samples before exercise and (C) DM1 patients before (DM1-PRE) and after (DM1-POST) exercise for all exons measured; 1581 missplicing events were detected as significantly different (|ψ| > 5%, FDR < 5%, P < 0.0002). Red dots represent significantly different alternatively spliced events, and gray dots represent nonstatistically different event. (D) Heatmap showing ψ values of novel alternatively spliced events in skeletal muscle of DM1 patients relative to healthy CON. (E) Scatterplots of individual ψ values for canonical missplicing events in DM1 biology. n = 10.
Figure 7
Figure 7. Exercise training ameliorates mitochondrial deficiency in DM1 patients.
Gene expression of all subunits of complex I (A), complex II (B), complex III (C), complex IV (D), and complex V (E) of the mitochondrial electron transport chain expressed as fold change relative to CON and grouped into mitochondrial (left) and nuclear encoded genes (right). (F) Representative Western blot of mitochondrial protein complexes (CI–CV). Full blot was overexpressed and cropped for better visualization of CI. A typical Ponceau stain displayed below demonstrates sample loading. Approximate molecular weights (kDa) shown at right of blots. (G) Graphical representation of CI–CV protein expression. (H) Representative images of succinate dehydrogenase staining. Original magnification, ×20. (I) State 2 complex I (CI) respiration in the presence of pyruvate plus malate (PM). (J) State 3 CI maximal respiration in the presence of PM plus ADP plus glutamate (PMDG). (K) State 3 complex I+II (CI+II) maximal respiration in the presence of PMDG plus succinate (PMDGS). (L) State 3 complex II (CII) maximal respiration in the presence of PMDGS plus rotenone (PMDGSR). (M) Submaximal ADP titration (25, 100, 500, 1000, 2000, 4000, and 8000 μM) curve with PM. Two samples from CON were of poor quality and therefore excluded from the respiration analysis. All respiration experiments were performed in duplicate and averaged for each participant. Data are expressed with bar graphs as mean (AE) or as box and whisker plots with plus signs representing the mean (G and I–M). n = 9–11. *P < 0.05 versus CON, 1-way ANOVA followed by Bonferroni’s correction; #P < 0.05 versus DM1-PRE, 2-tailed paired t test corrected for multiple comparisons.
Figure 8
Figure 8. Aerobic exercise augments proteins that regulate mitochondrial plasticity in skeletal muscle of DM1 patients.
(A) Representative Western blot of mitochondrial fusion-related proteins (OPA1, MFN-1, MFN-2, and p-DRP1Ser637), fission-related proteins (p-DRP1Ser616, FIS1, and t-DRP1), and mitophagy proteins (BNIP3, Parkin, and PTEN-induced kinase [PINK1]). A typical Ponceau stain displayed below demonstrates sample loading. Approximate molecular weights (kDa) shown at right of blots. (B) Graphical summary of OPA1, MFN-1, MFN-2, p-DRP1Ser637, and inhibition status for DRP1 (p-DRP1Ser637 relative to t-DRP1) expression. (C) Graphical summary of p-DRP1Ser616, t-DRP1, and FIS1 expression. (D) Graphical summary of BNIP3, Parkin, and PINK1 expression. All data are expressed as box and whisker plots with plus signs representing the mean. n = 11. *P < 0.05 versus CON, 1-way ANOVA followed by Bonferroni’s correction; #P < 0.05 versus DM1-PRE, 2-tailed paired t test corrected for multiple comparison.

Comment in

Similar articles

Cited by

References

    1. Chau A, Kalsotra A. Developmental insights into the pathology of and therapeutic strategies for DM1: Back to the basics. Dev Dyn. 2015;244(3):377–390. doi: 10.1002/dvdy.24240. - DOI - PubMed
    1. Thornton CA. Myotonic dystrophy. Neurol Clin. 2014;32(3):705–719. doi: 10.1016/j.ncl.2014.04.011. - DOI - PMC - PubMed
    1. Harley HG, et al. Expansion of an unstable DNA region and phenotypic variation in myotonic dystrophy. Nature. 1992;355(6360):545–546. doi: 10.1038/355545a0. - DOI - PubMed
    1. Johnson NE, et al. Population-Based Prevalence of Myotonic Dystrophy Type 1 Using Genetic Analysis of Statewide Blood Screening Program. Neurology. 2021;96(7):e1045–e1053. - PMC - PubMed
    1. Taneja KL, et al. Foci of trinucleotide repeat transcripts in nuclei of myotonic dystrophy cells and tissues. J Cell Biol. 1995;128(6):995–1002. doi: 10.1083/jcb.128.6.995. - DOI - PMC - PubMed

Publication types

Associated data

Grants and funding