. 2022 May 16;132(10):e147822.
doi: 10.1172/JCI147822.

Iron deficiency linked to altered bile acid metabolism promotes Helicobacter pylori-induced inflammation-driven gastric carcinogenesis

Affiliations

Iron deficiency linked to altered bile acid metabolism promotes Helicobacter pylori-induced inflammation-driven gastric carcinogenesis

Jennifer M Noto et al. J Clin Invest. .

Abstract

Gastric carcinogenesis is mediated by complex interactions among Helicobacter pylori, host, and environmental factors. Here, we demonstrate that H. pylori augmented gastric injury in INS-GAS mice under iron-deficient conditions. Mechanistically, these phenotypes were not driven by alterations in the gastric microbiota; however, discovery-based and targeted metabolomics revealed that bile acids were significantly altered in H. pylori-infected mice with iron deficiency, with significant upregulation of deoxycholic acid (DCA), a carcinogenic bile acid. The severity of gastric injury was further augmented when H. pylori-infected mice were treated with DCA, and, in vitro, DCA increased translocation of the H. pylori oncoprotein CagA into host cells. Conversely, bile acid sequestration attenuated H. pylori-induced injury under conditions of iron deficiency. To translate these findings to human populations, we evaluated the association between bile acid sequestrant use and gastric cancer risk in a large human cohort. Among 416,885 individuals, a significant dose-dependent reduction in risk was associated with cumulative bile acid sequestrant use. Further, expression of the bile acid receptor transmembrane G protein-coupled bile acid receptor 5 (TGR5) paralleled the severity of carcinogenic lesions in humans. These data demonstrate that increased H. pylori-induced injury within the context of iron deficiency is tightly linked to altered bile acid metabolism, which may promote gastric carcinogenesis.

Keywords: Bacterial infections; Gastric cancer; Gastroenterology; Infectious disease; Mouse models.


Conflict of interest statement

Conflict of interest: The authors have declared that no conflict of interest exists.

Figures

Figure 1
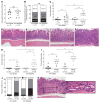
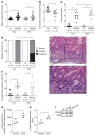
Figure 1. Iron deficiency augments H. pylori–induced chronic gastric inflammation in C57BL/6 mice.
Wild-type male and female C57BL/6 mice were maintained on an iron-replete (n = 59) or iron-depleted (n = 57) diet and then challenged with Brucella broth (UI) or the H. pylori strain PMSS1. Mice were euthanized 8 weeks after challenge. (A) Gastric tissue was homogenized and plated for quantitative culturing. Colonization density is expressed as log CFU/g of tissue. (B) Gastric tissue was fixed, paraffin embedded, and stained with a modified Steiner stain. The percentage of H. pylori colonizing the antrum, transition zone, and corpus was assessed, and the average topographical H. pylori colonization density/mouse is shown. (CI) Gastric tissue was fixed, paraffin embedded, and stained with H&E. The levels of total gastric inflammation (scored as 0–12) were assessed (C). (DG) Representative histologic images from antrum of uninfected mice maintained on an iron-replete (D) or iron-depleted (E) diet and from H. pylori–infected mice maintained on an iron-replete (F) or iron-depleted (G) diet are shown (original magnification, ×200; scale bars: 100 μm). Tissue sections were scored separately for acute (score of 0–6) (H) and chronic gastric inflammation (score of 0–6) (I). Levels of MPO (J) and CD45 (K) were assessed by IHC to enumerate neutrophils and macrophages (MPO) and leukocytes (CD45), respectively. Representative images are shown (original magnification, ×400). Each point represents data from an individual animal from 3 independent experiments. Mean values are shown in the scatter dot plots. An unpaired parametric t test (A, B, J, and K) and 1-way ordinary ANOVA with Šidák’s multiple-comparison test (C, H, and I) were used to determine statistical significance. *P < 0.05, **P < 0.01, ***P < 0.001, and ****P < 0.0001.
Figure 2
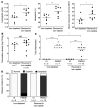
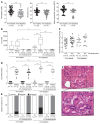
Figure 2. Iron deficiency augments H. pylori–induced gastric inflammation and injury in INS-GAS mice.
Male INS-GAS mice were maintained on an iron-replete (n = 22) or iron-depleted (n = 33) diet and then challenged with Brucella broth (UI) or the H. pylori strain PMSS1. Mice were euthanized 8 weeks after challenge. (A) Gastric tissue was homogenized and plated for quantitative culturing. Colonization density is expressed as log CFU/g of tissue. (B) Gastric tissue was fixed, paraffin embedded, and stained with a modified Steiner stain. The percentage of H. pylori colonizing the antrum, transition zone, and corpus was assessed, and the average topographical H. pylori colonization density/mouse is shown. (CK) Gastric tissue was fixed, paraffin embedded, and stained with H&E. (C) Levels of total gastric inflammation (score of 0–12). (DG) Representative histologic images from the antrum of uninfected mice maintained on an iron-replete (D) or iron-depleted (E) diet and of H. pylori–infected mice maintained on an iron-replete (F) or iron-depleted (G) diet (original magnification, ×200; scale bars: 100 μm). Gastric tissue was scored separately for acute (H) and chronic (I) inflammation and disease incidence (J). Dysplasia was graded as indefinite dysplasia (borderline nuclear and architectural epithelial changes that do not completely fit the patterns of dysplasia), low-grade or high-grade dysplasia. (K) Representative histologic images of indefinite dysplasia. Original magnification, ×200 and ×400 (enlarged inset). Scale bar: 100 μm. Each point represents data from an individual animal from 3 independent experiments. Mean values are shown in the scatter dot plots. An unpaired parametric t test (A and B), 1-way ordinary ANOVA with Šidák’s multiple-comparison test (C, H, and I), and Fisher’s exact test (J) were used to determine statistical significance. *P < 0.05, ***P < 0.001, and ****P < 0.0001.
Figure 3
Figure 3. H. pylori–induced inflammation and injury under conditions of iron deficiency is reversible.
Two groups of male transgenic hypergastrinemic INS-GAS mice were maintained on a iron-depleted diet and then challenged with Brucella broth (UI) or the H. pylori strain PMSS1. Two weeks after challenge, 1 group was continued on an iron-depleted diet (n = 12) and the other group was switched to an iron-replete diet (n = 15). The mice were euthanized 8 weeks after challenge. (A) Blood was harvested from a subset of mice for CBC analysis. Hemoglobin, hematocrit, and mean corpuscular volume were assessed as parameters of iron deficiency. (B) Gastric tissue was homogenized and plated for quantitative culturing. Colonization density is expressed as log CFU/g of tissue. (C) Gastric tissue was fixed, paraffin embedded, and stained with H&E. Total gastric inflammation levels (score of 0–12) were assessed. (D) Gastric tissue was also scored for disease incidence. Disease incidence included normal histopathology, gastritis, and gastric dysplasia. Dysplasia was graded as indefinite dysplasia, low-grade dysplasia, or high-grade dysplasia. Each point represents data from an individual animal from 2 independent experiments. Mean values are shown in the scatter dot plots. An unpaired parametric t test (A and B), 1-way ordinary ANOVA with Šidák’s multiple-comparison test (C), and Fisher’s exact test (D) were used to determine statistical significance. *P < 0.05, **P < 0.01, and ****P < 0.0001.
Figure 4
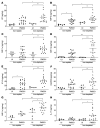
Figure 4. H. pylori induces proinflammatory responses in C57BL/6 and INS-GAS mice within the context of iron deficiency.
Male and female C57BL/6 and male INS-GAS mice were maintained on an iron-replete or iron-depleted diet and then challenged with Brucella broth (UI) or the H. pylori strain PMSS1. Mice were euthanized 8 weeks after challenge. Gastric tissue was analyzed using a cytokine/chemokine multiplex bead array. Data were acquired and analyzed using the Millipore software platform and expressed as picograms of chemokine per milligram of gastric tissue. Levels of KC (A), MIP-2 (B), MIP-1α (C), MIP-1β (D), IP-10 (E), and RANTES (F) were significantly increased by H. pylori infection in C57BL/6 mice under conditions of iron deficiency compared with infected mice maintained on an iron-replete diet. Levels of MIP-1α (G) and IL-17 (H) were significantly increased in H. pylori–infected INS-GAS mice under conditions of iron deficiency compared with infected mice maintained on an iron-replete diet. Each point represents data from an individual animal from 3 independent experiments. C57BL/6 mice: iron-replete UI (n = 5) and PMSS1 (n = 17); iron-depleted UI (n = 5) and PMSS1 (n = 17). INS-GAS mice: iron-replete UI (n = 4) and PMSS1 (n = 9); iron-depleted UI (n = 7) and PMSS1 (n = 17). Mean values are shown in the scatter dot plots. A 1-way ordinary ANOVA with Šidák’s multiple-comparison test was used to determine statistical significance. Only statistically significant comparisons are denoted. *P < 0.05, **P < 0.01, and ***P < 0.001.
Figure 5
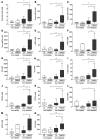
Figure 5. H. pylori significantly alters bile acid levels under conditions of iron deficiency in INS-GAS mice.
Male INS-GAS mice were maintained on an iron-replete or iron-depleted diet and then challenged with Brucella broth or the wild-type H. pylori strain PMSS1. Mice were euthanized 8 weeks after challenge. Gastric tissue was processed for targeted bile acid analyses. Total bile acids (A), muricholic acids (BF), cholic acids (G and H), and DCAs (IN) were significantly increased by H. pylori under conditions of iron deficiency compared with infected mice under iron-replete conditions. n = 10 mice analyzed per group from 2 independent experiments. Median values are shown in box-and-whisker plots, with whiskers designating minimum and maximum values. A 1-way ordinary ANOVA with Šidák’s multiple-comparison test was used to determine statistical significance. Only statistically significant comparisons are denoted. *P < 0.05, **P < 0.01, and ***P < 0.001.
Figure 6
Figure 6. DCA treatment significantly augments H. pylori–induced gastric inflammation and injury.
Male INS-GAS mice were maintained on an iron-replete standard diet and then challenged with Brucella broth (n = 28) or the H. pylori strain PMSS1 (n = 25). Two weeks after infection, mice received water alone or water supplemented with 100 μM DCA throughout the course of the experiment. Mice were euthanized 6 weeks after challenge. (A) Average water consumption was measured. (B) Gastric tissue was harvested for quantitative culturing. Colonization density is expressed as log CFU/gram of tissue. Gastric tissue was assessed for indices of gastric inflammation (C) and disease incidence (D). Disease incidence includes normal histopathology, gastritis, and gastric dysplasia. Dysplasia was graded as indefinite dysplasia, low-grade dysplasia, or high-grade dysplasia. (E) Representative histologic image of low-grade dysplasia. Original magnification, ×200 and ×400 (enlarged inset). Scale bars: 100 μm. (F) The average number of Foxp3-positive cells was assessed by IHC from 5 high-powered fields (×400). Each point represents data from an individual animal from 3 independent experiments. (GI) Gastric epithelial cells were cocultured with the H. pylori strain PMSS1 and then treated with either vehicle control or 50 μM DCA for 6 hours, and protein lysates were harvested for Western blot analysis. Levels of phosphorylated CagA (G) and the ratio of phosphorylated CagA (pCagA) to total CagA (H). Representative Western blots (I). Mean values are shown in the scatter dot plots. An unpaired parametric t test (B, G, and H), 1-way ordinary ANOVA with Šidák’s multiple-comparison test (A, C, and F), and Fisher’s exact test (D) were used to determine statistical significance. Only statistically significant comparisons are denoted. *P < 0.05, **P < 0.01, ***P < 0.001, and ****P < 0.0001.
Figure 7
Figure 7. Cholestyramine treatment significantly reduces H. pylori–induced inflammation and injury under conditions of iron deficiency in INS-GAS mice.
Male INS-GAS mice were maintained on an iron-replete (n = 66) or iron-depleted (n = 65) diet supplemented with or without 2% cholestyramine (w/w) and then challenged with Brucella broth or the H. pylori strain PMSS1. Mice were euthanized 8 weeks after challenge. Whole blood was collected for CBC analysis from a subset of H. pylori–infected mice maintained on an iron-replete or iron-depleted diet with or without cholestyramine supplementation. (A) Hemoglobin, hematocrit, and mean corpuscular volume were assessed as parameters of iron deficiency. (B) Gastric tissue was processed for targeted bile acid analyses to assess DCA levels. (C) Gastric tissue was harvested for quantitative culturing. Colonization density is expressed as log CFU/g of tissue. (DF) Gastric tissue was assessed for indices of inflammation (D) and disease incidence (E). Disease incidence includes normal histopathology, gastritis, and gastric dysplasia. Dysplasia was graded as indefinite dysplasia (borderline nuclear and architectural epithelial changes that do not completely fit the patterns of dysplasia), low-grade dysplasia, or high-grade dysplasia. (F) Representative histologic image of indefinite dysplasia is shown. Original magnification, ×200 and ×400 (enlarged inset). Scale bars: 100 μm. Each point represents data from an individual animal from 3 independent experiments. Mean values are shown in the scatter dot plots. Median values are shown in box-and-whisker plots, with whiskers designating minimum and maximum values. An unpaired parametric t test (A), 1-way ordinary ANOVA with Šidák’s multiple-comparison test (BD), and Fisher’s exact test (E) were used to determine statistical significance. Only statistically significant comparisons are denoted. *P < 0.05, **P < 0.01, ***P < 0.005, and ****P < 0.0001.
Figure 8
Figure 8. TGR5 expression parallels the severity of gastric disease.
(A) TGR5 protein expression was evaluated by IHC in human gastric tissues from a gastric cancer TMA. A single pathologist assessed the percentage of TGR5-positive cells and the intensity of TGR5 staining. The IHC score reflects the percentage of cells positive for TGR5, multiplied by the intensity of staining, as previously described (61). TGR5 staining was assessed in gastric tissue sections from patients with no pathology (normal, n = 11), nonatrophic gastritis (NAG, n = 7), multifocal atrophic gastritis (MAG, n = 11) without intestinal metaplasia, intestinal metaplasia (IM, n = 9), dysplasia (DYS, n = 3), or gastric cancer (GC, n = 40). (BE) Representative images of TGR5 protein expression in normal gastric tissue sections (B) and gastric tissue sections with multifocal atrophic gastritis (C), intestinal metaplasia (D), and gastric cancer (E). Original magnification, ×200. Scale bars: 100 μm. (F) RNA was extracted from normal gastric tissue (n = 12), gastric tissue with gastritis alone (n = 12), and gastric tissue with gastric adenocarcinoma (n = 12). TGR5 mRNA expression levels were standardized to GAPDH mRNA expression levels and are shown as fold relative to normal [2^–(ΔΔCt)]. Mean values are shown in the scatter dot plots. A 1-way ordinary ANOVA with Šidák’s multiple-comparison test was used to determine statistical significance. Only statistically significant comparisons are denoted. *P < 0.05, **P < 0.01, and ****P < 0.0001.

Comment in

Similar articles

Cited by

References

    1. Bray F, et al. Global cancer statistics 2018: GLOBOCAN estimates of incidence and mortality worldwide for 36 cancers in 185 countries. CA Cancer J Clin. 2018;68(6):394–424. doi: 10.3322/caac.21492. - DOI - PubMed
    1. Polk DB, et al. Helicobacter pylori: gastric cancer and beyond. Nat Rev Cancer. 2010;10(6):403–414. doi: 10.1038/nrc2857. - DOI - PMC - PubMed
    1. Stein M, et al. c-Src/Lyn kinases activate Helicobacter pylori CagA through tyrosine phosphorylation of the EPIYA motifs. Mol Microbiol. 2002;43(4):971–980. doi: 10.1046/j.1365-2958.2002.02781.x. - DOI - PubMed
    1. Tammer I, et al. Activation of Abl by Helicobacter pylori: a novel kinase for CagA and crucial mediator of host cell scattering. Gastroenterology. 2007;132(4):1309–1319. doi: 10.1053/j.gastro.2007.01.050. - DOI - PubMed
    1. Mueller D, et al. c-Src and c-Abl kinases control hierarchic phosphorylation and function of the CagA effector protein in Western and East Asian Helicobacter pylori strains. J Clin Invest. 2012;122(4):1553–1566. doi: 10.1172/JCI61143. - DOI - PMC - PubMed

Publication types