. 2022 May 2;132(9):e153436.
doi: 10.1172/JCI153436.

PHGDH is required for germinal center formation and is a therapeutic target in MYC-driven lymphoma

Affiliations

PHGDH is required for germinal center formation and is a therapeutic target in MYC-driven lymphoma

Annalisa D'Avola et al. J Clin Invest. .

Abstract

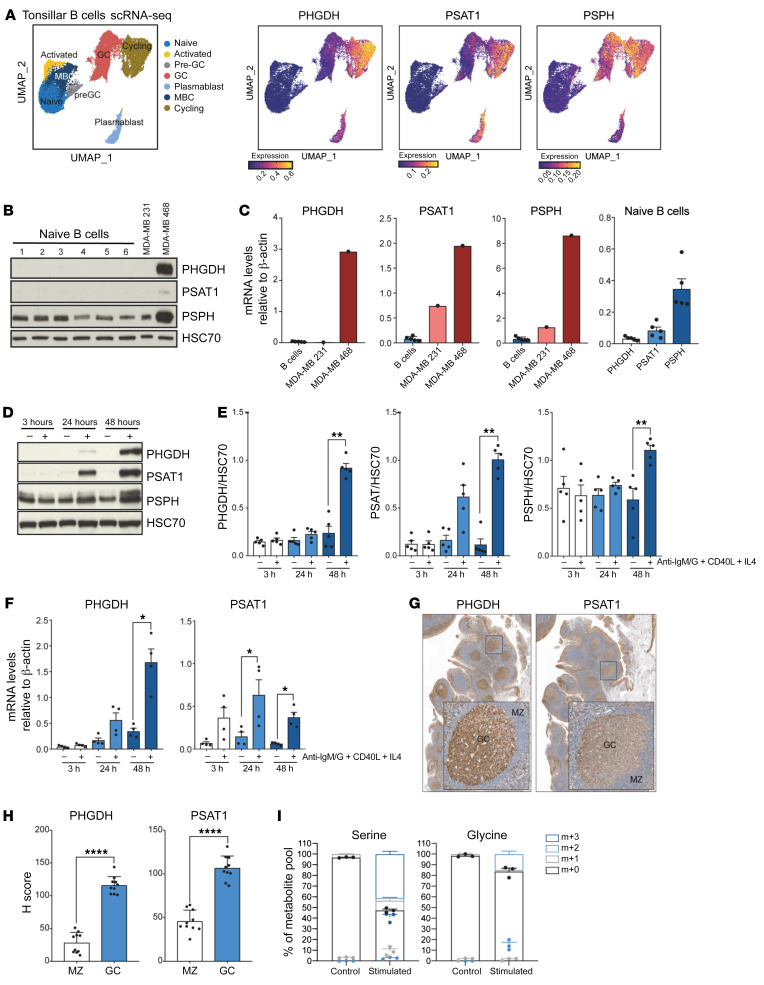
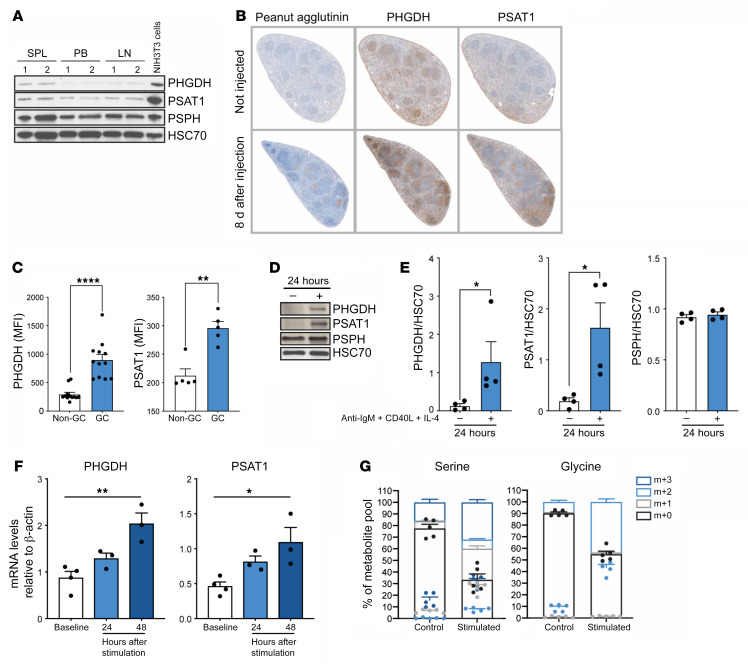
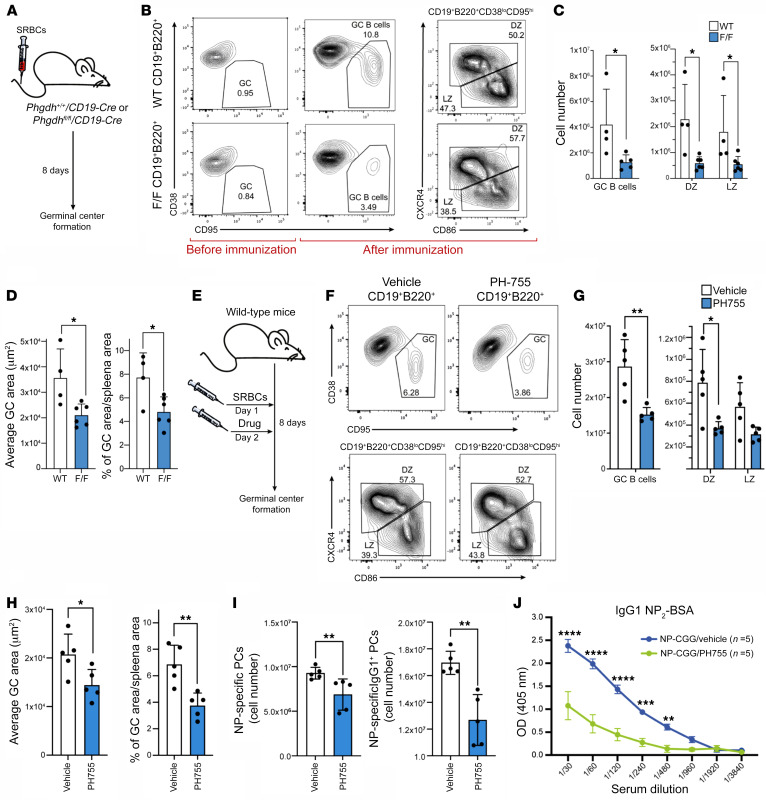
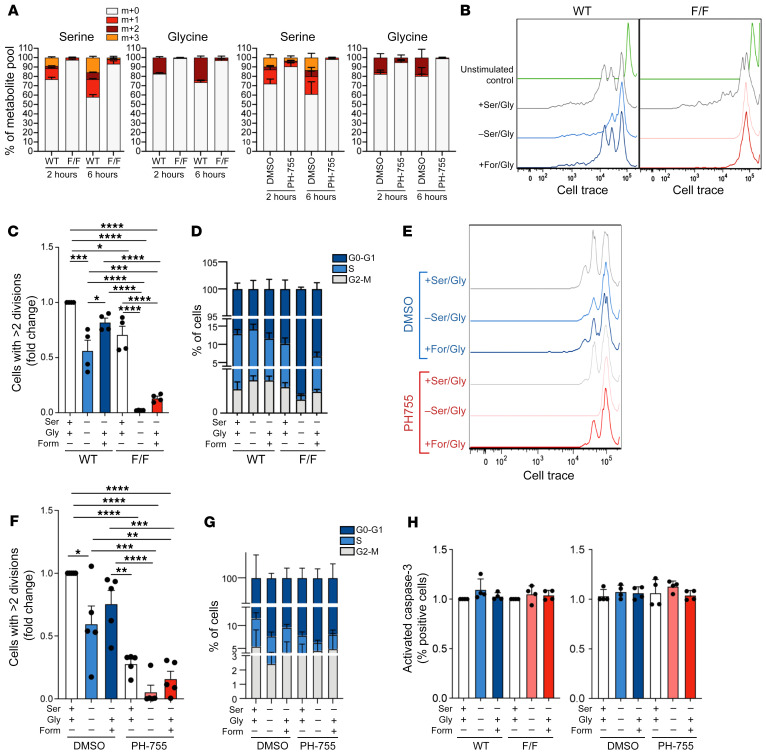
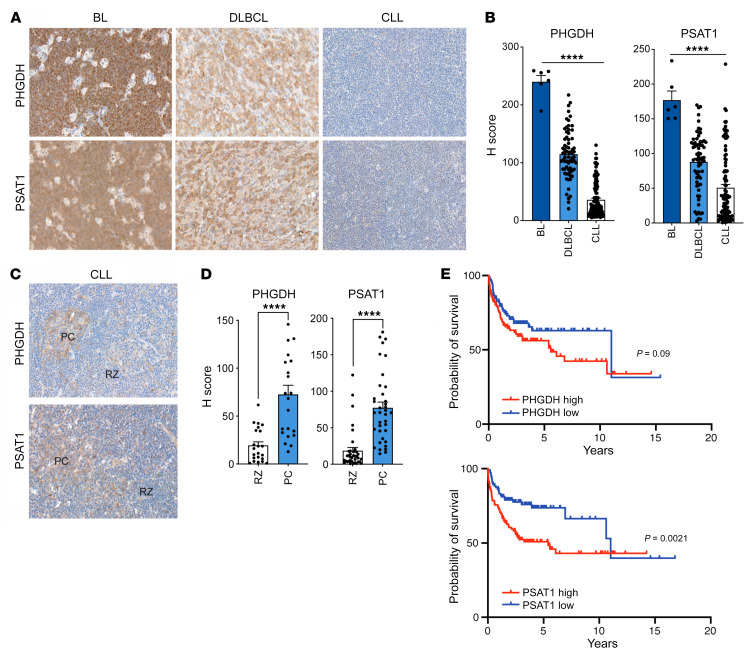
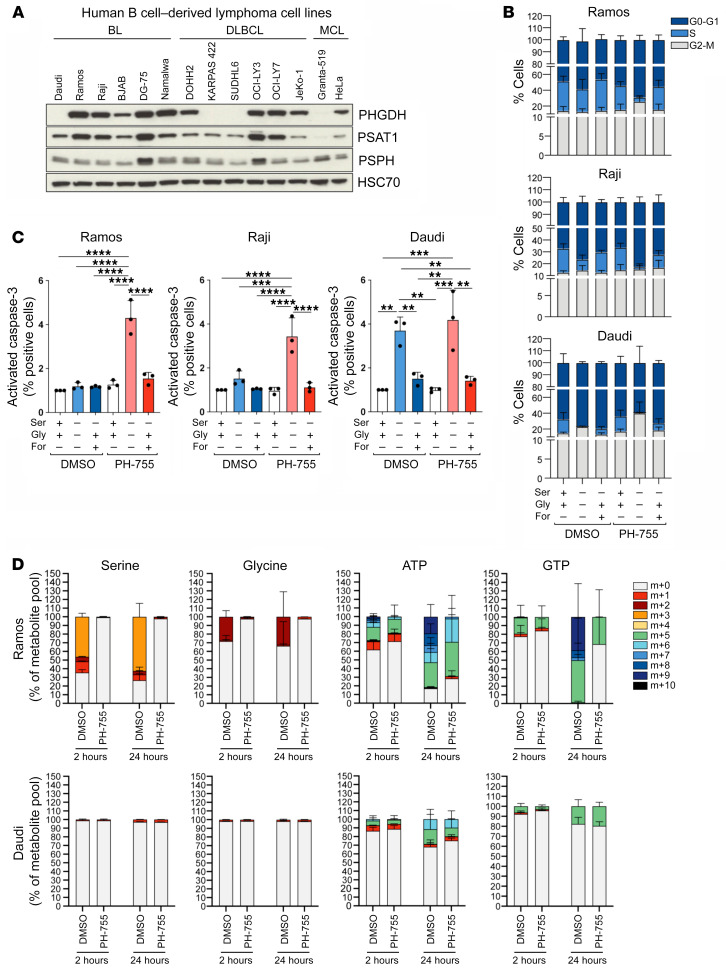
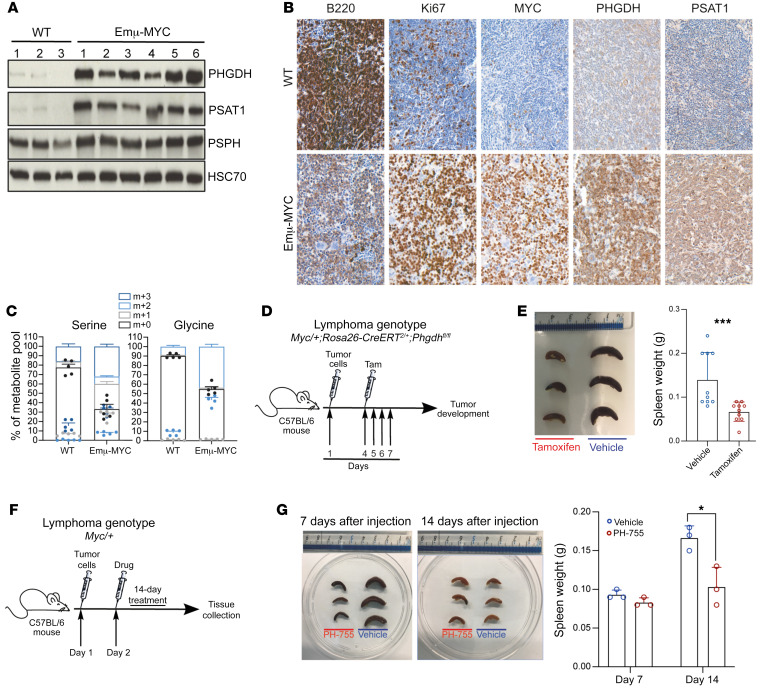
The synthesis of serine from glucose is a key metabolic pathway supporting cellular proliferation in healthy and malignant cells. Despite this, the role that this aspect of metabolism plays in germinal center biology and pathology is not known. Here, we performed a comprehensive characterization of the role of the serine synthesis pathway in germinal center B cells and lymphomas derived from these cells. We demonstrate that upregulation of a functional serine synthesis pathway is a metabolic hallmark of B cell activation and the germinal center reaction. Inhibition of phosphoglycerate dehydrogenase (PHGDH), the first and rate-limiting enzyme in this pathway, led to defective germinal formation and impaired high-affinity antibody production. In addition, overexpression of enzymes involved in serine synthesis was a characteristic of germinal center B cell-derived lymphomas, with high levels of expression being predictive of reduced overall survival in diffuse large B cell lymphoma. Inhibition of PHGDH induced apoptosis in lymphoma cells, reducing disease progression. These findings establish PHGDH as a critical player in humoral immunity and a clinically relevant target in lymphoma.

Keywords: Amino acid metabolism; Immunoglobulins; Immunology; Lymphomas; Metabolism.


Conflict of interest statement

Conflict of interest: KHV is on the board of directors, is a shareholder of Bristol Myers Squibb, is a shareholder of GRAIL Inc., and is on the science advisory board (with stock options) of PMV Pharma, RAZE Therapeutics, and Volastra Therapeutics Inc. She is also on the SAB of Ludwig Cancer. KHV is a cofounder and consultant of Faeth Therapeutics. She has been in receipt of research funding from Astex Pharmaceuticals and AstraZeneca, and she contributed to CRUK Cancer Research Technology filing of Patent Application WO/2017/144877. JGG has received research funding from Celgene, Janssen, and Acerta and honoraria from Abbvie, Acerta, Celgene, Gilead, Janssen, Novartis, Pharmacyclics, and Roche.

Figures

Figure 1
Figure 1. Upregulation of the SSP is a metabolic hallmark of GC B cells.
(A) Uniform Manifold Approximation and Projection (UMAP) of tonsillar B cell single-cell RNA clusters (including naive, activated, pre-GC, total GC, plasmablasts, memory [MBC], and cycling B cells) (left). Expression of SSP-network genes in B cell subsets (right). (B) Analysis of PHGDH, PSAT1 and PSPH protein levels in human naive B cells isolated from blood bank volunteers by immunoblotting (n = 6). MDA-MB-231 and MDA-MB-468 cell lines were used as control for low and high SSP-enzyme expression, respectively. (C) Quantification of specific transcript levels relative to β-actin mRNA levels. (D) Representative immunoblot of PHGDH, PSAT1, and PSPH in resting and activated human naive B cells. Human B cells were left unstimulated (–) or stimulated (+) with anti-IgM/G antibody, CD40 ligand (CD40L), and IL-4 for 3, 24, and 48 hours. (E) Quantification of protein levels shown in D normalized to HSC70. (F) Relative mRNA expression of SSP enzyme genes in resting and activated human B cells determined by qPCR. Isolated human B cells were left unstimulated (–) or stimulated with (+) with anti-IgM/G antibody, CD40L, and IL-4 for 3, 24, and 48 hours before mRNA extraction. Transcript levels were determined relative to β-actin mRNA levels (n = 4). (G and H) Representative IHC staining for PHGDH and PSAT1 in germinal center (GC) and mantle zone (MZ) areas in sequential sections of human reactive tonsils (×5 and ×20 magnification) and quantification (n = 10). (I) Mass isotopologue distribution of U-[13C]-glucose–derived serine and glycine from human resting and activated B cells. B cells were unstimulatedor stimulated with anti-IgM/G antibody, CD40L, and IL-4 for 48 hours. Cells were cultured for 2 hours in serine/glycine deplete media containing U-[13C]-glucose. Data are shown as the mean ± SEM. *P < 0.05, **P < 0.01, and ****P < 0.0001, by Mann-Whitney U test (E, F, and H).
Figure 2
Figure 2. Characterization of the SSP in WT mice after activation in vivo.
(A) Analysis of PHGDH, PSAT1, and PSPH protein levels in resting B cells isolated from mouse spleen (SPL), peripheral blood (PB), and lymph nodes (LN). NIH3T3 murine cells were used as control for high expression of SSP-related enzymes. (B) Representative IHC staining for PNA as GC marker, PHGDH, and PSAT1 on consecutive spleen sections derived from mouse spleens 8 days after sheep RBC immunization (×5 magnification). (C) Expression of PHGDH and PSAT1 in GC B cells and non-GC B cells harvested from mouse spleen 8 days after immunization with sheep RBC. (D) Representative immunoblots of PHGDH, PSAT1, and PSPH proteins levels in murine resting and activated B cells. (E) Mouse B cells were isolated from spleen and left unstimulated (–) or stimulated (+) with anti-IgM/G antibody, CD40L, and IL-4 for 24 hours before protein extraction and quantification of protein levels normalized to HSC70. Individual samples (dots) and means (bars) values are plotted (n = 4). (F) Relative mRNA expression of SSP enzyme genes in resting and activated mouse B cells as determined by qPCR. Isolated mouse B cells were left unstimulated or stimulated with anti-IgM/G antibody, CD40L, and IL-4 for 24 and 48 hours before mRNA extraction. Specific transcript levels were determined relative to β-actin mRNA levels (n = 4). (G) Mass isotopologue distribution of U-[13C6]-glucose–derived serine and glycine from murine resting and activated murine B cells. Cells were left unstimulated or stimulated with anti-IgM/G antibody, CD40L, and IL-4 for 48 hours. Cells were then cultured for 2 hours in serine/glycine-deplete media containing U-[13C]-glucose. 13C isotopologue distribution in serine and glycine was determined by LC-MS. Data are shown as the mean ± SEM. *P < 0.05, **P < 0.01, and ****P < 0.0001, by Mann-Whitney U test (C, E) or by 1-way ANOVA (F).
Figure 3
Figure 3. Genetic loss and pharmacological inhibition of PHGDH impairs GC responses.
(A) Mice were injected with sheep RBCs and spleens examined by IHC and flow cytometry 8 days after immunization. (B) Representative flow cytometric analysis of splenic B cells from Phgdh+/+;Cd19-Cre (WT) or Phgdhfl/fl;Cd19-Cre (F/F) before and after immunization to identify GC B cells (CD19+B220+CD38loCD95hi), as well as DZ (CD86loCXCR4hi) and LZ (CD86hiCXCR4lo) B cells, within GC splenic population. (C) Flow cytometric analysis of absolute numbers of B cell subsets within CD19+B220+CD38loCD95hi splenic population from Phgdhfl/fl;Cd19-Cre (n = 6) and Phgdh+/+;Cd19-Cre (n = 4) after immunization. (D) Average GC area (left) and proportion (%) of GC area per spleen area (right) from Phgdhfl/fl;Cd19-Cre (F/F) and Phgdh+/+;Cd19-Cre (WT) mice after immunization. (E) WT mice were immunized with sheep RBCs 1 day before PH-755 treatment (300 mg/kg PH-755 orally twice daily for 7 days). Spleens were analyzed 8 days after immunization. (F) Representative flow cytometric analysis of splenic B cells from mice immunized with sheep RBCs and treated with vehicle/PH-755 to identify GC, DZ, and LZ B cells within GC splenic population. (G) Flow cytometric analysis of absolute number of GC, DZ, and LZ B cells within B220+ splenocytes collected from mice 8 days after sheep RBCs immunization; mice were treated with vehicle (n = 5) or PH-755 (n = 5). (H) Average GCs area (left) and proportion (%) of GC area per spleen area (right) from vehicle- and PH-755–treated mice 8 days after sheep RBC immunization. (I) Summary of NP2-specific plasma cells (PCs; left) and NP2-specific IgG1 PCs (right; total number per popliteal lymph nodes). WT mice were treated with either vehicle (n = 5) or PH-755 (n = 5) for 7 days. Animals were injected with NP-CGG 1 day before PH-755 treatment. Popliteal lymph nodes were collected 8 days after NP-CGG immunization. (J) Serum antibody titers for NP2-specific IgG1 8 days after NP-CGG immunization. Data are shown as the mean ± SEM. *P < 0.05, **P < 0.01, ***P < 0.001, and ****P < 0.0001, by Mann-Whitney U test (C, G, I, and J) or unpaired t test (D and H).
Figure 4
Figure 4. PHGDH inhibition impairs B cell proliferation and de novo serine and glycine synthesis.
(A) Mass isotopologue distribution of U-[13C6]-glucose–derived serine and glycine in B220+ B cells isolated from Phgdh+/+;Cd19-Cre (WT) or Phgdhfl/fl;Cd19-Cre (F/F) or WT C57BL/6J mice. Isolated cells were stimulated with anti-IgM/G antibody, CD40L, and IL-4 for 48 hours and were then cultured for 2 hours in serine/glycine-deplete media with U-[13C]-glucose (and treated with/without PH-755 for WT B cells). (B and C) Representative proliferation profiles and quantification of B220+ B cells from either Phgdh+/+;Cd19-Cre (WT) or Phgdhfl/fl;Cd19-Cre (F/F) mice. Cells were labeled with the Cell Proliferation Dye eFluor 670 and then cultured for 3 days with anti-IgM/G antibody, CD40L, and IL-4 in complete media, serine/glycine-free medium, or serine/glycine-free medium containing glycine and formate (n = 4 per genotype). (D) Cell-cycle analysis of B220+ cells isolated from Phgdh+/+;Cd19-Cre (WT) or Phgdhfl/fl;Cd19-Cre (F/F) mice. Cells were cultured for 48 hours with anti-IgM/G antibody, CD40L, and IL-4 in complete media, serine/glycine-free medium, or serine/glycine-free medium containing glycine and formate; they then underwent BrdU labeling and 7-AAD staining to assess cell cycle. (E and F) Representative proliferation profiles and quantification of B220+ B cells from WT mice. Cells were labeled with the Cell Proliferation Dye eFluor 670 and were then cultured for 3 days with anti-IgM/G antibody, CD40L, and IL-4 in complete media, serine/glycine-free medium, or serine/glycine-free medium containing glycine and formate in combination with DMSO or 10 μM PH-755 (n = 5 per group). (G) Cell-cycle analysis of B220+ B from WT mice. Cells were cultured for 48 hours with anti-IgM/G, CD40L, and IL-4 in complete medium, serine/glycine-free medium, or serine/glycine-free medium containing glycine and formate in combination with DMSO or 10 μM PH-755 before cell-cycle analysis. (H) Activate Caspase-3 on B220+ B cells from either Phgdh+/+;Cd19-Cre (WT) or Phgdhfl/fl;Cd19-Cre (left panel; n = 4 per group) and treated as described in D, and on B cells isolated from WT mice (right panel; n = 3 per group) and treated as described in G. Data are shown as the mean ± SEM. *P < 0.05, **P < 0.01, ***P < 0.001 and ****P < 0.0001, by 1-way ANOVA (C and F).
Figure 5
Figure 5. Human GC lymphomas are characterized by activation of the SSP pathway.
(A and B) Representative immunohistochemical staining (×20 magnification) and quantification for PHGDH and PSAT1 abundance in sections of human diagnostic biopsies from patients with Burkitt lymphoma (BL), Diffuse Large B cell lymphoma (DLBCL), and Chronic lymphocytic leukemia (CLL). The statistical difference was analyzed using the ordinary 1-way ANOVA. (C and D) IHC analysis (×40 magnification) for PHGDH and PSAT1 in proliferation centers (PC) and resting zone (RZ) areas in sections from biopsies collected from patients with chronic lymphocytic leukemia (CLL), and quantification. Individual samples (dots) and means (bars) values are plotted. The statistical difference was analyzed using the Mann-Whitney U test. (E) Kaplan-Meier survival analysis of patients with DLBCL from a published data set (GSE10846) (44). Patients whose PHGDH/PSAT1 mRNA levels were within the top quartile were grouped as PHGDH/PSAT1 high; those with PHGDH/PSAT1 mRNA levels within the bottom quartile were grouped as PHGDH/PSAT1 low. Data are shown as the mean ± SEM. ****P < 0.0001, by 1-way ANOVA (B) or by Mann-Whitney U test (D). Survival analysis were conducted with log-rank (Mantel-Cox) test (E).
Figure 6
Figure 6. PHGDH inhibition impairs proliferation and promotes apoptosis in Burkitt lymphoma cells.
(A) Western blot analysis of PHGDH, PSAT1, and PSPH protein expression in B cell–derived lymphoma cell lines (mantle cell lymphoma [MCL]). Representative of 3 independent experiments. HSC70 was used as loading control. (B) Cell cycle profile of Ramos (top), Raji (center), and Daudi (bottom) cells. Cells were plated either in complete medium or equivalent medium lacking serine and glycine supplemented or not with 0.5 mM sodium formate and 0.4 mM glycine and treated with DMSO (as a solvent control) or 10 μM PH-755, followed by incubation with 10 μM BrdU and by staining with anti-BrdU and 7-ADD. Data are presented as mean ± SEM and are representative of 3 independent experiments, with value for DMSO-treated cells and cultured in complete medium set to 1.0. (C) Ramos (left), Raji (center), and Daudi (right) cells were cultured in the same conditions specified in B for 48 hours. Cells were then permeabilized, fixed, and stained for active Caspase-3. Positive cells for active Caspase-3 were analyzed by flow cytometry. Graph shows the mean derived from 3 independent experiments, with value for DMSO-treated cells and cultured in complete medium set to 1.0. Data are shown as the mean ± SEM. **P < 0.01, ***P < 0.001, and ****P < 0.0001, by 1-way ANOVA with Tukey’s post hoc test. (D) Mass isotopologue distribution of U-[13C6]-glucose–derived serine and glycine for Ramos (top) and Daudi (bottom) cells cultured for 2 and 24 hours in medium lacking serine and glycine in presence of U-[13C6]-glucose (10 mM) and treated with DMSO or 10 μM PH-755. Serine, glycine, ATP, and GTP levels were measured by LC-MS. The percentage distribution of each isotopologue for their respective metabolite pool is shown. Data are presented as mean ± SEM of 6 repeats and are representative of 3 independent experiments.
Figure 7
Figure 7. Genetic loss and pharmacological inhibition of PHGDH reduces lymphoma progression in vivo.
(A) Immunoblot of PHGDH, PSAT1, and PSPH expression in splenic B cells from WT (n = 3) and Eμ-Myc mice (n = 6). HSC70 was used as loading control. (B) Representative IHC staining (×20 magnification) for B220, Ki67, MYC, PHGDH, and PSAT1 abundance in sections of spleens from either WT (n = 3) or Eμ-Myc (n = 3) mice. (C) Isotope tracing analysis in splenic B cells isolated from either C57BL/6J WT mice or Eμ-MYC mice and cultured for 2 hours with 13C6-labeled glucose. Serine and glycine levels were measured by LC-MS. The percent distribution of each isotopologue of their respective metabolite pool is represented as mean ± SEM of triplicate cultures and is representative of 3 independent experiments. (D) Schematic showing lymphoma transplantation model, in which Myc/+;Rosa26-CreERT2/+;Phgdhfl/fl lymphoma cells are injected via the tail vein into 9-week-old male C57BL/6J mice. Three days after lymphoma engraftment, mice were randomized to receive either vehicle or tamoxifen treatment by oral gavage for 4 days. Samples were collected 20 days after injection. (E) Representative pictures of spleens from mice (n = 3 per group) sacrificed 20 days after transplantation (left), and quantification of the spleen weight (right). (F) Schematic showing lymphoma transplantation model, in which Myc/+ lymphoma cells are injected via the tail vein into 9-week-old male C57BL/6J mice. Two days after lymphoma engraftment, mice were randomized to be treated with either vehicle or PH-755 by oral gavage for 14 days. (G) Representative pictures of spleens from mice (n = 3 per group) sacrificed after 7 or 14 days after transplantation (left), and quantification of the spleen weight (right). Data are shown as the mean ± SEM. *P < 0.05 and ***P < 0.001, by 2-tailed Student’s t test (E and G).

References

    1. Rajewsky K. Clonal selection and learning in the antibody system. Nature. 1996;381(6585):751–758. doi: 10.1038/381751a0. - DOI - PubMed
    1. McHeyzer-Williams LJ, McHeyzer-Williams MG. Antigen-specific memory B cell development. Annu Rev Immunol. 2005;23:487–513. doi: 10.1146/annurev.immunol.23.021704.115732. - DOI - PubMed
    1. De Silva NS, Klein U. Dynamics of B cells in germinal centres. Nat Rev Immunol. 2015;15(3):137–148. doi: 10.1038/nri3804. - DOI - PMC - PubMed
    1. Victora GD, Nussenzweig MC. Germinal centers. Annu Rev Immunol. 2012;30:429–457. doi: 10.1146/annurev-immunol-020711-075032. - DOI - PubMed
    1. Batista FD, Harwood NE. The who, how and where of antigen presentation to B cells. Nat Rev Immunol. 2009;9(1):15–27. doi: 10.1038/nri2454. - DOI - PubMed

Publication types