. 2022 May 16;132(10):e156063.
doi: 10.1172/JCI156063.

Rapamycin limits CD4+ T cell proliferation in simian immunodeficiency virus-infected rhesus macaques on antiretroviral therapy

Affiliations

Rapamycin limits CD4+ T cell proliferation in simian immunodeficiency virus-infected rhesus macaques on antiretroviral therapy

Benjamin D Varco-Merth et al. J Clin Invest. .

Abstract

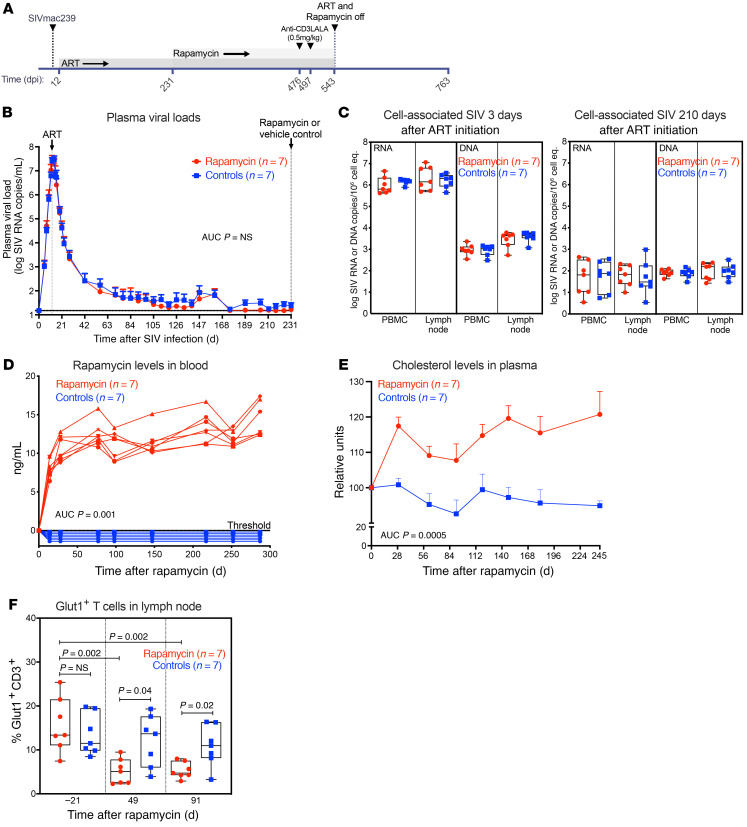
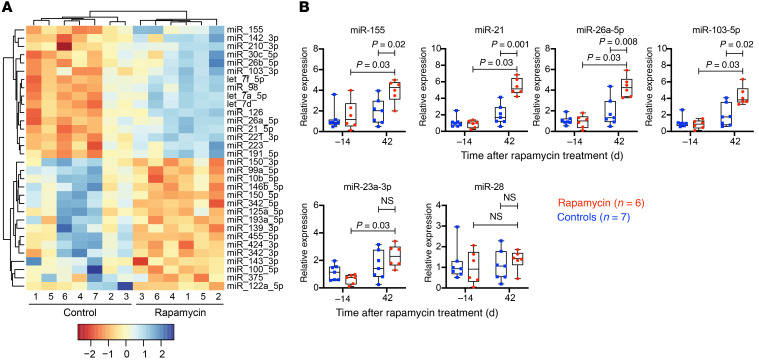
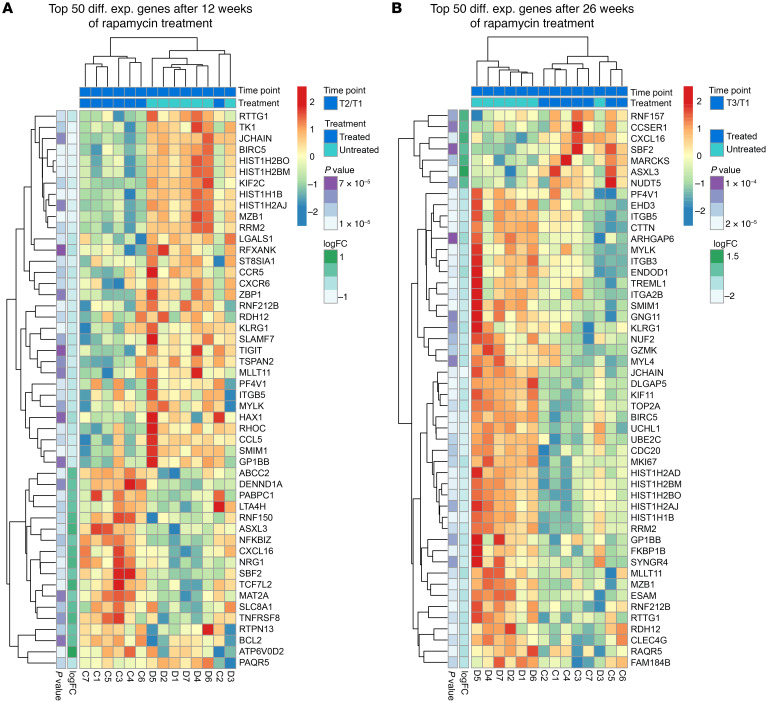
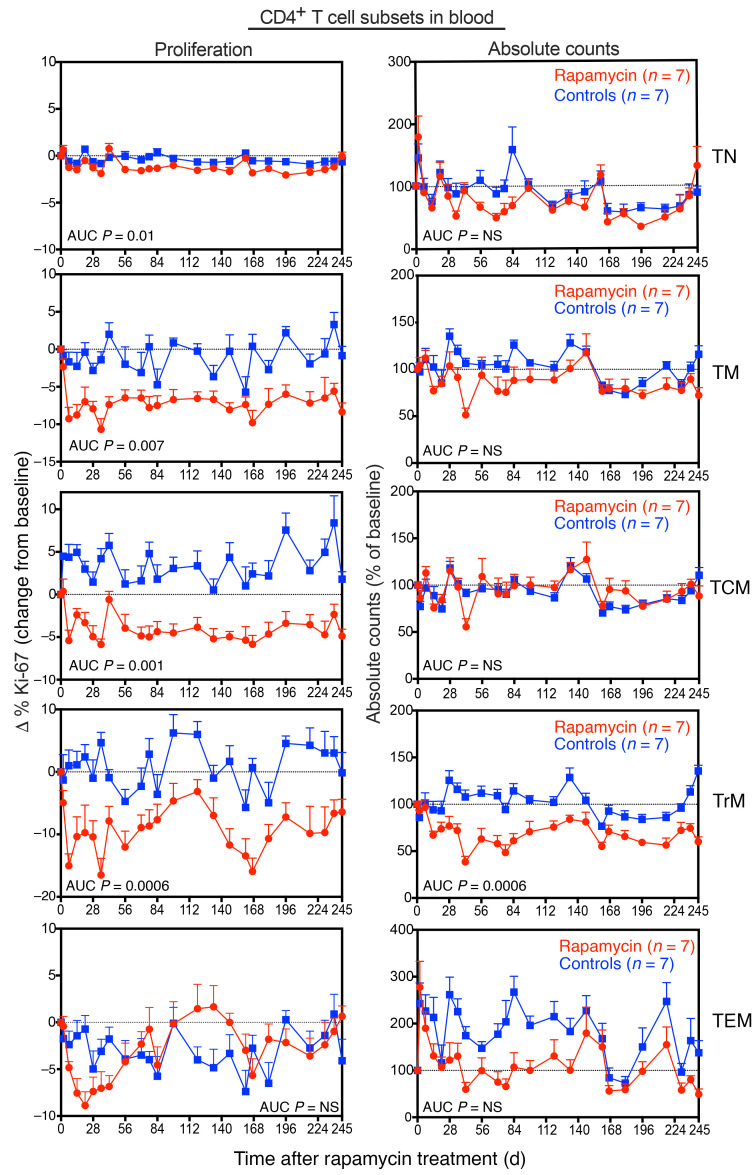
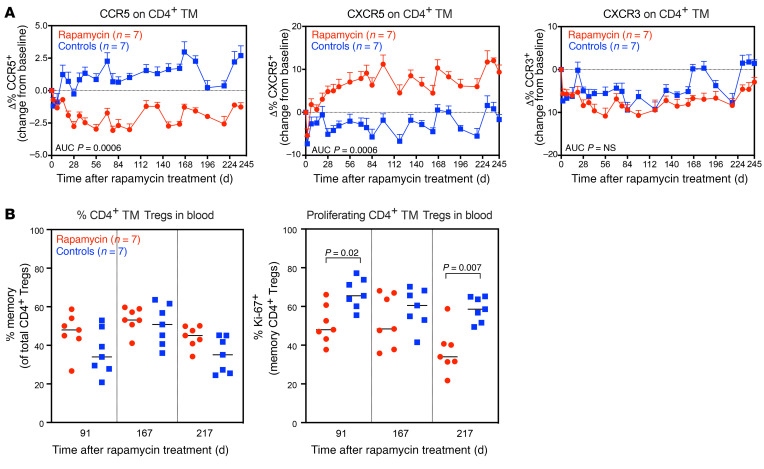
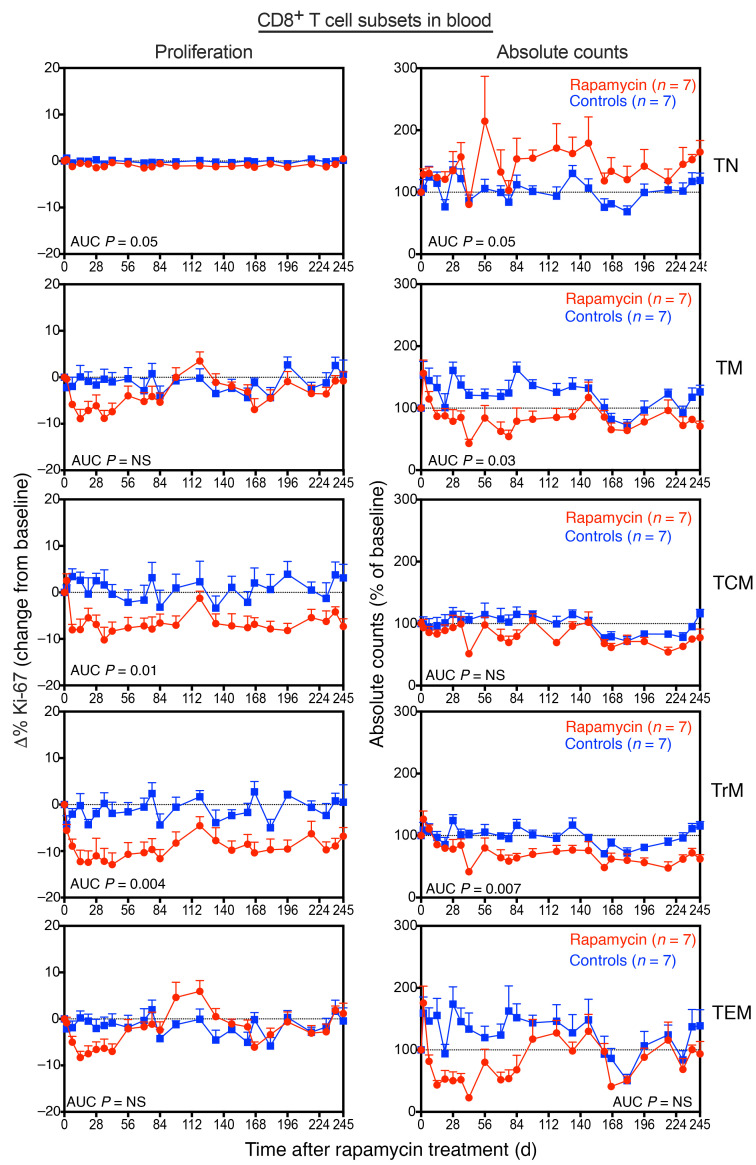
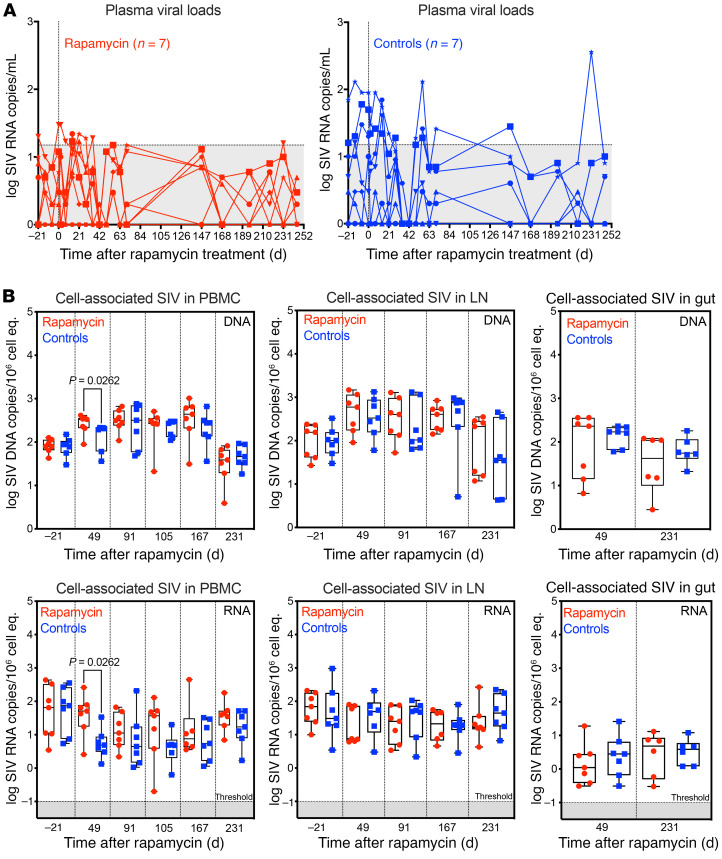
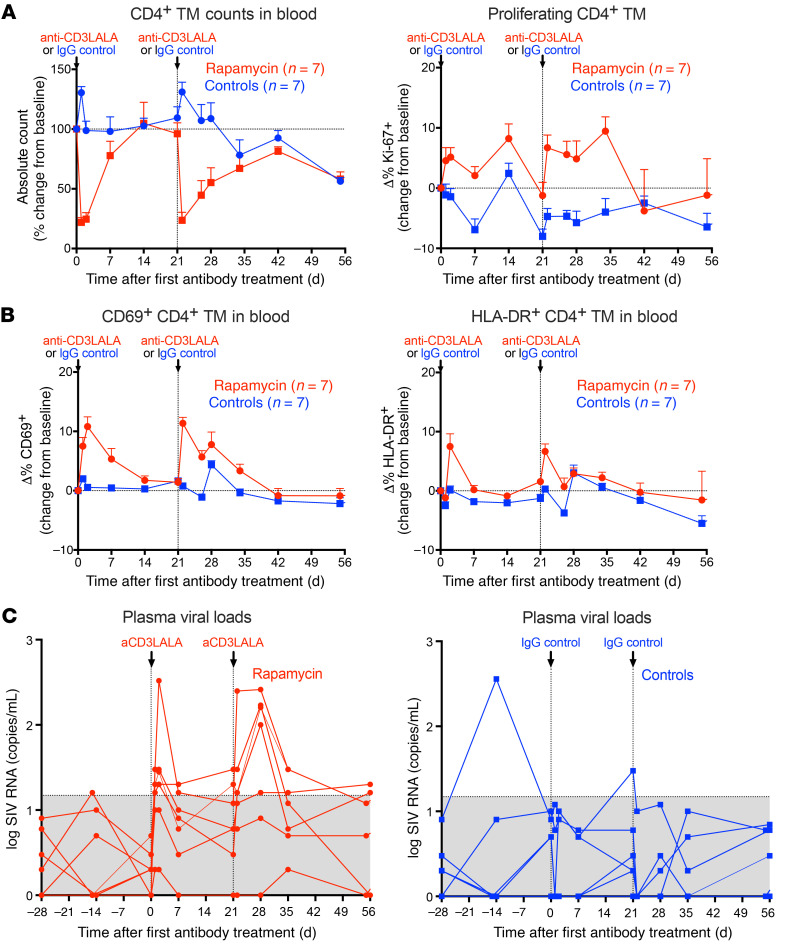
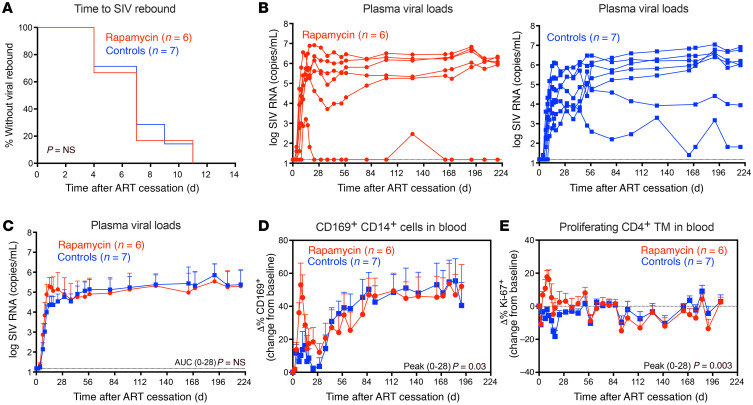
Proliferation of latently infected CD4+ T cells with replication-competent proviruses is an important mechanism contributing to HIV persistence during antiretroviral therapy (ART). One approach to targeting this latent cell expansion is to inhibit mTOR, a regulatory kinase involved with cell growth, metabolism, and proliferation. Here, we determined the effects of chronic mTOR inhibition with rapamycin with or without T cell activation in SIV-infected rhesus macaques (RMs) on ART. Rapamycin perturbed the expression of multiple genes and signaling pathways important for cellular proliferation and substantially decreased the frequency of proliferating CD4+ memory T cells (TM cells) in blood and tissues. However, levels of cell-associated SIV DNA and SIV RNA were not markedly different between rapamycin-treated RMs and controls during ART. T cell activation with an anti-CD3LALA antibody induced increases in SIV RNA in plasma of RMs on rapamycin, consistent with SIV production. However, upon ART cessation, both rapamycin and CD3LALA-treated and control-treated RMs rebounded in less than 12 days, with no difference in the time to viral rebound or post-ART viral load set points. These results indicate that, while rapamycin can decrease the proliferation of CD4+ TM cells, chronic mTOR inhibition alone or in combination with T cell activation was not sufficient to disrupt the stability of the SIV reservoir.

Keywords: AIDS/HIV; Homeostasis; T cells.


Conflict of interest statement

Conflict of interest: The authors have declared that no conflict of interest exists.

Figures

Figure 1
Figure 1. Plasma and cell-associated viral loads were equivalent between study groups prior to rapamycin treatment.
(A) Schematic representation of the study protocol showing SIVmac239M infection, ART initiation 12 days dpi, rapamycin or vehicle control administration, which occurred daily from 231 to 543 dpi, and anti-CD3LALA infusion in rapamycin-treated RMs on 467 and 497 dpi. (B) Mean (+SEM) pvl profiles of rapamycin (red) or vehicle controls (blue) (n = 7 each) prior to treatment initiation. (C) Comparison of SIV RNA and DNA levels in PBMCs and LNs (copies per 106 cell equivalents) between rapamycin (red) and vehicle controls (blue) at 3 days (15 dpi) and 210 days after ART. (D) Quantification of rapamycin drug levels in plasma. (E) Mean (+SEM) change from baseline cholesterol levels in plasma of rapamycin-treated RMs (red) and vehicle controls. (F) Quantification of the number of Glut1+ T cells per 105 cells in LNs at –21, 49, and 91 days after initiation of rapamycin or vehicle in the treatment groups. Each data point represents the average number of Glut1+CD3+ T cells derived from quantitative measures from 2 to 3 LN sections from a single time point from an individual RM. The WRS test was used to determine the significance of differences between the rapamycin or vehicle control treatment groups (P values ≤ 0.05 are shown). Box plots show jittered points, a box from 1st to 3rd quartiles (IQR), and a line at the median, with whiskers extending to the farthest data point within 1.5× IQR above and below the box.
Figure 2
Figure 2. Effect of rapamycin treatment on miRNAs in plasma.
(A) Heatmap of significant differentially expressed miRNAs in the plasma between rapamycin-treated RMs (n = 6) and vehicle controls (n = 7) after 42 days of treatment. For these analyses, n = 13; miRNA sequencing libraries for 1 animal in the rapamycin group failed initial quality control steps (low read depth) and were therefore not included in the final analysis. (B) TaqMan qRT-PCR analysis of the indicated miRNA in plasma of rapamycin-treated RMs (n = 7) versus vehicle controls (n = 7) at –14 and 42 days after treatment. The WRS test was used to determine significance (P values ≤ 0.05 are shown). Box plots show jittered points, a box from 1st to 3rd quartiles (IQR), and a line at the median, with whiskers extending to the farthest data point within 1.5× IQR above and below the box.
Figure 3
Figure 3. Effect of rapamycin treatment on global gene expression.
(A) Heatmaps of the top 50 differentially expressed genes following 12 weeks of rapamycin. (B) Heatmaps of the top 50 differentially expressed genes following 26 weeks of rapamycin. Rapamycin-treated RMs are indicated as treated in dark blue (n = 7), while vehicle control RMs are indicated as untreated in light blue (n = 7).
Figure 4
Figure 4. Effect of rapamycin treatment on CD4+ T cell subset dynamics in blood.
Change in the proliferative fraction (left panels) and absolute counts (right panels) of CD4+ T subsets, including TN cells, TM cells, TCM cells, TrM cells, and TEM cells in blood following rapamycin (n = 7) versus vehicle control (n = 7) treatment. Results are shown as mean (+SEM) change from baseline of percentages of Ki-67 (left panels) and percentages of baseline absolute counts (right panels). The WRS test was used to determine the significance of differences in AUC between the 2 treatment groups (P values ≤ 0.05 are shown).
Figure 5
Figure 5. Effect of rapamycin treatment on CD4+ TM cell polarization.
(A) Mean (+SEM) change from baselines of percentages of CCR5, CXCR5, and CXCR3 on CD4+ TM cells in blood of rapamycin-treated RMs (n = 7) versus vehicle controls (n = 7). (B) Comparison of percentages of CD4+ memory Tregs (left panel) and percentages of Ki-67+CD4+ memory Tregs (right panel) in blood of rapamycin-treated RMs (n = 7) versus vehicle controls (n = 7) during ART. Each data point represents a single determination from an individual RM. The WRS test was used to determine the significance of differences in AUC between the 2 treatment groups (P values ≤ 0.05 are shown).
Figure 6
Figure 6. Effect of rapamycin treatment on CD8+ T cell subset dynamics in blood.
Change in the proliferative fractions (left panels) and absolute counts (right panels) of CD8+ T subsets, including TN cells, TM cells, TCM cells, TrM cells, and TEM cells in blood following rapamycin (n = 7) versus vehicle control (n = 7) treatment. Results are shown as mean (+SEM) change from baseline of percentages of Ki-67 (left panels) and percentages of baseline absolute counts (right panels). The WRS test was used to determine the significance of differences in AUC between the 2 treatment groups (P values ≤ 0.05 are shown).
Figure 7
Figure 7. Effect of rapamycin on SIV dynamics during ART.
(A) Individual pvl profiles monitored by a high-sensitivity assay (limit of detection [LOD] of 1 RNA copy/ml) prior to and during rapamycin (n = 7) or vehicle control treatment (n = 7), prior to ART cessation. The area in gray denotes pvl values below threshold of the standard assay (15 RNA copies/ml). (B) Comparison of cell-associated SIV DNA (top panels) and RNA (bottom panels) in PBMCs, LNs, and gut (copies per 106 cell equivalents) after 231 days of treatment with rapamycin (n = 7) or vehicle control (n = 7). Each data point represents a single determination from an individual RM. Plots show jittered points with a box from 1st to 3rd quartiles (IQR) and a line as the median, with whiskers extending to the farthest data point within 1.5× IQR above and below the box, respectively. For B, the WRS test was used to determine the significance of differences between treatment groups (P values ≤ 0.05 are shown.
Figure 8
Figure 8. Effect of anti-CD3LALA with rapamycin on SIV dynamics during ART.
(A) Mean (+SEM) change from baseline of percentages of absolute counts (left panel) and percentages of Ki-67 (right panel) of CD4+ TM cells in blood following infusion of anti-CD3LALA at 0.5 mg/kg in rapamycin-treated RMs (n = 7) versus 0.5 mg/kg of IgG isotype control mAbs in vehicle control–treated RMs (n = 7). (B) Mean (+SEM) change from baseline of percentages of CD69 (left panel) and percentages HLA-DR (right panel) on CD4+ TM cells in blood. (C) Individual pvl profiles monitored by a high-sensitivity assay (LOD of 1 RNA copy/ml) following anti-CD3LALA infusion in rapamycin-treated RMs (n = 7) or IgG isotype control mAbs in vehicle control–treated RMs (n = 7) during ART. The area in gray denotes pvl values below threshold of the standard assay (15 RNA copies/ml). WRS test was used to determine the significance of differences (A and B, peak increase or decrease from baseline: 2 1-sided tests; C, number of blips above threshold: 2-sided test) between treatment groups.
Figure 9
Figure 9. Effect of rapamycin on SIV infection dynamics after ART withdrawal.
(A) Kaplan-Meier analysis of SIV rebound kinetics in RMs treated with rapamycin (red; n = 6) versus vehicle controls (blue; n = 7). For these analyses, n = 13; 1 animal in the rapamycin group was lost from study just prior to ART withdrawal and was therefore not included in the final analysis. (B) Individual pvl profiles of RMs in each treatment group. Left panel shows rapamycin-treated RMs (blue), while right panel shows vehicle controls (blue). (C) Mean (+SEM) pvl profiles of RMs stratified by treatment group (LOD; 15 RNA copies/ml). WRS test was used to determine significance of differences in the AUC of pvl. (D) Mean (+SEM) change from baselines of percentages of CD169 in blood of rapamycin-treated RMs (n = 6) versus vehicle controls (n = 7) following ART withdrawal. (E) Mean (+SEM) change from baselines of percentages of Ki-67 in blood of rapamycin-treated RMs (n = 6) versus vehicle controls (n = 7) following ART withdrawal. The WRS test was used to determine the significance of differences between treatment groups (days 0–28 AUC or peak; P values ≤ 0.05 are shown).

Similar articles

Cited by

References

    1. Finzi D, et al. Latent infection of CD4+ T cells provides a mechanism for lifelong persistence of HIV-1, even in patients on effective combination therapy. Nat Med. 1999;5(5):512–517. doi: 10.1038/8394. - DOI - PubMed
    1. Chun TW, et al. Presence of an inducible HIV-1 latent reservoir during highly active antiretroviral therapy. Proc Natl Acad Sci U S A. 1997;94(24):13193–13197. doi: 10.1073/pnas.94.24.13193. - DOI - PMC - PubMed
    1. Siliciano JD, et al. Long-term follow-up studies confirm the stability of the latent reservoir for HIV-1 in resting CD4+ T cells. Nat Med. 2003;9(6):727–728. doi: 10.1038/nm880. - DOI - PubMed
    1. Reeves DB, et al. A majority of HIV persistence during antiretroviral therapy is due to infected cell proliferation. Nat Commun. 2018;9(1):4811. doi: 10.1038/s41467-018-06843-5. - DOI - PMC - PubMed
    1. Virgilio MC, Collins KL. The impact of cellular proliferation on the HIV-1 reservoir. Viruses. 2020;12(2):E127. - PMC - PubMed

Publication types

MeSH terms