

Fluctuations in quality of life and immune responses during intravenous immunoglobulin infusion cycles
- PMID: 35316278
- PMCID: PMC8939786
- DOI: 10.1371/journal.pone.0265852
Fluctuations in quality of life and immune responses during intravenous immunoglobulin infusion cycles
Abstract
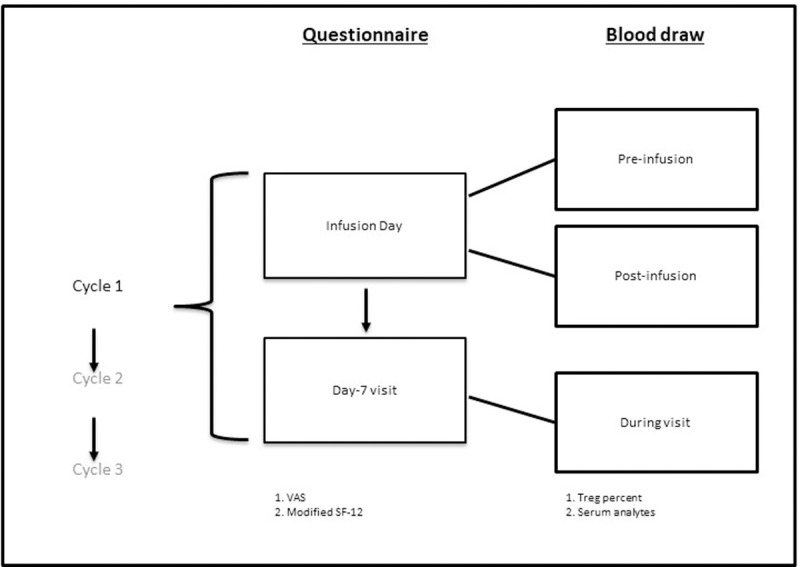
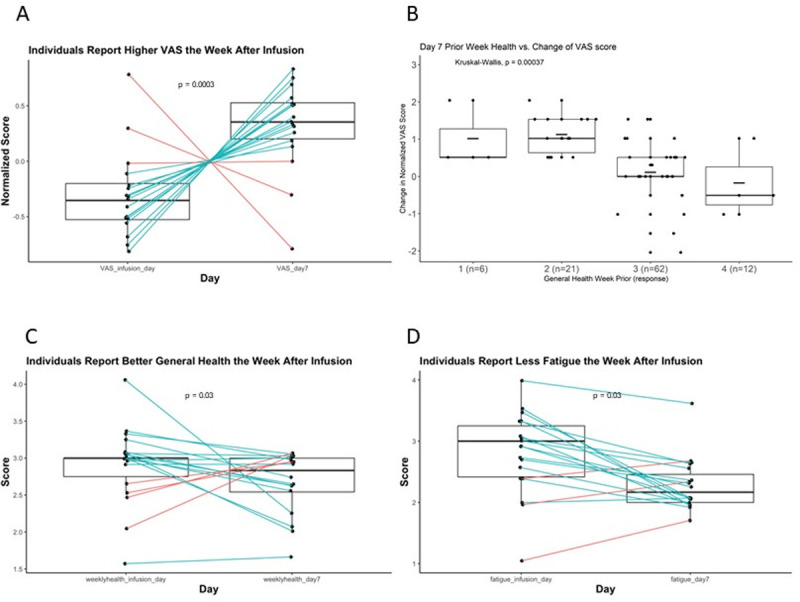
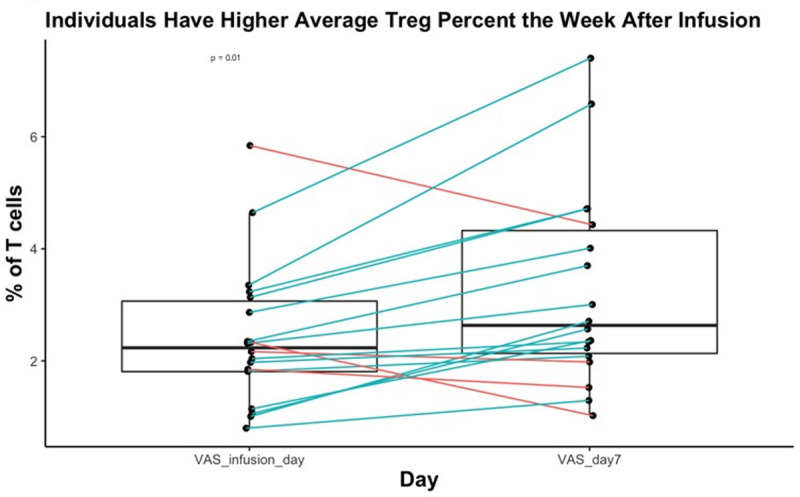
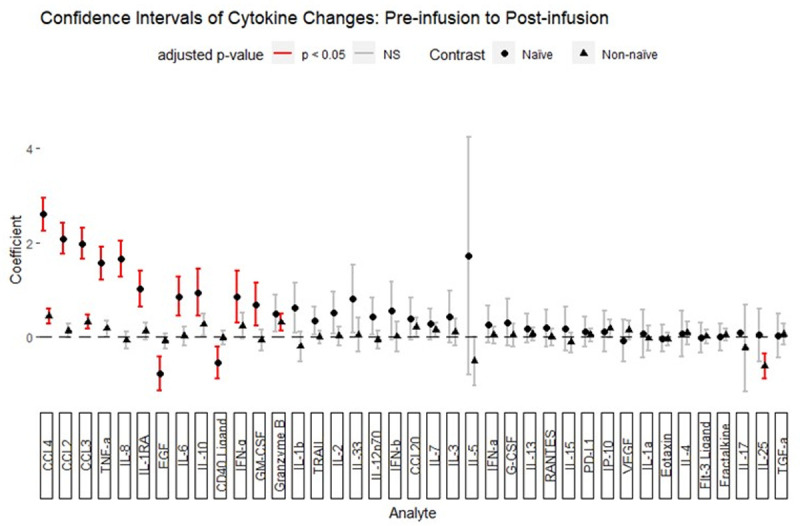
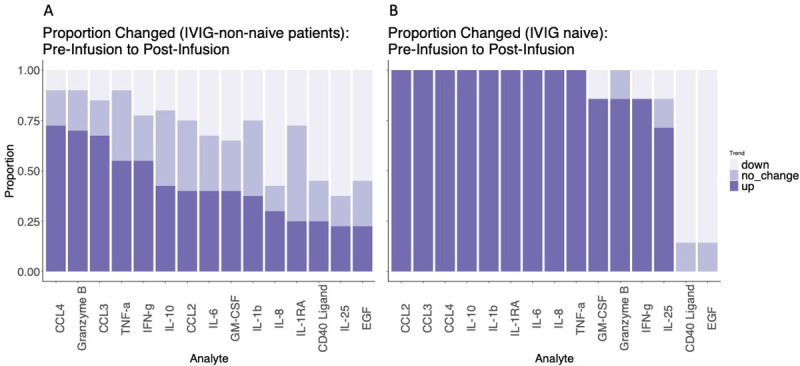
Despite adequate infection prophylaxis, variation in self-reported quality of life (QOL) throughout the intravenous immunoglobulin (IVIG) infusion cycle is a widely reported but infrequently studied phenomenon. To better understand this phenomenon, subjects with humoral immunodeficiency receiving replacement doses of IVIG were studied over 3 infusion cycles. Questionnaire data from 6 time points spread over 3 IVIG infusions cycles (infusion day and 7 days after each infusion) were collected in conjunction with monitoring the blood for number of regulatory T-cells (Treg) and levels of 40 secreted analytes: primarily cytokines, chemokines, and growth factors. At day 7, self-reported well-being increased, and self-reported fatigue decreased, reflecting an overall improvement in QOL 7 days after infusion. Over the same period, percentage of Treg cells in the blood increased (p<0.01). Multiple inflammatory chemokine and cytokine levels increased in the blood by 1 hour after infusion (CCL4 (MIP-1b), CCL3 (MIP-1a), CCL2 (MCP-1), TNF-α, granzyme B, IL-10, IL-1RA, IL-8, IL-6, GM-CSF, and IFN- γ). The largest changes in analytes occurred in subjects initiated on IVIG during the study. A significant decrease in IL-25 (IL-17E) following infusion was seen in most intervals among subjects already receiving regular infusions prior to study entry. These findings reveal several short-term effects of IVIG given in replacement doses to patients with humoral immunodeficiency: QOL consistently improves in the first week of infusion, levels of a collection of monocyte-associated cytokines increase immediately after infusion whereas IL-25 levels decrease, and Treg levels increase. Moreover, patients that are new to IVIG experience more significant fluctuations in cytokine levels than those receiving it regularly.
Conflict of interest statement
The authors have declared that no competing interests exist.
Figures
Similar articles
-
Modulating effects of intravenous immunoglobulins on serum cytokine levels in patients with primary hypogammaglobulinemia.BioDrugs. 2005;19(1):59-65. doi: 10.2165/00063030-200519010-00007. BioDrugs. 2005. PMID: 15691218
-
Intravenous immunoglobulin replacement therapy in the treatment of patients with common variable immunodeficiency disease: an open-label prospective study.Clin Drug Investig. 2011;31(5):299-307. doi: 10.1007/BF03256928. Clin Drug Investig. 2011. PMID: 21473654
-
Intravenous immunoglobulin treatment of the post-polio syndrome: sustained effects on quality of life variables and cytokine expression after one year follow up.J Neuroinflammation. 2012 Jul 9;9:167. doi: 10.1186/1742-2094-9-167. J Neuroinflammation. 2012. PMID: 22776106 Free PMC article. Clinical Trial.
-
Systemic inflammatory response to exhaustive exercise. Cytokine kinetics.Exerc Immunol Rev. 2002;8:6-48. Exerc Immunol Rev. 2002. PMID: 12690937 Review.
-
[Mechanisms of action of intravenous immunoglobulins in the treatment of autoimmune diseases].Ann Med Interne (Paris). 1993;144(8):506-13. Ann Med Interne (Paris). 1993. PMID: 8179238 Review. French.
Cited by
-
Mechanism underlying polyvalent IgG-induced regulatory T cell activation and its clinical application: Anti-idiotypic regulatory T cell theory for immune tolerance.Front Immunol. 2023 Nov 29;14:1242860. doi: 10.3389/fimmu.2023.1242860. eCollection 2023. Front Immunol. 2023. PMID: 38094290 Free PMC article. Review.
-
Use of Immunoglobulin Replacement Therapy in Clinical Practice: A Review.J Immunother Precis Oncol. 2025 Jan 10;8(1):34-46. doi: 10.36401/JIPO-24-7. eCollection 2025 Feb. J Immunother Precis Oncol. 2025. PMID: 39811426 Free PMC article. Review.
References
-
- Orange J., Hossny E., and Weiler C., “Use of intravenous immunoglobulin in human disease: a review of evidence by members of the Primary Immunodeficiency Committee of the American Academy of,” J. Allergy Clin. Immunol., 2006. - PubMed
-
- Kasztalska K., Ciebiada M., Cebula-Obrzut B., and Górski P., “Intravenous immunoglobulin replacement therapy in the treatment of patients with common variable immunodeficiency disease: an open-label prospective study.,” Clin. Drug Investig., vol. 31, no. 5, pp. 299–307, 2011, doi: 10.1007/BF03256928 - DOI - PubMed
Publication types
MeSH terms
Substances
Grants and funding
LinkOut - more resources
Full Text Sources
Miscellaneous
