. 2022 Mar 22;17(3):e0265692.
doi: 10.1371/journal.pone.0265692. eCollection 2022.

Profilin is involved in G1 to S phase progression and mitotic spindle orientation during Leishmania donovani cell division cycle

Affiliations

Profilin is involved in G1 to S phase progression and mitotic spindle orientation during Leishmania donovani cell division cycle

Bindu Ambaru et al. PLoS One. .

Abstract

Profilin is a multi-ligand binding protein, which is a key regulator of actin dynamics and involved in regulating several cellular functions. It is present in all eukaryotes, including trypanosomatids such as Leishmania. However, not much is known about its functions in these organisms. Our earlier studies have shown that Leishmania parasites express a single homologue of profilin (LdPfn) that binds actin, phosphoinositides and poly- L- proline motives, and depletion of its intracellular pool to 50%of normal levels affects the cell growth and intracellular trafficking. Here, we show, employing affinity pull-down and mass spectroscopy, that LdPfn interacted with a large number of proteins, including those involved in mRNA processing and protein translation initiation, such as eIF4A1. Further, we reveal, using mRNA Seq analysis, that depletion of LdPfn in Leishmania cells (LdPfn+/-) resulted in significantly reduced expression of genes which encode proteins involved in cell cycle regulation, mRNA translation initiation, nucleosides and amino acids transport. In addition, we show that in LdPfn+/- cells, cellular levels of eIF4A1 protein were significantly decreased, and during their cell division cycle, G1-to-S phase progression was delayed and orientation of mitotic spindle altered. These changes were, however, reversed to normal by episomal expression of GFP-LdPfn in LdPfn+/- cells. Taken together, our results indicate that profilin is involved in regulation of G1-to-S phase progression and mitotic spindle orientation in Leishmania cell cycle, perhaps through its interaction with elF4A1 protein.


Conflict of interest statement

The authors of this manuscript have no conflicts of interest to declare.

Figures

Fig 1
Fig 1. Pull-down assay, mass spectrometry analysis, and validation with western blot.
(A) Schematic representation of the experimental design. (B) Pie chart showing the total number of GST-profilin ligands (38 proteins) grouped according to their deduced function or cellular location. The percent of proteins in each group has been labelled as Cytoskeleton (8%), Translation factors (16%), Mitochondrial (18%), Ubiquitin-dependent cellular pathways (5%), Metabolism (29%), Peptidases (8%), and Others (16%). (C) Validation of Proteomics results with western blot analysis. (a) Silver-stained 12% polyacrylamide gel. Mr, molecular weight markers; lanes 1–4 correspond to GST-Leishmania profilin (GST-LdPfn) pulldown: lane 1, Input lysate; lane 2, unbound fraction; lane 3, wash fraction; lane 4, GST-LdPfn pulldown eluate; lanes 5–8 correspond to GST- alone pulldown: lane 5, Input lysate; lane 6, unbound fraction; lane 7, wash fraction; lane 8, GST-alone pulldown eluate. (b) Western blot of lanes 1 to 8 from ‘a’ with anti-eIF4A-1 antibodies. Asterisk marks the band corresponding to eIF4A-1 protein (45.3 kDa).
Fig 2
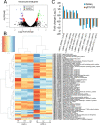
Fig 2. Differentially expressed genes.
(A) Volcano plot of differentially expressed genes. The x-axis represents the log 2-fold change and y-axis represent -log10 (adj P-value). Green dots represent up-regulated genes, blue dots represent down-regulated genes and red dots represent other differentially expressed genes. (B) Heatmap of top 30 up-regulated and down-regulated genes following hierarchical clustering analysis. L1, L2, L3 are the three replicates of controls (LdPfn+/+), and H1, H2, H3 are the three replicates of single knockout samples (LdPfn+/-). The horizontal axis represents the samples, and the vertical axis represents the differentially expressed genes (DEGs). Red indicates down-regulated genes and blue indicates up- regulated genes in LdPfn+/- cells. (C) Comparative analysis of the relative expression levels of selected transcripts determined by RNA-Seq and validated by RT-qPCR. Based on the RNA-Seq (DeSeq) analysis, five up-regulated transcripts: LdBPK_282050.1.1 (Zinc transporter 3, putative), LdBPK_352870.1.1 (major facilitator superfamily, putative), LdBPK_111260.1.1 (ATP-binding cassette protein subfamily A, member 5, putative), LdBPK_352090.1.1 (kinesin, putative), LdBPK_291550.1.1 (phosphatidylinositol-kinase domain protein. putative) and five down-regulated transcripts: LdBPK_262600.1.1 (protein kinase, putative), LdBPK_151260.1.1 (nucleoside transporter 1, putative (fragment)), LdBPK_310360.1.1 (amino acid transporter aATP11, putative (fragment)), LdBPK_260590.1.1 (Chaperonin 10, putative), LdBPK_271511.1.1 (g histone H1 like) and LdBPK_320550.1.1 (profilin) were selected for validation by RT-qPCR. The RT-qPCR experiments were conducted at least three times and the results are expressed as mean ± SEM.
Fig 3
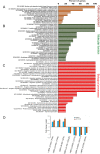
Fig 3. Gene Ontology annotation for all differentially expressed genes and their validation by RT-qPCR.
The vertical axis represents the Gene Ontology (GO) categories, and the horizontal axis represents the percentage of significant genes in that particular GO category. (A) The GO annotations of cellular component; (B) The GO annotations of molecular function; (C) The GO annotations of biological processes. The GO terms of p-value <0.05 were considered; (D) Comparative analysis of the relative expression levels of selected transcripts determined by RNA-Seq and by RT-qPCR. The transcripts corresponding to the genes of interest LdBPK_321520.1.1 (phosphatidylinositol 3-related kinase, putative), LdBPK_344160.1.1 (Phosphatidylinositol 3-kinase tor2), LdBPK_281800.1.1 (differentiation inhibitory kinase, putative), LdBPK_241790.1.1 (cell division cycle protein 20), LdBPK_323520.1.1 (CYC2-like cyclin, putative), LdBPK_010030.1.1 (Kinesin-13-1, putative), LdBPK_010790.1.1 (Eukaryotic initiation factor 4A-1) were validated by RT-qPCR. The RT-qPCR experiments were conducted at least three times and the results were expressed as mean ± SEM.
Fig 4
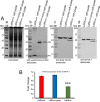
Fig 4. Western blot analysis showing depletion of eIF4A-1 protein in LdPfn+/-cells, compared to LdPfn+/+ and LdPfn+/-comp cells.
(A)(a) Coomassie blue-stained 12% SDS-polyacrylamide gel electrophoretogram showing equal loading of total cell lysates of LdPfn+/+, LdPfn+/-comp and LdPfn+/- cells. Mr, molecular weight markers; lane 1, LdPfn+/+ cell lysate; lane 2, LdPfn+/-comp cell lysate; lane 3, LdPfn+/- cell lysate. (b) Western blot of ‘a’ using anti-LdPfn antibodies. Mr, molecular weight markers; lane 1, LdPfn+/+ cells lysate showing expression of native profilin; lane 2, LdPfn+/-comp cells lysate showing expression of both episomally expressed GFP-LdPfn (43kDa) and native LdPfn (16kDa); lane 3, LdPfn+/- cells lysate showing depletion in the expression of native profilin. (c) Western blot of ‘a’ using anti-β-tubulin antibodies as loading control. Mr, molecular weight markers; lane 1, LdPfn+/+ cells lysate; lane 2, LdPfn+/-comp cells lysate; lane 3, LdPfn+/-cells lysate. For generating LdPfn+/-comp cells, the positive clone of GFP-LdPfn was transfected into LdPfn+/- cells, as described earlier [11]. Hence, there are two bands, one for native LdPfn (16KDa) and other for GFP-LdPfn (43KDa), for profilin in LdPfn+/-comp cells lysate immunoblot. (d) Western blot of ‘a’ using anti-eIF4A-1 antibodies. Mr, molecular weight markers; lane 1, LdPfn+/+ cells lysate; lane 2, LdPfn+/-comp cells lysate; lane 3, LdPfn+/- cells lysate, showing depletion in eIF4A-1 expression levels in LdPfn +/-cells, compared to LdPfn+/+ and LdPfn+/-comp cells. (B) The western blots of three independent experiments have been quantified using GelQuant.net software and the fold change in the protein expression levels of eIF4A1 was calculated by normalizing them against bands of β-tubulin. Around 50% reduction in protein expression levels of eIF4A1 was observed in LdPfn+/- cells, compared to LdPfn+/+ and LdPfn+/-comp cells.
Fig 5
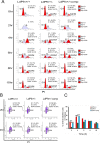
Fig 5. Retardation of cell cycle progression in LdPfn+/- cells.
(A) Representative flow cytometry data of LdPfn+/+, LdPfn+/- and LdPfn+/-comp cells. The samples were collected, after releasing hydroxyurea (HU) block, at 2 hours interval for up to 10 hours. 20,000 events were analysed at every time-point. Three independent experiments were performed, and one representative dataset is shown here. G1 (first red peak), S (grey peak) and G2/M (second red peak) phases are indicated in the histogram itself along with percent of cells in each phase. LdPfn+/+ cells entered into S-phase at 2 hours after release of HU block. However, transition of LdPfn+/- cells from G1- to S-phase was considerably delayed, compared to LdPfn+/+ and LdPfn+/-comp cells. (B) Representative flow cytometry data with BrdU incorporation in LdPfn+/+, LdPfn+/- and LdPfn+/-comp cells. The cells were collected, after releasing the HU block, at 2 hours interval for up to 10 hours, and then labelled with anti-BrdU antibodies, as described in ‘Materials and Methods’. 10,000 events were analysed at every time-point. Three independent experiments were performed, and one representative dataset of 2 hours and 4 hours is shown. G1, S and G2/M phases are indicated in the histogram along with the percent of cells in each phase. In LdPfn+/- cells, a significantly lesser number of cells (6.01% and 24.61%, respectively, at 2 hours and 4 hours after releasing HU block) exhibited BrdU incorporation in S-phase, as compared to LdPfn+/+ cells (30.26% and 53.93%, respectively, at 2 hours and 4 hours after releasing HU block), and LdPfn+/-comp cells (24.08% and 56.23%, respectively at 2 hours and 4 hours after releasing HU block). (C) Bar diagram showing considerably lesser number of BrdU labelled LdPfn+/- cells (green bar) in S-phase at 2 hours and 4 hours after releasing the HU block, compared to LdPfn+/+ cells (red bar) and LdPfn+/-comp cells (blue bar) at the same time points. p-value ***<0.001 at both 2 hours and 4hours after releasing the HU block.
Fig 6
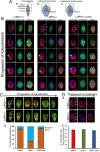
Fig 6
(A) Schematic representation of L.donovani (a) Promastigote (b) The plane of the nuclear division during karyokinesis when positioned parallel to the flagellar base in promastigote, lead to the formation of a laterally arranged spindle between the two dividing nuclei. (c) The plane of the nuclear division during karyokinesis when positioned perpendicular to the flagellar base in promastigote, lead to the formation of a longitudinally arranged spindle between the two dividing nuclei. (B) Representative immunofluorescence images of cell division pattern in LdPfn+/+, LdPfn+/- and LdPfn+/-comp cells. The cells were stained with anti-tubulin (red) and anti-LdPfn (green) antibodies and DAPI (blue). Analysis of dividing cells revealed that the plane of the nuclear division during karyokinesis in the LdPfn+/+ and LdPfn+/-comp cells was positioned parallel to the flagellar base, leading to the formation of laterally arranged spindle between the two dividing nuclei. In contrast, in the LdPfn+/- cells the dividing nuclei were arranged nearly perpendicular to the flagellar base, leading to a longitudinally formed mitotic spindle. Scale: 2μm; F, Flagellar base; K, Kinetoplast; N, Nucleus. (C) (a) The cells were alternately labelled with tubulin (green) and the nucleus and the kinetoplast with propidium iodide (red). In this case also, the nuclei division plane orientation in dividing LdPfn+/- cells was altered, as compared to dividing LdPfn+/+ cells. Scale: 2μm. F, Flagellar base; K, Kinetoplast; N, Nucleus. (b) Quantification of the spindle positioning (lateral or longitudinal) in the dividing cells. Percentage of cells showing laterally positioned or longitudinally positioned mitotic spindle, as quantified after labelling the cells with tubulin. Significant number of LdPfn+/- cells (n = 140) possessed nearly longitudinally positioned spindle, while LdPfn+/+ (n = 152) and LdPfn+/- comp (n = 146) cells possessed laterally positioned spindle. p-value: 0.0002. (D) Representative fluorescence images of division furrow in LdPfn+/+ and LdPfn+/-cells. (a) The cells were labelled with tubulin (red) and the nucleus and kinetoplast with DAPI (blue) for analysis of cells undergoing cytokinesis. Scale: 2μm; F, Flagellar base; K, Kinetoplast; N, Nucleus. (b) No significant difference was observed in the percent of dividing cells with division furrow in LdPfn+/- cells (n = 118), as compared to LdPfn+/+ (n = 125) and LdPfn+/-comp (146) cells, indicating that the cytokinesis was not much affected by LdPfn depletion in Leishmania cells.

Similar articles

Cited by

References

    1. Krishnan K, Moens PDJ. Structure and functions of profilins. Biophys Rev. 2009;1: 71–81. doi: 10.1007/s12551-009-0010-y - DOI - PMC - PubMed
    1. Wilkes DE, Otto JJ. Profilin functions in cytokinesis, nuclear positioning, and stomatogenesis in Tetrahymena thermophila. J Eukaryot Microbiol. 2003;50: 252–262. doi: 10.1111/j.1550-7408.2003.tb00130.x - DOI - PubMed
    1. Witke W. The role of profilin complexes in cell motility and other cellular processes. Trends Cell Biol. 2004;14: 461–469. doi: 10.1016/j.tcb.2004.07.003 - DOI - PubMed
    1. Witke W, Sutherland JD, Sharpe A, Arai M, Kwiatkowski DJ. Profilin I is essential for cell survival and cell division in early mouse development. Proc Natl Acad Sci U S A. 2001;98: 3832–3836. doi: 10.1073/pnas.051515498 - DOI - PMC - PubMed
    1. Olson EN, Nordheim A. Linking actin dynamics and gene transcription to drive cellular motile functions. Nat Rev Mol Cell Biol. 2010;11: 353–365. doi: 10.1038/nrm2890 - DOI - PMC - PubMed

Publication types