. 2022 Jun 16;139(24):3505-3518.
doi: 10.1182/blood.2021014723.

Concurrent CDX2 cis-deregulation and UBTF::ATXN7L3 fusion define a novel high-risk subtype of B-cell ALL

Affiliations

Concurrent CDX2 cis-deregulation and UBTF::ATXN7L3 fusion define a novel high-risk subtype of B-cell ALL

Marie Passet et al. Blood. .

Abstract

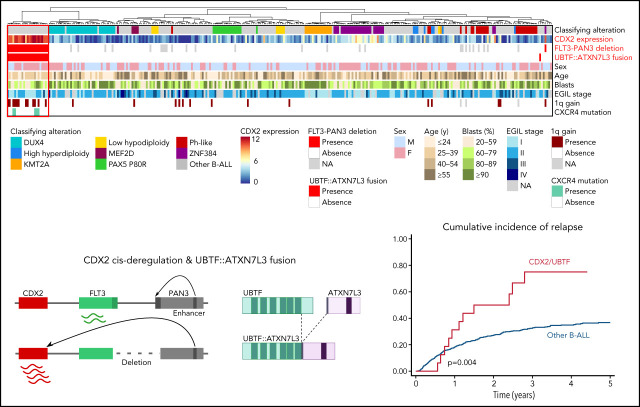
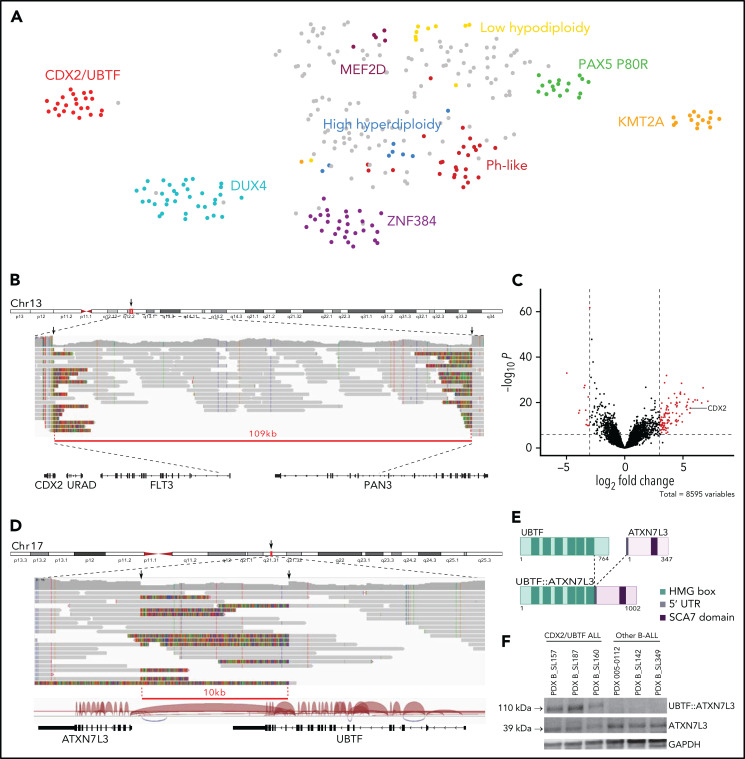
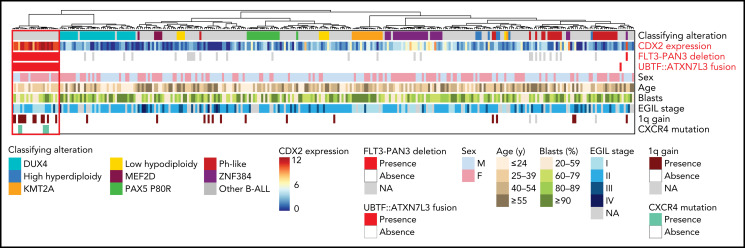
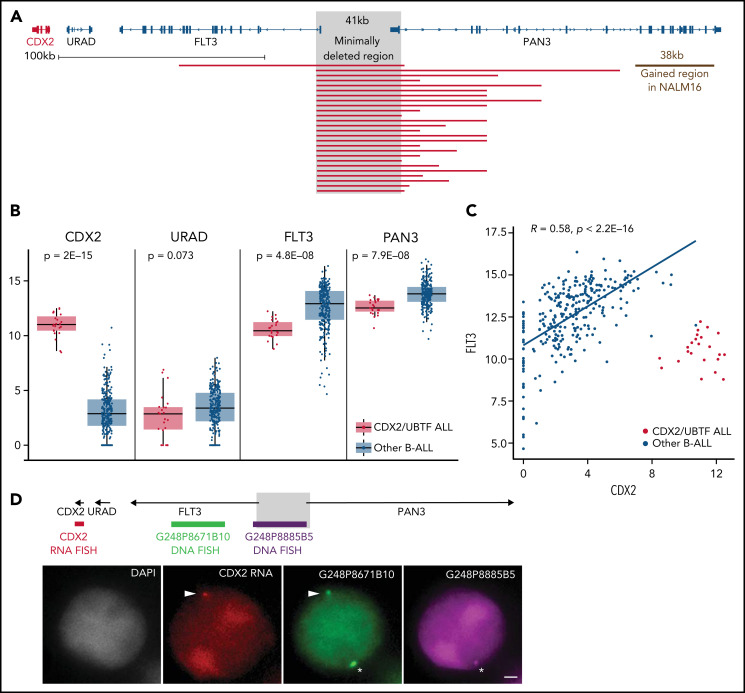
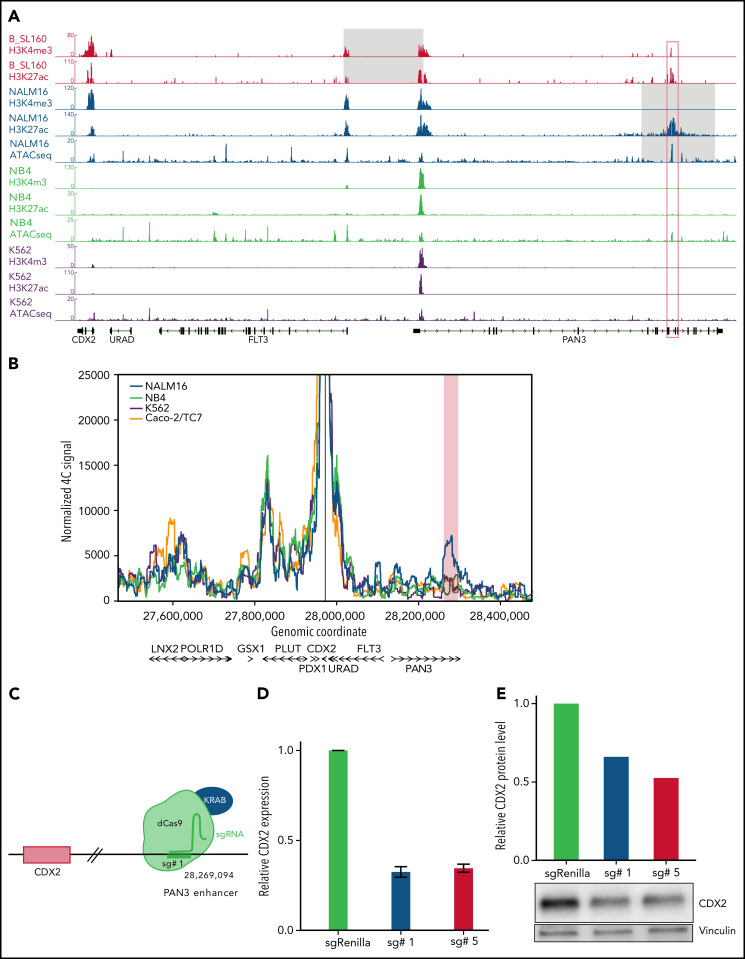
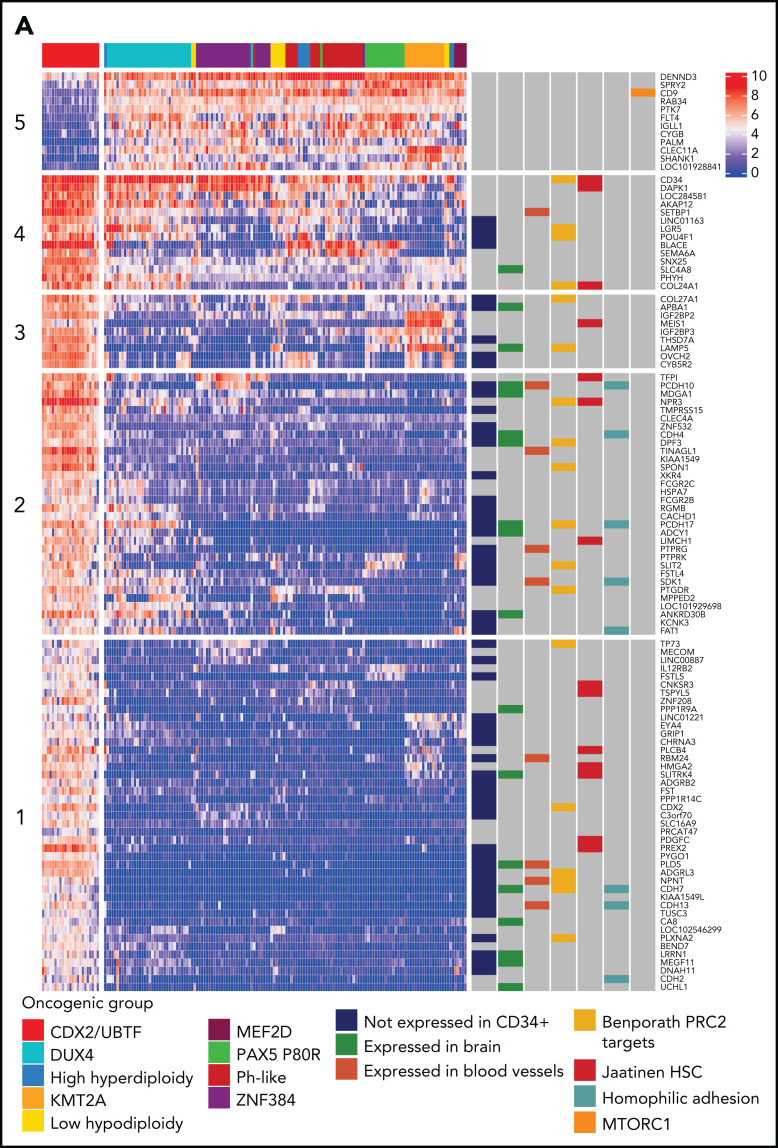
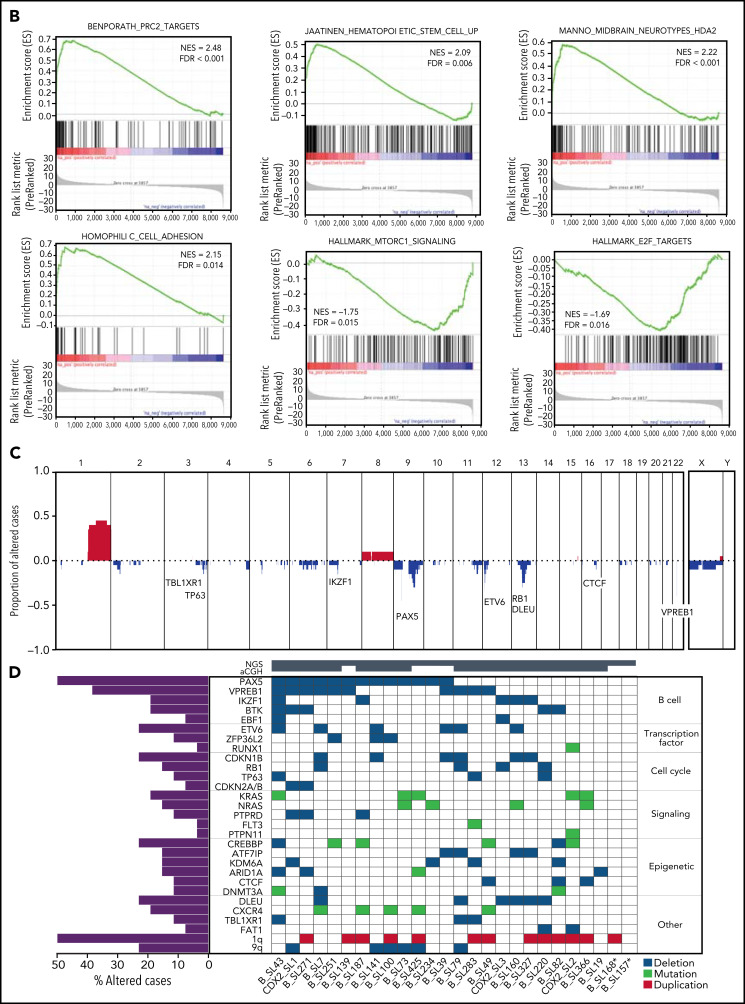
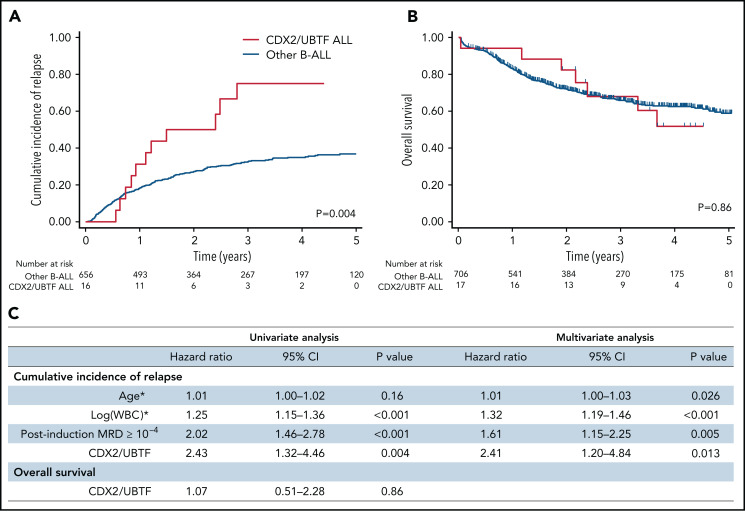
Oncogenic alterations underlying B-cell acute lymphoblastic leukemia (B-ALL) in adults remain incompletely elucidated. To uncover novel oncogenic drivers, we performed RNA sequencing and whole-genome analyses in a large cohort of unresolved B-ALL. We identified a novel subtype characterized by a distinct gene expression signature and the unique association of 2 genomic microdeletions. The 17q21.31 microdeletion resulted in a UBTF::ATXN7L3 fusion transcript encoding a chimeric protein. The 13q12.2 deletion resulted in monoallelic ectopic expression of the homeobox transcription factor CDX2, located 138 kb in cis from the deletion. Using 4C-sequencing and CRISPR interference experiments, we elucidated the mechanism of CDX2 cis-deregulation, involving PAN3 enhancer hijacking. CDX2/UBTF ALL (n = 26) harbored a distinct pattern of additional alterations including 1q gain and CXCR4 activating mutations. Within adult patients with Ph- B-ALL enrolled in GRAALL trials, patients with CDX2/UBTF ALL (n = 17/723, 2.4%) were young (median age, 31 years) and dramatically enriched in females (male/female ratio, 0.2, P = .002). They commonly presented with a pro-B phenotype ALL and moderate blast cell infiltration. They had poor response to treatment including a higher risk of failure to first induction course (19% vs 3%, P = .017) and higher post-induction minimal residual disease (MRD) levels (MRD ≥ 10-4, 93% vs 46%, P < .001). This early resistance to treatment translated into a significantly higher cumulative incidence of relapse (75.0% vs 32.4%, P = .004) in univariate and multivariate analyses. In conclusion, we discovered a novel B-ALL entity defined by the unique combination of CDX2 cis-deregulation and UBTF::ATXN7L3 fusion, representing a high-risk disease in young adults.


Figures

None
Graphical abstract
Figure 1.
Figure 1.
Identification of a novel gene expression B-ALL cluster characterized by CDX2 high expression and UBTF::ATX7NL3 fusion. (A) Gene expression profiling of 302 B-ALL cases shown in a 2-dimensional tSNE plot. This analysis was performed with 235 selected genes listed in supplemental Table 6. Major B-ALL subtypes are highlighted in different colors, and gray dots indicate other B-ALL. A novel cluster of cases with distinct gene expression profiling was identified, thereafter named CDX2/UBTF ALL. (B) WGS long-reads visualized on IGV software in 1 CDX2/UBTF case (B_SL160) showing a deletion at 13q12.2 locus close to the CDX2 gene. The red line underlines the deleted region. (C) Volcano plot of differentially expressed genes between CDX2/UBTF ALL (n = 23) and other B-ALL cases (n = 279). Genes with fold change greater than 3 and -log10 P value >7 are shown in red. CDX2 is highlighted as 1 of the 10 most highly expressed genes in the novel cluster. (D) WGS long-reads and RNA-seq splice junctions visualized on IGV software in 1 CDX2/UBTF case (B_SL160) showing a deletion at 17q21.31 locus involving the UBTF and ATXN7L3 genes. The red line underlines the deleted region. (E) Scheme of the predicted UBTF::ATXN7L3 chimeric protein. The resulting in-frame fusion transcript incorporated 60 nucleotides upstream the canonical translation start codon of ATXN7L3. (F) Western-blot of CDX2/UBTF cases using ATXN7L3 antibody shows detection of normal ATXN7L3 protein (39 kDa) in all samples and another protein at a size corresponding to the predicted UBTF::ATXN7L3 chimeric protein (110 kDa) in CDX2/UBTF cases only. Western blot performed on PDX from 3 CDX2/UBTF cases (B_SL157, B_SL187, and B_SL160), 2 PAX5 P80R cases (005-0112 and B_SL142), and 1 KMT2A-r case (B_SL349). IGV, integrative genomics viewer; PDX, patient-derived xenograft; tSNE, t-distributed stochastic neighbor embedding; WGS, whole-genome sequencing.
Figure 2.
Figure 2.
Summary oncoplot highlighting the main features of CDX2/UBTF ALL within the whole RNA-seq cohort. Classifying alterations, sex, age, blast percentage, and immunophenotypic classification according to European Group for the Immunological Classification of Leukaemia (EGIL); 1q gain and CXCR4 mutations are indicated. CDX2 expression is indicated in color scale from RNA-seq data. FLT3-PAN3 deletion corresponds to the 13q12.2 deletion involving FLT3 and PAN3 promoters and exon 1 (excluding 13q12.2 deletion sparing FLT3). UBTF::ATXN7L3 fusion indicates the presence of the fusion transcript as detected on RNA-seq data.
Figure 3.
Figure 3.
The 13q12.2 microdeletion upstream CDX2 is associated with deregulation of CDX2 in cis. (A) Capture-based sequencing of 13q12.2 locus identified focal deletion upstream of CDX2 in all CDX2/UBTF cases. The gray zone indicates the minimally deleted region. (B) Expression analysis of CDX2, URAD, FLT3, and PAN3 in CDX2/UBTF cases as compared with other B-ALL. Gene expression was quantified by RNA-seq (log2 of counts normalized using DESeq2’s median of ratios), and comparison analysis was performed by the Wilcoxon rank-sum test. (C) Dot-plot of expression data of CDX2 and FLT3 genes based on RNA-seq data for the whole cohort (n = 302) and Spearman's rank correlation analysis of non-CDX2/UBTF ALL. (D) Representative experiment (B_SL157) of sequential RNA-DNA FISH showing CDX2 primary transcripts (red signal) expressed from the allele located on the chromosome 13 exhibiting the genomic deletion (green G248P8671B10 signal and missing purple G248P8885B5 signal), shown with arrowheads. Wild-type chromosome 13 (green G248P8671B10 and purple G248P8885B5 signals) is shown by asterisks. DNA counterstained with DAPI (gray). Scale bar: 1 µm. DAPI, 4′,6-diamidino-2-phenylindole.
Figure 4.
Figure 4.
CDX2 cis-deregulation is driven by hijacking of an enhancer located in the PAN3 gene. (A) ChIP-seq signals of histone modifications (H3K4me3 and H3K27ac) of 1 representative CDX2/UBTF case (B_SL160) and ChIP-seq and ATAC-seq signals of NALM16, NB4, and K562 cell lines at the CDX2-PAN3 locus. CDX2 expression levels of cell lines are provided in supplemental Figure 5. The gray zone on CDX2/UBTF ALL and NALM16 traces indicate respectively the minimally deleted region and the duplicated region. The red box corresponds to the position of the enhancer identified in PAN3. (B) 4C-seq normalized signals of NALM16, NB4, K562, and Caco-2/TC7 cell lines with CDX2 promoter as view point. The red zone highlights the NALM16-specific called interaction (C) CRISPRi experimental scheme. In order to inactivate the enhancer in PAN3, we used the catalytically inactive CRISPR-associated protein 9 (dCas9) fused to the repressor KRAB with specific single-guide RNA. Representative example of a CRISPRi experiment showing CDX2 expression decrease in NALM16 after CRISPRi targeting the PAN3 enhancer, measured by qRT-PCR (D), and western blot (E).
Figure 5.
Figure 5.
Transcriptional signature and genomic landscape of CDX2/UBTF ALL. (A) Heatmap representing biclustering of gene expression from the major subtypes in the RNA-seq cohort (excluding unclassified cases). Genes were selected after comparison between expression means (fold change >3, P < 10−7) resulting in a list of 110 genes (supplemental Table 7). Annotations on the right are derived from selected gene set enrichment analyses (GSEA) shown in (B) and expression data from The Human Cell Atlas Bone Marrow Single-Cell Interactive Web Portal (http://www.altanalyze.org/ICGS/HCA/splash.php) and the TSEA atlas (genetics.wustl.edu/jdlab/tsea/) (B) Selected GSEA for genes expressed in CDX2/UBTF ALL as compared with other cases, showing significant enrichment in genes regulated by the Polycomb repressive complex 2 (PRC2), genes expressed in cord blood–derived CD133+ cells enriched in hematopoietic stem cells, genes involved in homophilic cell-cell adhesion, and genes expressed in a subset of embryonic neurons. The differential gene list is negatively enriched in genes upregulated through mTORC1 signaling and E2F target genes. GSEA core genes are listed in supplemental Table 11. (C) Copy-number alterations in CDX2/UBTF ALL as determined by array-CGH analysis (n = 20). (D) Heatmap of recurrent alterations in CDX2/UBTF cases as determined by array-CGH and targeted sequencing (n = 26), with frequencies of altered cases indicated on the left. *Cases with low blast infiltration (ie, <30%), with possibly focal copy-number alterations overlooked. TSEA, tissue specific expression analysis.
Figure 5.
Figure 5.
Transcriptional signature and genomic landscape of CDX2/UBTF ALL. (A) Heatmap representing biclustering of gene expression from the major subtypes in the RNA-seq cohort (excluding unclassified cases). Genes were selected after comparison between expression means (fold change >3, P < 10−7) resulting in a list of 110 genes (supplemental Table 7). Annotations on the right are derived from selected gene set enrichment analyses (GSEA) shown in (B) and expression data from The Human Cell Atlas Bone Marrow Single-Cell Interactive Web Portal (http://www.altanalyze.org/ICGS/HCA/splash.php) and the TSEA atlas (genetics.wustl.edu/jdlab/tsea/) (B) Selected GSEA for genes expressed in CDX2/UBTF ALL as compared with other cases, showing significant enrichment in genes regulated by the Polycomb repressive complex 2 (PRC2), genes expressed in cord blood–derived CD133+ cells enriched in hematopoietic stem cells, genes involved in homophilic cell-cell adhesion, and genes expressed in a subset of embryonic neurons. The differential gene list is negatively enriched in genes upregulated through mTORC1 signaling and E2F target genes. GSEA core genes are listed in supplemental Table 11. (C) Copy-number alterations in CDX2/UBTF ALL as determined by array-CGH analysis (n = 20). (D) Heatmap of recurrent alterations in CDX2/UBTF cases as determined by array-CGH and targeted sequencing (n = 26), with frequencies of altered cases indicated on the left. *Cases with low blast infiltration (ie, <30%), with possibly focal copy-number alterations overlooked. TSEA, tissue specific expression analysis.
Figure 6.
Figure 6.
Outcome analyses of CDX2/UBTF ALL patients. Cumulative incidence of relapse (A) and OS (B) Kaplan-Meier curves for B-ALL patients enrolled in GRAALL-2005/2014 trials according to CDX2/UBTF ALL status. (C) Univariate and multivariate outcome analyses for CDX2/UBTF ALL patients. *Continuous variables. WBC, white blood cell count.

Comment in

Similar articles

Cited by

References

    1. Look AT. Oncogenic transcription factors in the human acute leukemias. Science. 1997;278(5340):1059-1064. - PubMed
    1. Inaba H, Greaves M, Mullighan CG. Acute lymphoblastic leukaemia. Lancet. 2013; 381(9881):1943-1955. - PMC - PubMed
    1. Yeoh E-J, Ross ME, Shurtleff SA, et al. . Classification, subtype discovery, and prediction of outcome in pediatric acute lymphoblastic leukemia by gene expression profiling. Cancer Cell. 2002;1(2):133-143. - PubMed
    1. Moorman AV. New and emerging prognostic and predictive genetic biomarkers in B-cell precursor acute lymphoblastic leukemia. Haematologica. 2016; 101(4):407-416. - PMC - PubMed
    1. Huguet F, Chevret S, Leguay T, et al. ; Group of Research on Adult ALL (GRAALL) . Intensified therapy of acute lymphoblastic leukemia in adults: report of the randomized GRAALL-2005 clinical trial. J Clin Oncol. 2018;36(24):2514-2523. - PubMed

Publication types

MeSH terms

Substances