Clinical Trial
. 2022 Jun;13(3):1837-1849.
doi: 10.1002/jcsm.12984. Epub 2022 Mar 22.

Pectoralis major muscle atrophy is associated with mitochondrial energy wasting in cachectic patients with gastrointestinal cancer

Affiliations
Clinical Trial

Pectoralis major muscle atrophy is associated with mitochondrial energy wasting in cachectic patients with gastrointestinal cancer

Adeline Dolly et al. J Cachexia Sarcopenia Muscle. 2022 Jun.

Abstract

Background: Cancer cachexia is a multifactorial syndrome characterized by involuntary and pathological weight loss, mainly due to skeletal muscle wasting, resulting in a decrease in patients' quality of life, response to cancer treatments, and survival. Our objective was to investigate skeletal muscle alterations in cachectic cancer patients.

Methods: This is a prospective study of patients managed for pancreatic or colorectal cancer with an indication for systemic chemotherapy (METERMUCADIG - NCT02573974). One lumbar CT image was used to determine body composition. Patients were divided into three groups [8 noncachectic (NC), 18 with mild cachexia (MC), and 19 with severe cachexia (SC)] based on the severity of weight loss and muscle mass. For each patient, a pectoralis major muscle biopsy was collected at the time of implantable chamber placement. We used high-resolution oxygraphy to measure mitochondrial muscle oxygen consumption on permeabilized muscle fibres. We also performed optical and electron microscopy analyses, as well as gene and protein expression analyses.

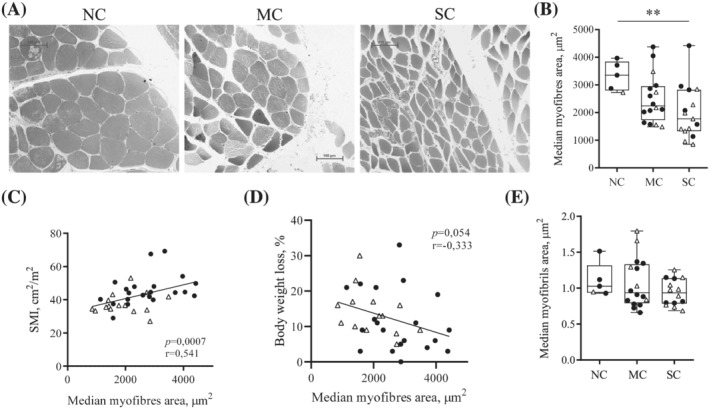
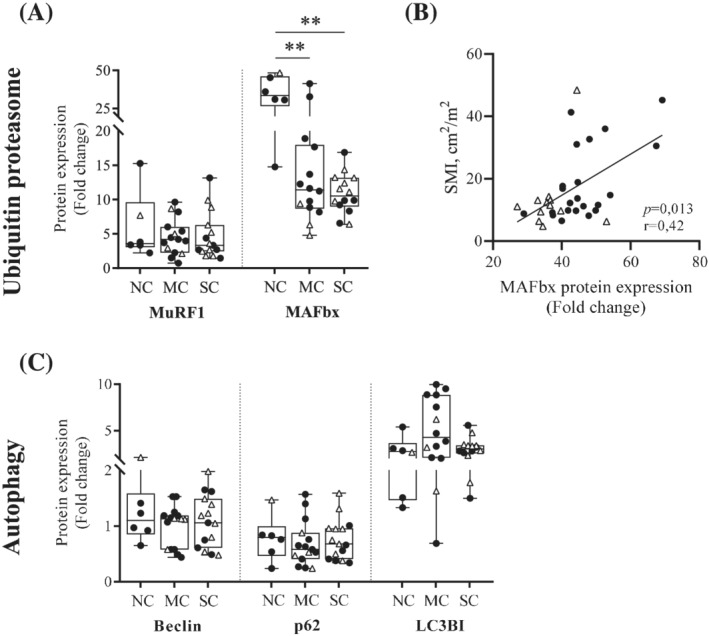
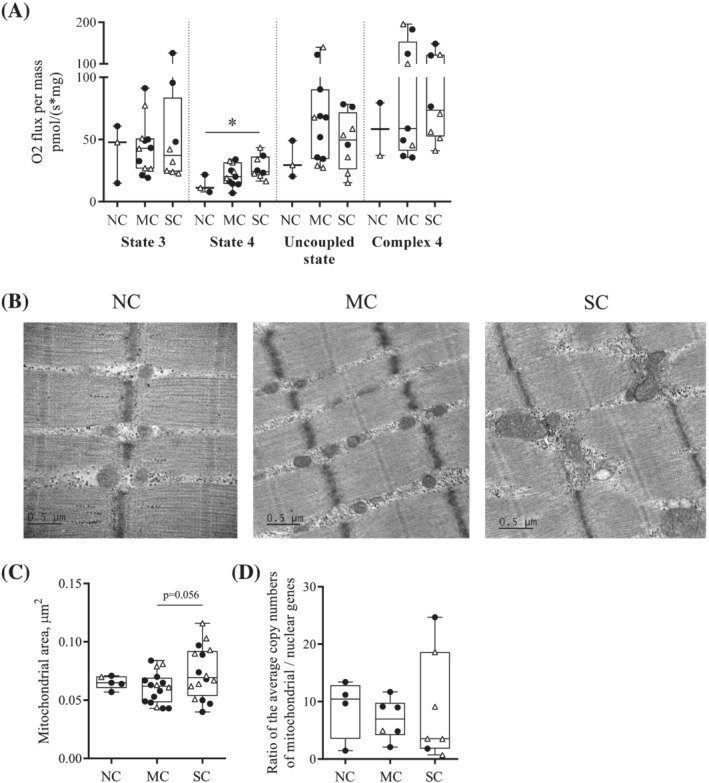
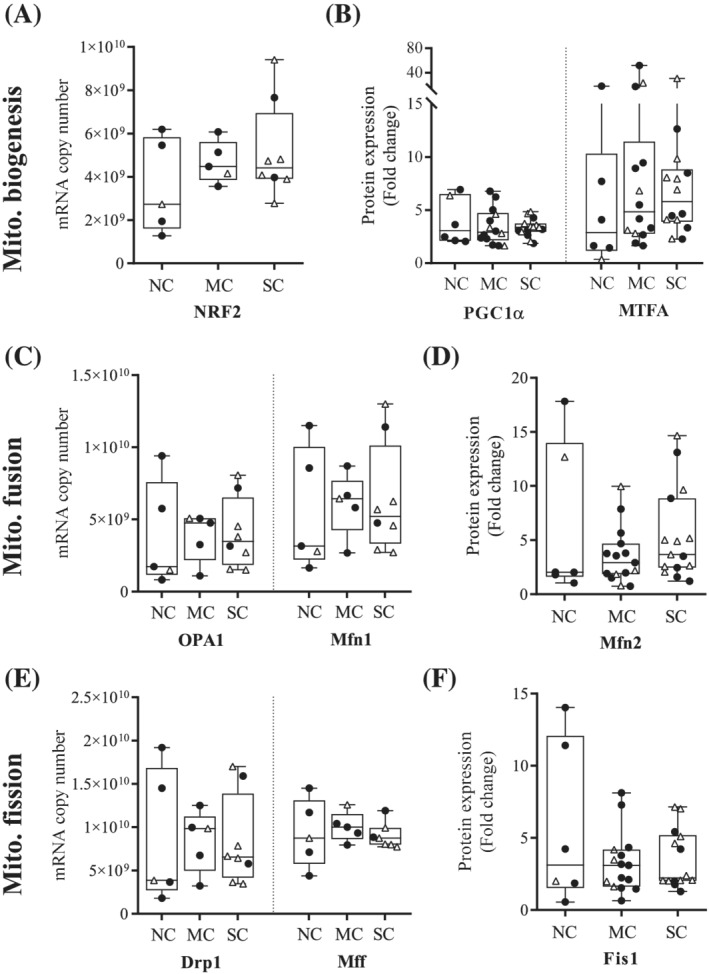
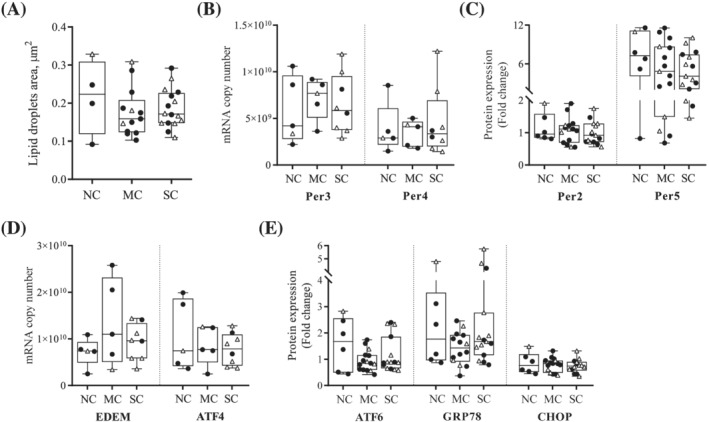
Results: Forty-five patients were included. Patients were 67% male, aged 67 years (interquartile range, 59-77). Twenty-three (51%) and 22 (49%) patients were managed for pancreatic and colorectal cancer, respectively. Our results show a positive correlation between median myofibres area and skeletal muscle index (P = 0.0007). Cancer cachexia was associated with a decrease in MAFbx protein expression (P < 0.01), a marker of proteolysis through the ubiquitin-proteasome pathway. Mitochondrial oxygen consumption related to energy wasting was significantly increased (SC vs. NC, P = 0.028) and mitochondrial area tended to increase (SC vs. MC, P = 0.056) in SC patients. On the contrary, mitochondria content and networks remain unaltered in cachectic cancer patients. Finally, our results show no dysfunction in lipid storage and endoplasmic reticulum homeostasis.

Conclusions: This clinical protocol brings unique data that provide new insight to mechanisms underlying muscle wasting in cancer cachexia. We report for the first time an increase in mitochondrial energy wasting in the skeletal muscle of severe cachectic cancer patients. Additional clinical studies are essential to further the exploring and understanding of these alterations.

Keywords: Cancer cachexia; Clinical study; Mitochondrial bioenergetics; Myosteatosis; Pectoralis major; Proteolysis.


Conflict of interest statement

The authors declare that they have no conflict of interest in connection with this article.

Figures

Figure 1
Figure 1
Pectoralis major myofibres area decreases with progression of cachexia in gastrointestinal cancer patients. (A) Representative observation by optical microscopy of pectoralis major myofibres stained with toluidine blue in noncachectic patients (NC), patients with mild cachexia (MC) or severe cachexia (SC). Scale 100 μm. (B) Median myofibres area. For each patient, the median myofibres area was calculated on approximately 200 myofibres. Correlations between median myofibres area and (C) skeletal muscle index (SMI) (Spearman); (D) body weight loss percentage (Pearson). (E) Median area of myofibrils observed by transmission electron microscopy. For each patient, four cross‐sections, each on a different myofibre, were used. Median myofibrils area was calculated on at least 30 myofibrils per section. Data are presented with IQR box and min‐to‐max whiskers and were compared using Kruskal–Wallis tests with Dunn's post hoc tests. Outliers were excluded using Grubbs' test α = 0.05. Men: black dots, women: white triangles. *P < 0.05, **P < 0.01.
Figure 2
Figure 2
Cancer cachexia is associated with decrease in MAFbx protein expression in pectoralis major muscle. (A) Protein expression levels of two markers of the proteasome‐mediated degradation pathway: MuRF1 and MAFbx, measured in pectoralis major biopsies from noncachectic patients (NC), patients with mild cachexia (MC), or severe cachexia (SC). (B) Spearman correlation between the protein expression level of MAFbx and the skeletal muscle index (SMI). (C) Protein expression levels of three markers of autophagic proteolysis: Beclin, p62, and LC3BI. Protein expression levels were determined by western blot and normalized to Tubulin. Data are presented with IQR box and min‐to‐max whiskers and were compared using Kruskal–Wallis tests with Dunn's post hoc tests. Outliers were excluded using Grubbs' test α = 0.05. Men: black dots, women: white triangles. *P < 0.05, **P < 0.01.
Figure 3
Figure 3
Cancer cachexia affects mitochondrial bioenergetics and structure in pectoralis major muscle. (A) Mitochondrial O2 consumption in permeabilized pectoralis major myofibres from noncachectic patients (NC), patients with mild cachexia (MC), or severe cachexia (SC). O2 consumption related to phosphorylation (state 3—ADP) and to energy waste (state 4—oligomycin); uncoupled state (FCCP); complex 4 (ascorbate and TMPD). (B) Representative observations in TEM (X10000) of longitudinal sections of pectoralis major from NC, MC, and SC patients. (C) Mitochondrial area analysis in TEM. For each patient, four cross‐sections and four longitudinal sections, each on a different myofibre, were used. Median mitochondrial area was calculated on at least 30 mitochondria per section. (D) Quantification of mitochondrial DNA by qPCR. Data are presented with IQR box and min‐to‐max whiskers and were compared using Kruskal–Wallis tests with Dunn's post hoc tests. Outliers were excluded using Grubbs' test α = 0.05. Men: black dots, women: white triangles. *P < 0.05.
Figure 4
Figure 4
Cancer cachexia does not affect mitochondrial biogenesis, fusion, and fission in pectoralis major muscle. (A) mRNA and (B) protein expression of three markers of mitochondrial biogenesis: NRF2, PGC1α, and MTFA, measured in pectoralis major biopsies from noncachectic patients (NC), patients with mild cachexia (MC) or severe cachexia (SC). (C) mRNA and (D) protein expression of three markers of mitochondrial fusion: OPA1, Mfn1, and Mfn2. (E) mRNA and (F) protein expression of three markers of mitochondrial fission: Drp1, Mff, and Fis1. mRNA expression levels were determined by absolute RT‐qPCR, while protein expression levels were determined by Western Blot and normalized to Tubulin. Data are presented with IQR box and min‐to‐max whiskers and were compared using Kruskal–Wallis tests with Dunn's post hoc tests. Outliers were excluded using Grubbs' test α = 0.05. Men: black dots, women: white triangles.
Figure 5
Figure 5
Cancer cachexia does not induce the accumulation of intramyocellular lipid droplets or ER stress in pectoralis major muscle. (A) Lipid droplets area analysis in TEM. For each patient, four cross‐sections and four longitudinal sections, each on a different myofibre, were used. Median area was calculated from all measurable lipid droplets. (B) mRNA expression and (C) protein expression of perilipins measured in pectoralis major biopsies from noncachectic patients (NC), patients with mild cachexia (MC) or severe cachexia (SC). (D) mRNA expression and (E) protein expression of five markers of ER stress: EDEM, ATF4, ATF6, GRP78, and CHOP. mRNA expression levels were determined by absolute RT‐qPCR, while protein expression levels were determined by Western Blot and normalized to Tubulin. Data are presented with IQR box and min‐to‐max whiskers and were compared using Kruskal–Wallis tests with Dunn's post hoc tests. Outliers were excluded using Grubbs' test α = 0.05. Men: black dots, women: white triangles.

Similar articles

Cited by

References

    1. Fearon K, Strasser F, Anker SD, Bosaeus I, Bruera E, Fainsinger RL, et al. Definition and classification of cancer cachexia: an international consensus. Lancet Oncol 2011;12:489–495. - PubMed
    1. Bachmann J, Heiligensetzer M, Krakowski‐Roosen H, Büchler MW, Friess H, Martignoni ME. Cachexia worsens prognosis in patients with resectable pancreatic cancer. J Gastrointest Surg 2008;12:1193–1201. - PubMed
    1. Fearon KC, Voss AC, Hustead DS, Cancer Cachexia Study Group . Definition of cancer cachexia: effect of weight loss, reduced food intake, and systemic inflammation on functional status and prognosis. Am J Clin Nutr 2006;83:1345–1350. - PubMed
    1. Armstrong VS, Fitzgerald LW, Bathe OF. Cancer‐associated muscle wasting—candidate mechanisms and molecular pathways. Int J Mol Sci 2020;21:9268. - PMC - PubMed
    1. Penna F, Ballarò R, Beltrà M, de Lucia S, García Castillo L, Costelli P. The skeletal muscle as an active player against cancer cachexia. Front Physiol 2019;10:10. - PMC - PubMed

Publication types

Associated data