

Label-Free Super-Resolution Imaging Techniques
- PMID: 35316608
- PMCID: PMC9454238
- DOI: 10.1146/annurev-anchem-061020-014723
Label-Free Super-Resolution Imaging Techniques
Abstract
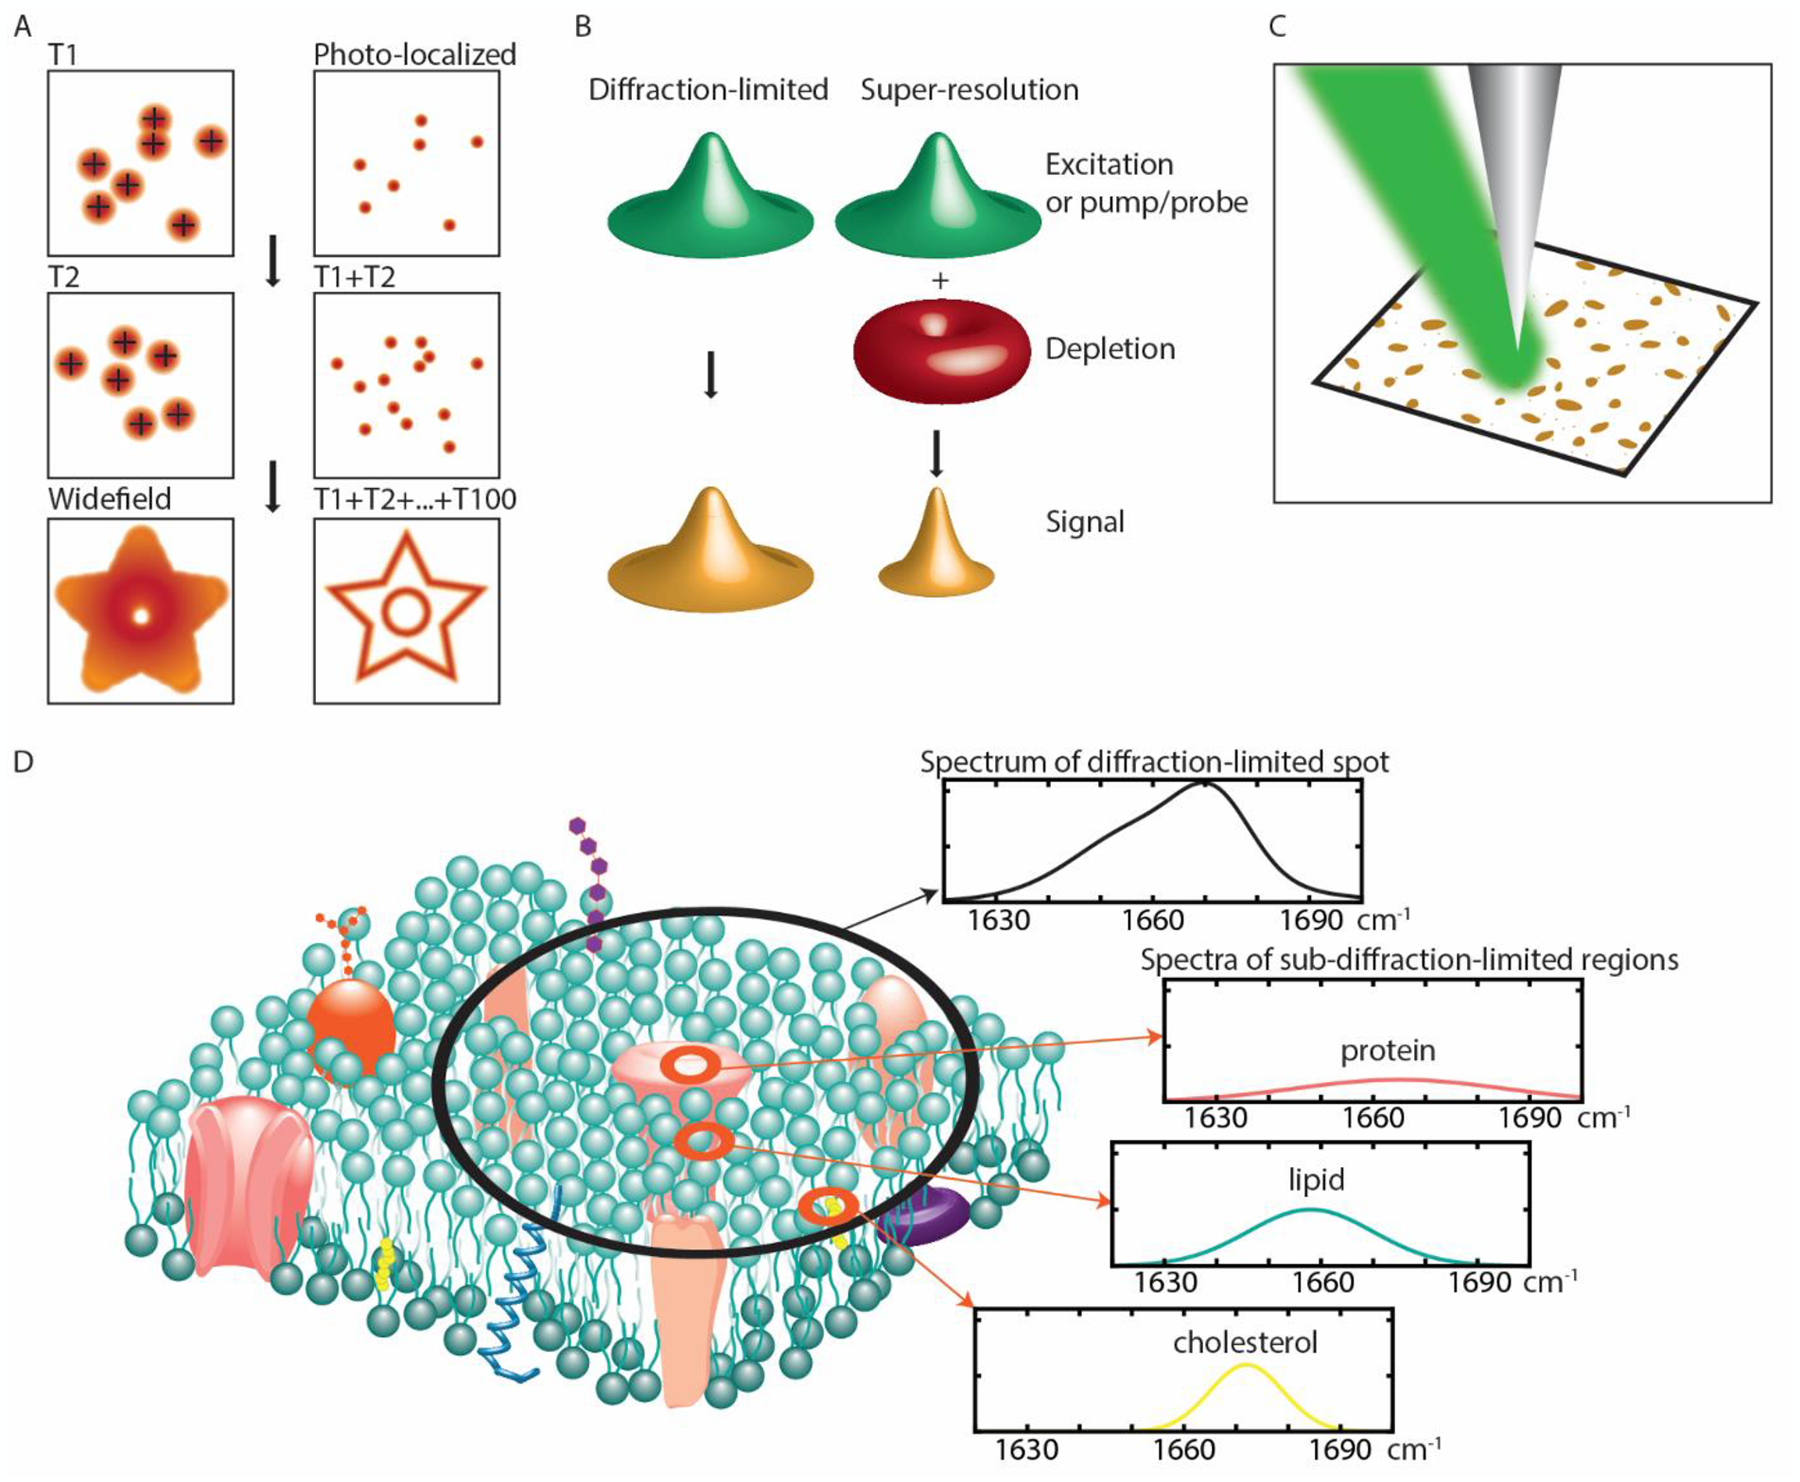
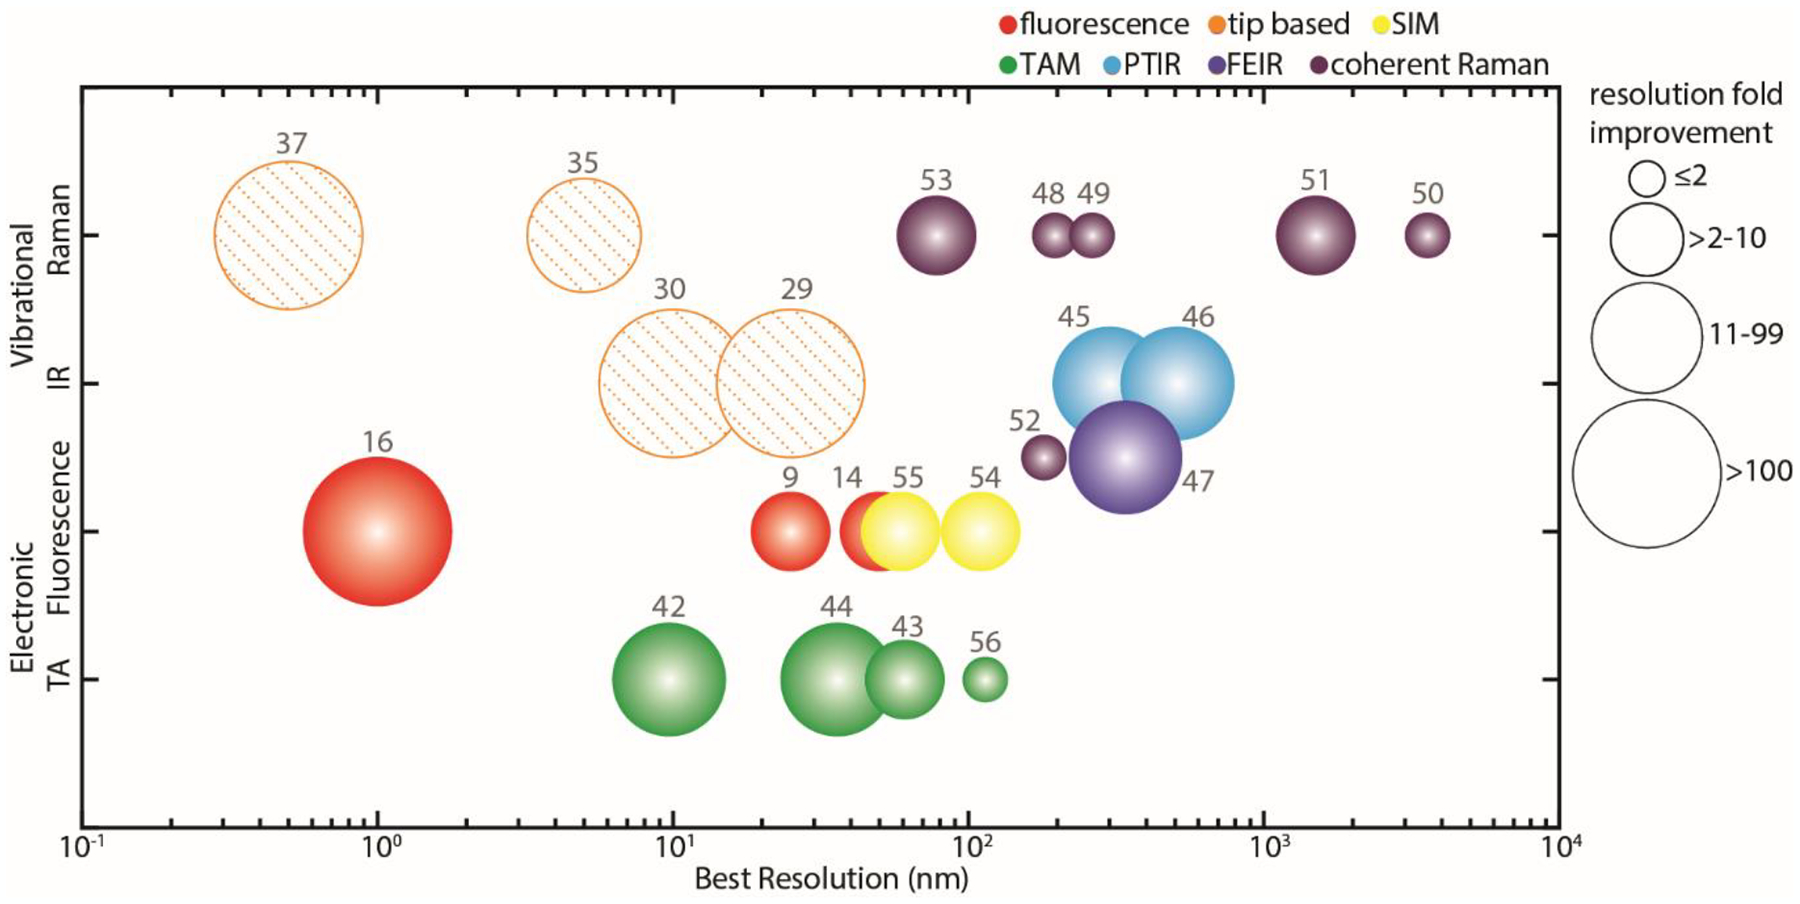
Biological and material samples contain nanoscale heterogeneities that are unresolvable with conventional microscopy techniques. Super-resolution fluorescence methods can break the optical diffraction limit to observe these features, but they require samples to be fluorescently labeled. Over the past decade, progress has been made toward developing super-resolution techniques that do not require the use of labels. These label-free techniques span a variety of different approaches, including structured illumination, transient absorption, infrared absorption, and coherent Raman spectroscopies. Many draw inspiration from widely successful fluorescence-based techniques such as stimulated emission depletion (STED) microscopy, photoactivated localization microscopy (PALM), and stochastic optical reconstruction microscopy (STORM). In this review, we discuss the progress made in these fields along with the current challenges and prospects in reaching resolutions comparable to those achieved with fluorescence-based methods.
Keywords: chemical imaging; coherent Raman imaging; label-free; photothermal infrared; subdiffraction; super-resolution Raman microscopy.
Figures
Similar articles
-
Recent advances in super-resolution fluorescence imaging and its applications in biology.J Genet Genomics. 2013 Dec 20;40(12):583-95. doi: 10.1016/j.jgg.2013.11.003. Epub 2013 Nov 23. J Genet Genomics. 2013. PMID: 24377865 Review.
-
Review of super-resolution fluorescence microscopy for biology.Appl Spectrosc. 2011 Sep;65(9):967-80. doi: 10.1366/11-06398. Appl Spectrosc. 2011. PMID: 21929850 Review.
-
Stochastic optical reconstruction microscopy (STORM) in comparison with stimulated emission depletion (STED) and other imaging methods.J Neurochem. 2015 Nov;135(4):643-58. doi: 10.1111/jnc.13257. Epub 2015 Sep 14. J Neurochem. 2015. PMID: 26222552 Review.
-
Super-Resolution Fluorescence Microscopy for Single Cell Imaging.Adv Exp Med Biol. 2018;1068:59-71. doi: 10.1007/978-981-13-0502-3_6. Adv Exp Med Biol. 2018. PMID: 29943296 Review.
-
A detailed review of genetically encodable RFPs and far-RFPs and their applications in advanced super-resolution imaging techniques.Biophys Chem. 2025 Jul;322:107432. doi: 10.1016/j.bpc.2025.107432. Epub 2025 Mar 15. Biophys Chem. 2025. PMID: 40117991 Review.
Cited by
-
Ultrafast and Nanoscale Energy Transduction Mechanisms and Coupled Thermal Transport across Interfaces.ACS Nano. 2023 Aug 8;17(15):14253-14282. doi: 10.1021/acsnano.3c02417. Epub 2023 Jul 17. ACS Nano. 2023. PMID: 37459320 Free PMC article. Review.
-
3D nanopolymerization and damage threshold dependence on laser wavelength and pulse duration.Nanophotonics. 2023 Jan 13;12(8):1537-1548. doi: 10.1515/nanoph-2022-0629. eCollection 2023 Apr. Nanophotonics. 2023. PMID: 39634590 Free PMC article.
-
Bridging Smart Nanosystems with Clinically Relevant Models and Advanced Imaging for Precision Drug Delivery.Adv Sci (Weinh). 2024 Apr;11(14):e2308659. doi: 10.1002/advs.202308659. Epub 2024 Jan 28. Adv Sci (Weinh). 2024. PMID: 38282076 Free PMC article. Review.
-
Deep Learning Approach for the Localization and Analysis of Surface Plasmon Scattering.Sensors (Basel). 2023 Sep 27;23(19):8100. doi: 10.3390/s23198100. Sensors (Basel). 2023. PMID: 37836930 Free PMC article.
-
NDUFS4 regulates cristae remodeling in diabetic kidney disease.Nat Commun. 2024 Mar 4;15(1):1965. doi: 10.1038/s41467-024-46366-w. Nat Commun. 2024. PMID: 38438382 Free PMC article.
References
-
- Hell SW, Wichmann J. 1994. Breaking the diffraction resolution limit by stimulated emission: stimulated-emission-depletion fluorescence microscopy. Opt. Lett 19(11):780–82 - PubMed
-
- Betzig E, Patterson GH, Sougrat R, Lindwasser OW, Olenych S, et al. 2006. Imaging intracellular fluorescent proteins at nanometer resolution. Science. 313(5793):1642–45 - PubMed
-
- Leung BO, Chou KC. 2011. Review of Super-Resolution Fluorescence Microscopy for Biology. Appl. Spectrosc 65(9):967–80 - PubMed
Publication types
MeSH terms
Grants and funding
LinkOut - more resources
Full Text Sources
Miscellaneous
