. 2022 Apr 13;30(4):530-544.e6.
doi: 10.1016/j.chom.2022.02.017. Epub 2022 Mar 21.

Fungal sensing enhances neutrophil metabolic fitness by regulating antifungal Glut1 activity

Affiliations

Fungal sensing enhances neutrophil metabolic fitness by regulating antifungal Glut1 activity

De-Dong Li et al. Cell Host Microbe. .

Abstract

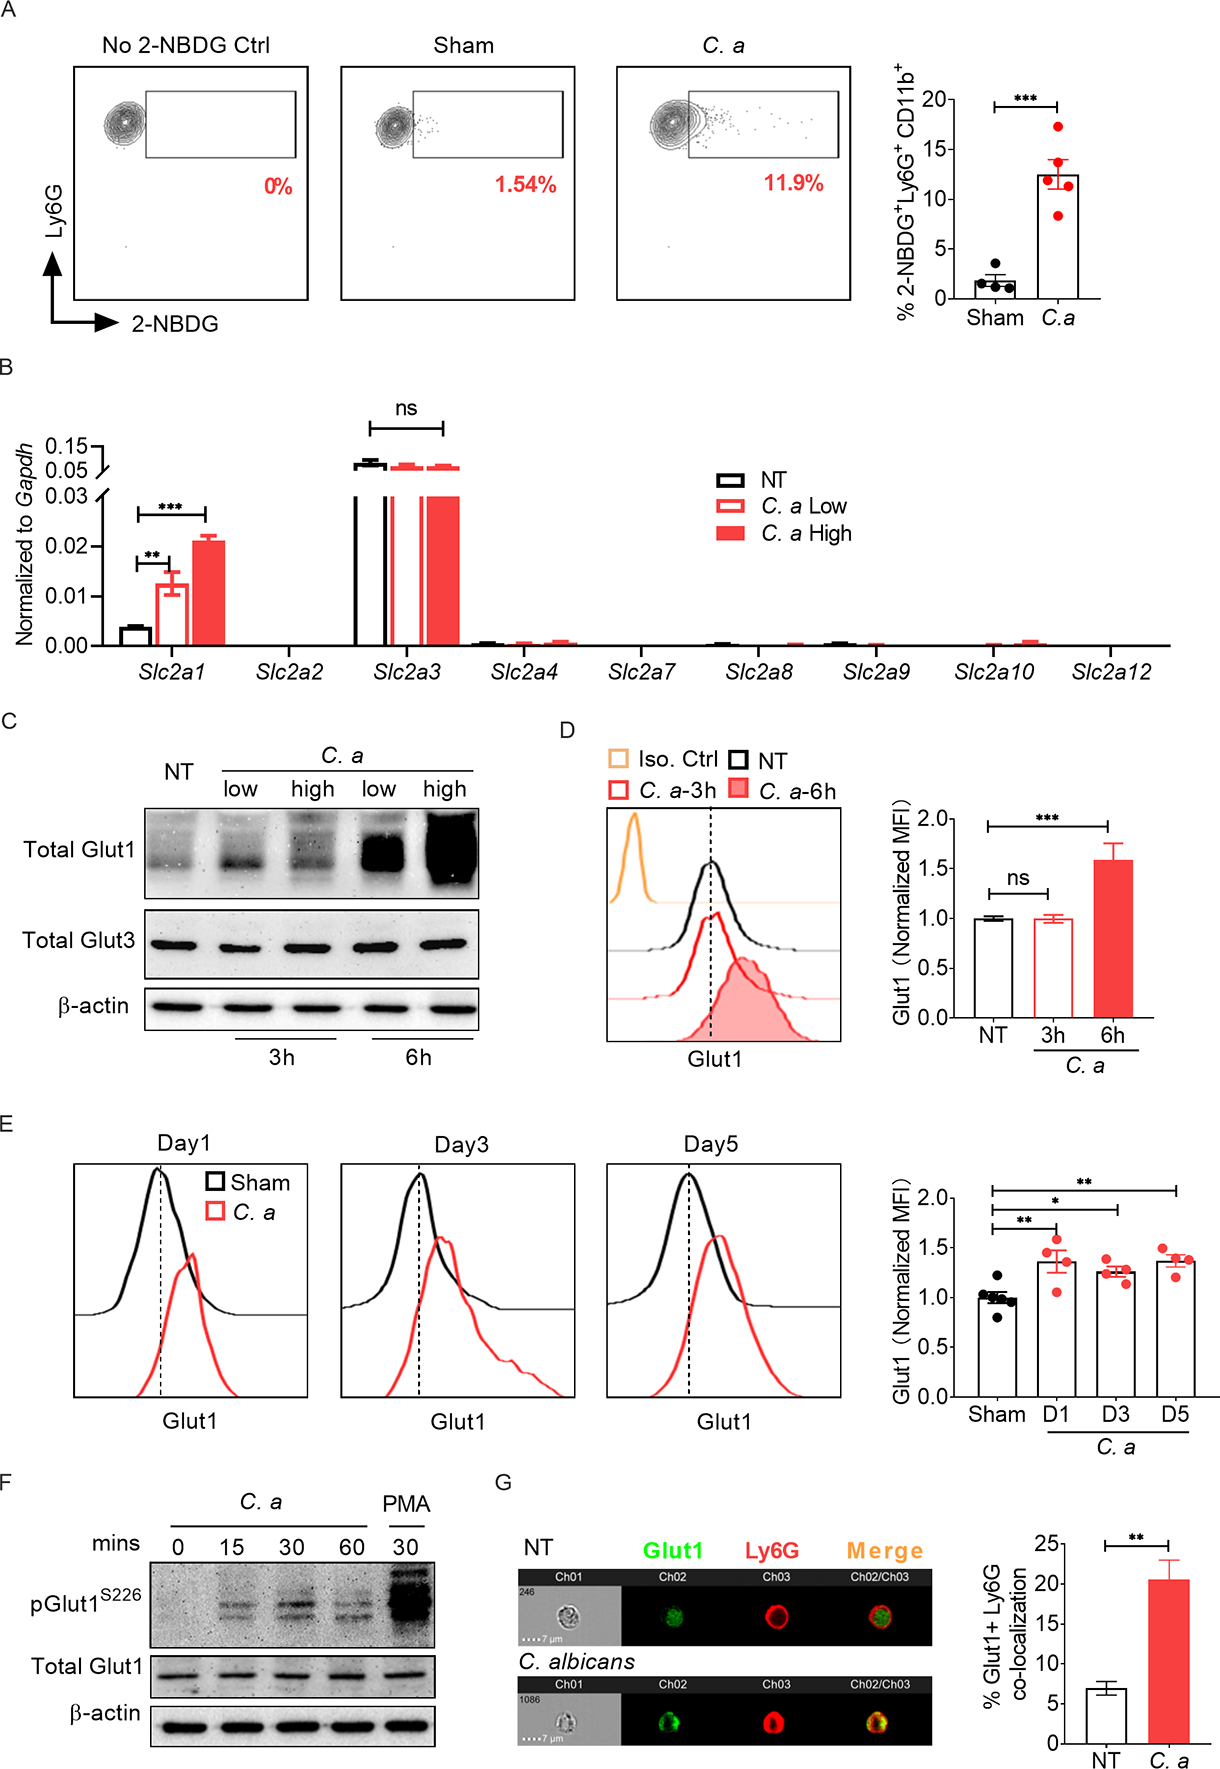
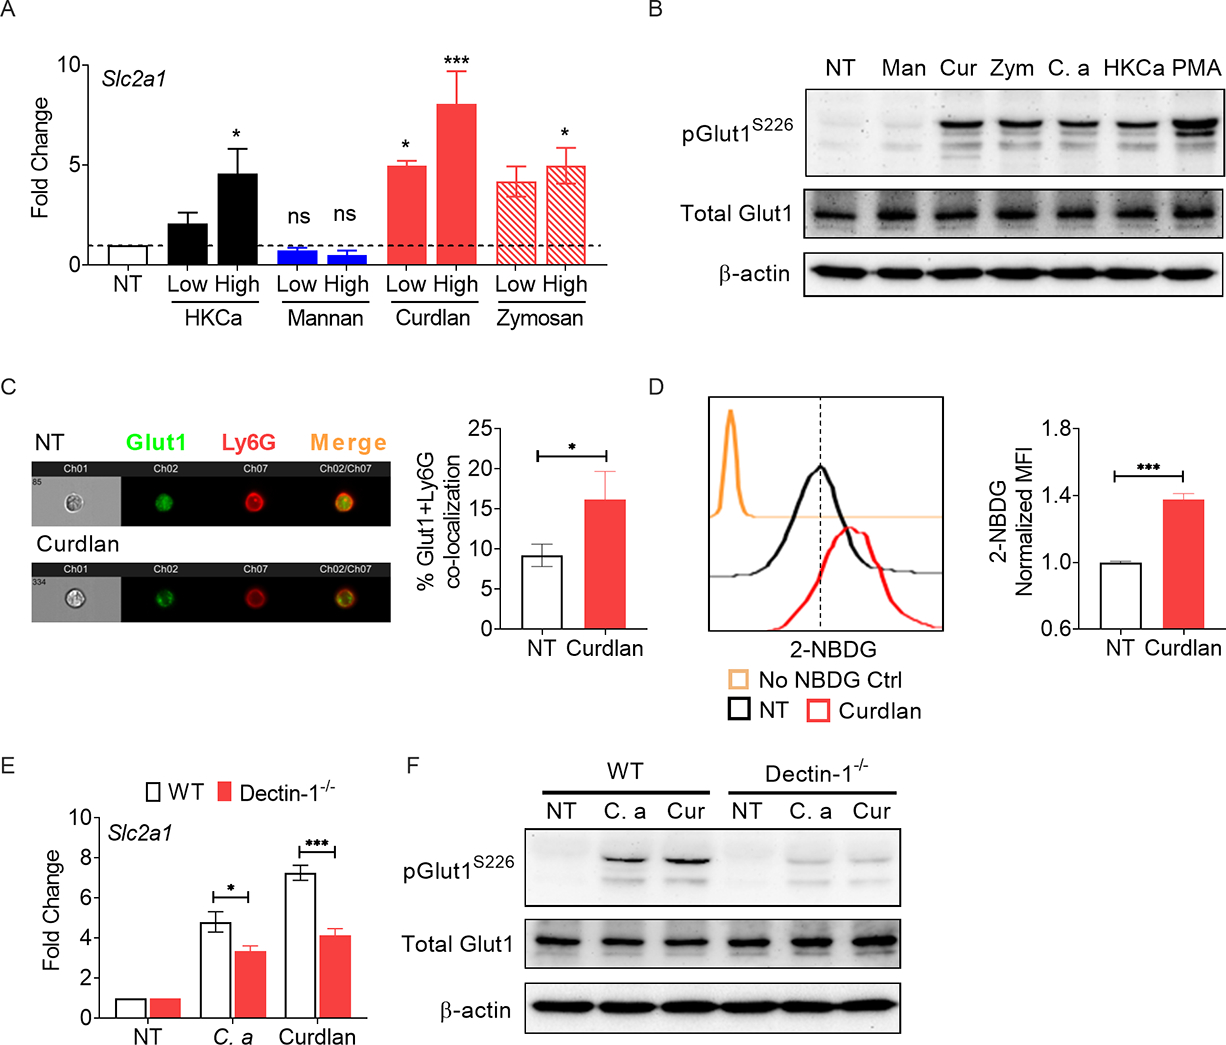
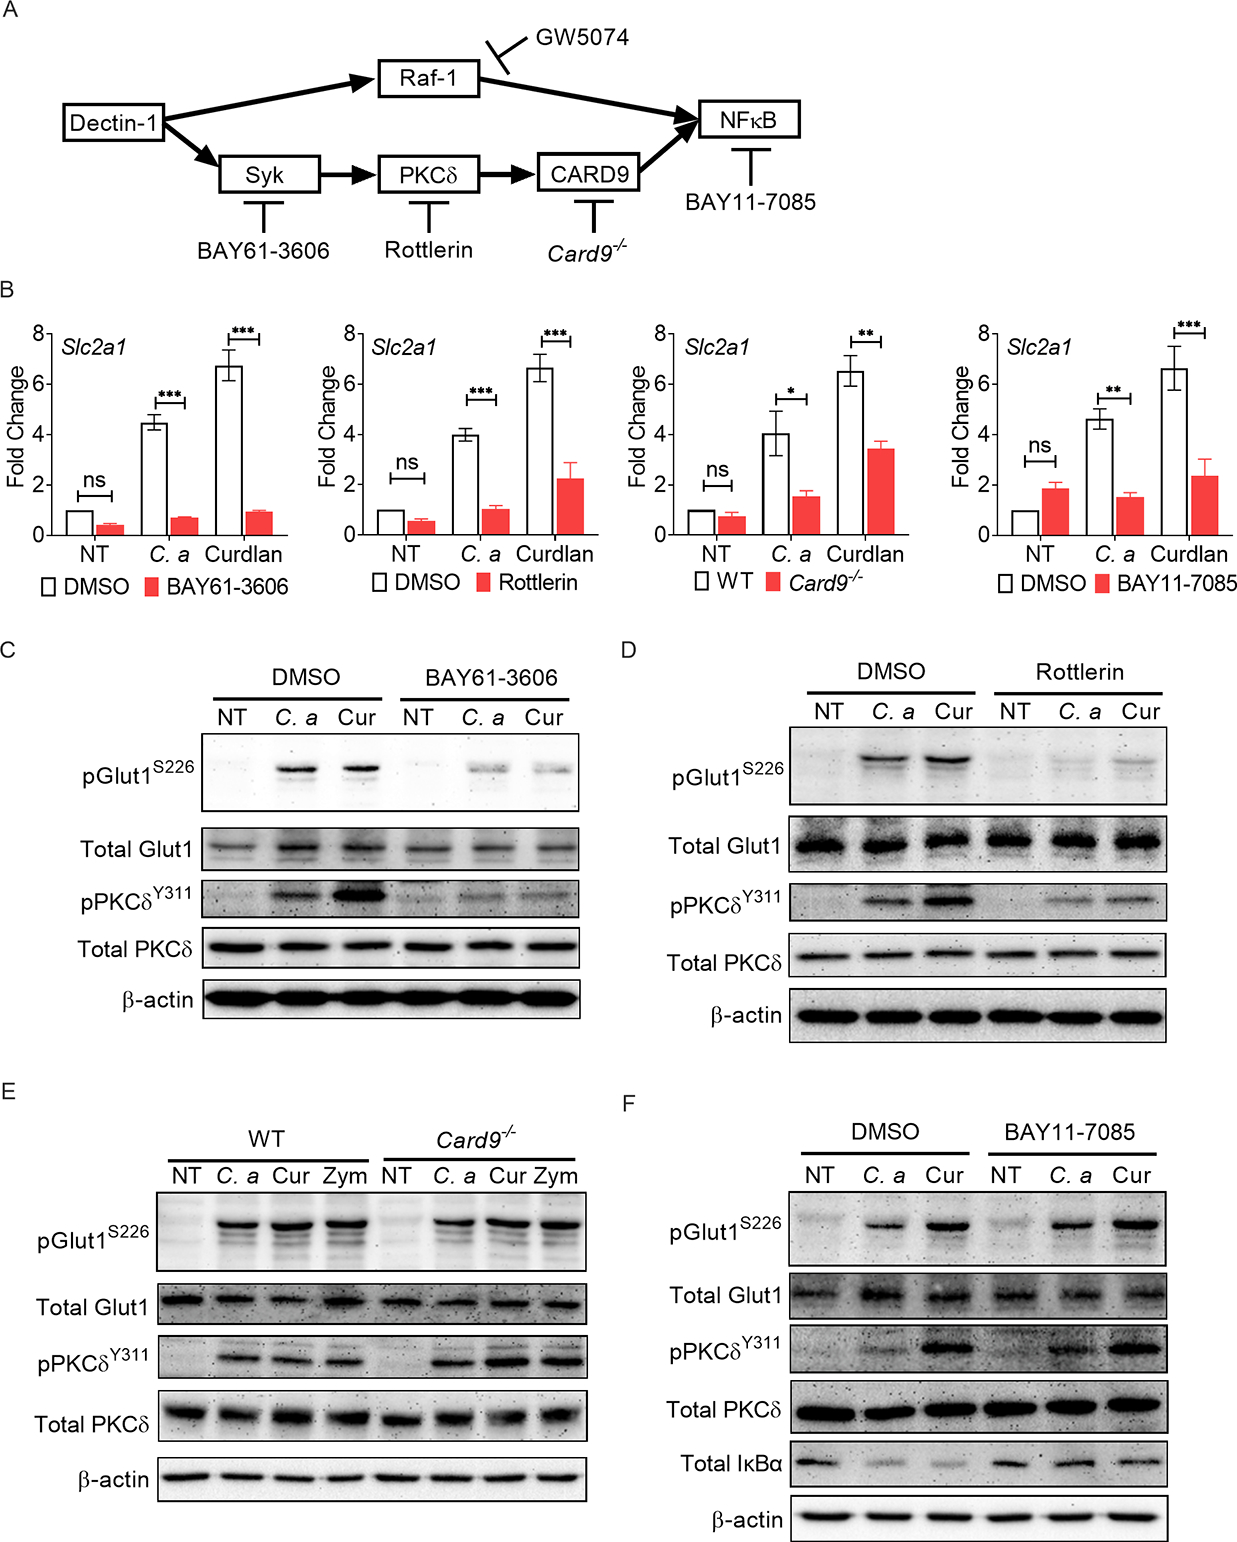
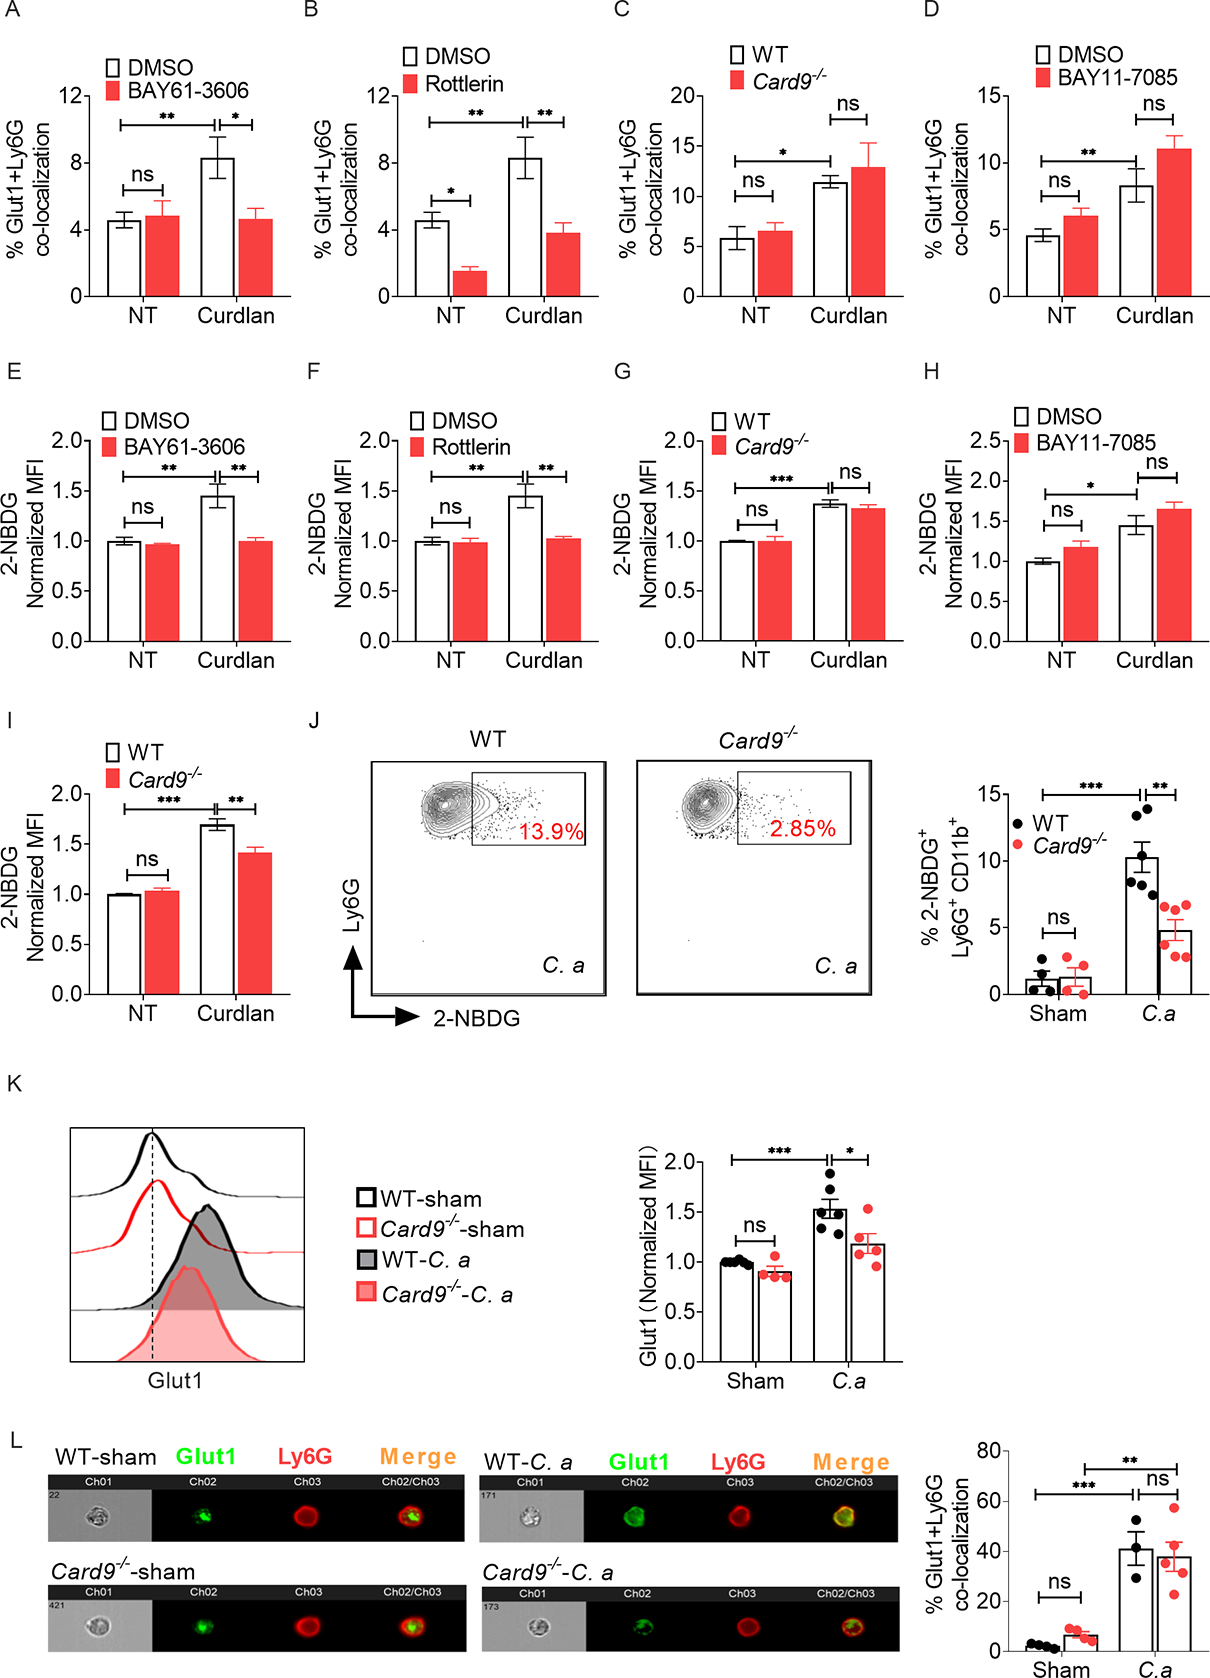
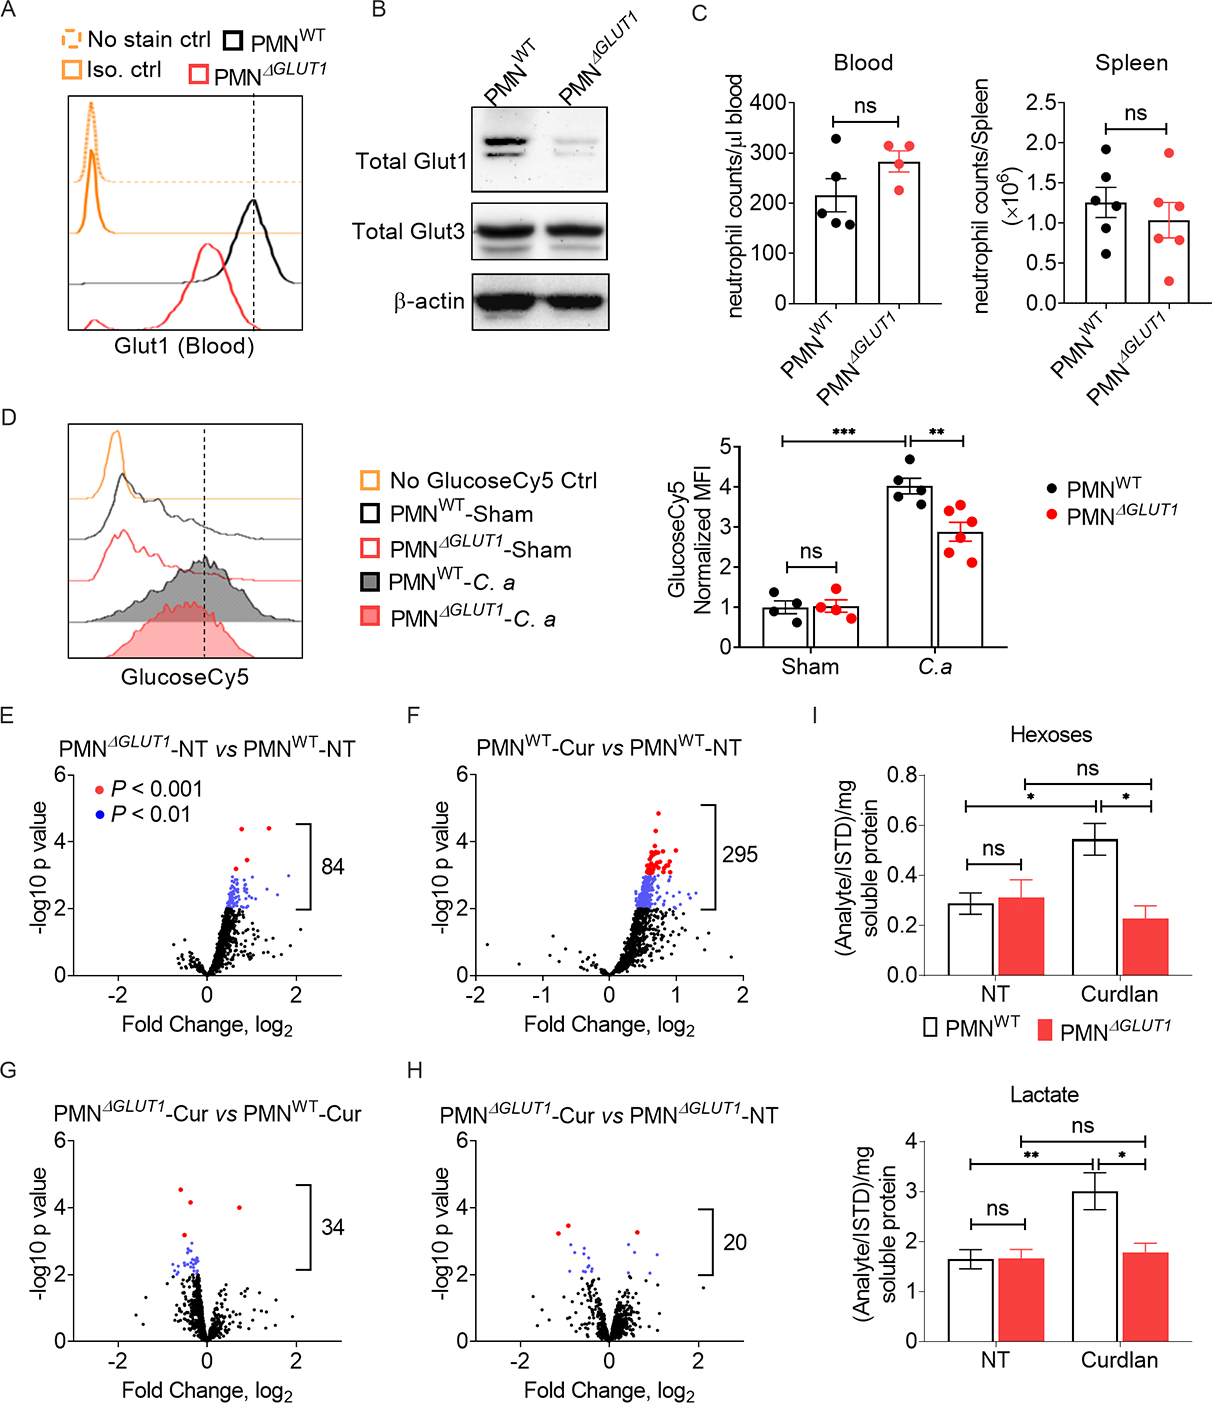
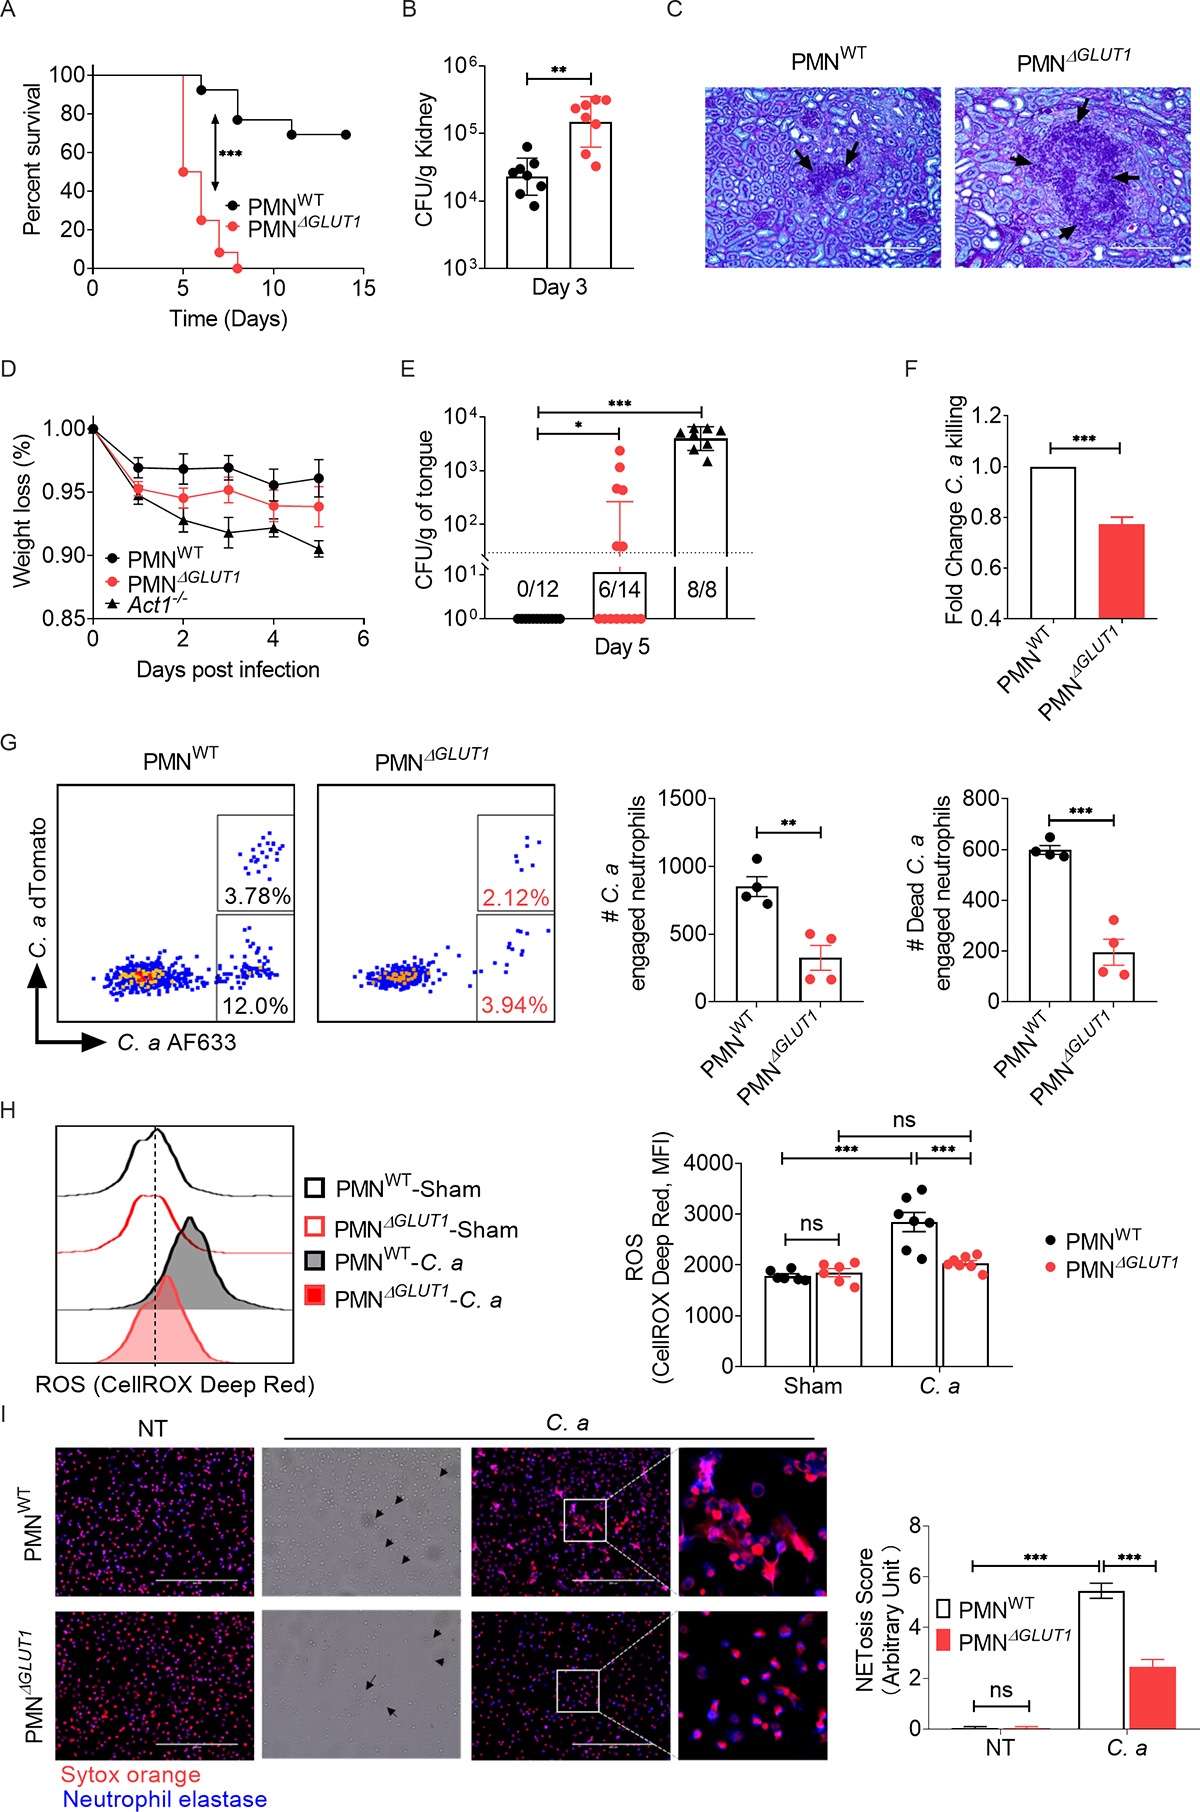
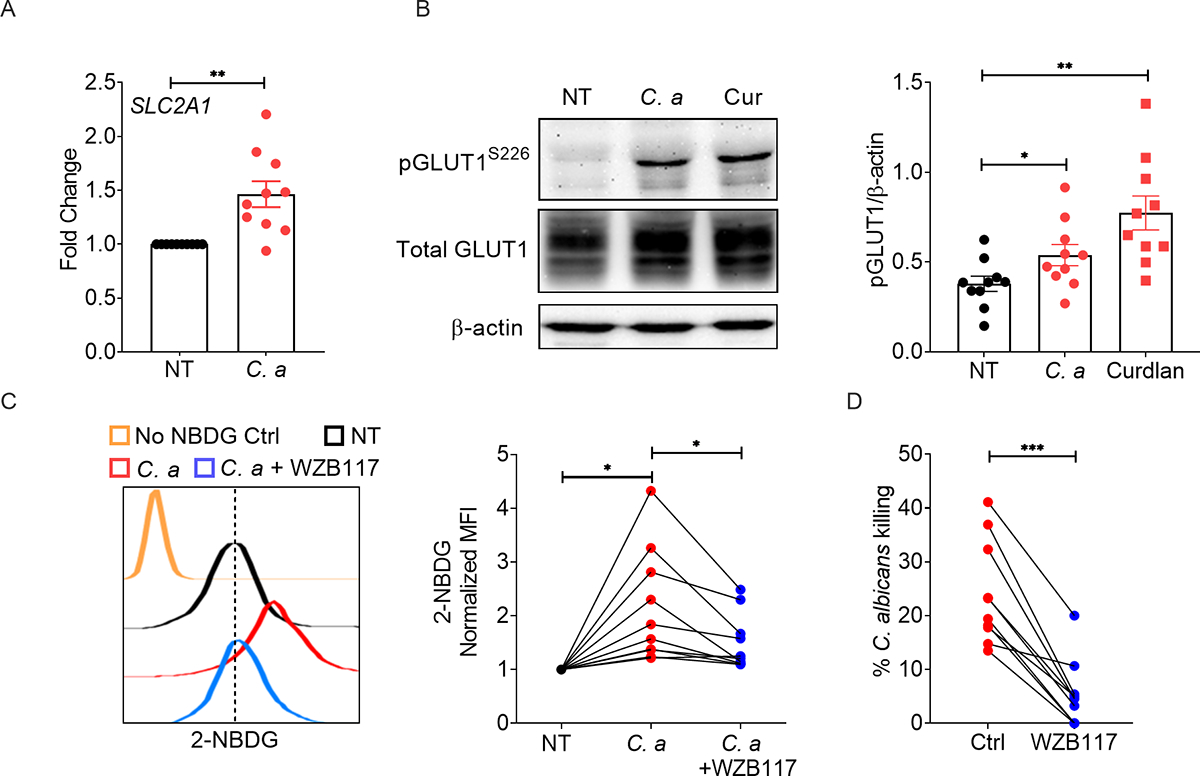
Combating fungal pathogens poses metabolic challenges for neutrophils, key innate cells in anti-Candida albicans immunity, yet how host-pathogen interactions cause remodeling of the neutrophil metabolism is unclear. We show that neutrophils mediate renal immunity to disseminated candidiasis by upregulating glucose uptake via selective expression of glucose transporter 1 (Glut1). Mechanistically, dectin-1-mediated recognition of β-glucan leads to activation of PKCδ, which triggers phosphorylation, localization, and early glucose transport by a pool of pre-formed Glut1 in neutrophils. These events are followed by increased Glut1 gene transcription, leading to more sustained Glut1 accumulation, which is also dependent on the β-glucan/dectin-1/CARD9 axis. Card9-deficient neutrophils show diminished glucose incorporation in candidiasis. Neutrophil-specific Glut1-ablated mice exhibit increased mortality in candidiasis caused by compromised neutrophil phagocytosis, reactive oxygen species (ROS), and neutrophil extracellular trap (NET) formation. In human neutrophils, β-glucan triggers metabolic remodeling and enhances candidacidal function. Our data show that the host-pathogen interface increases glycolytic activity in neutrophils by regulating Glut1 expression, localization, and function.

Keywords: Candida albicans; fungus; glucose; glucose transporter 1; immunometabolism; kidney; neutrophils.


Conflict of interest statement

Declaration of interests The authors declare no competing interests

Figures

Fig 1:
Fig 1:. Neutrophils upregulate Glut1 transcription and translocation during fungal stimulation.
(A) WT mice (C57BL/6) were infected with 105 CFU of C. albicans (C. a) for 24 h (n=4–5). Glucose uptake by kidney infiltrating neutrophils was detected by injecting 2-NBDG followed by flow cytometry. (B) BM neutrophils from WT mice were stimulated with C. a [multiplicity of infection (MOI)=0.2 (low) or 1 (high)] for 3 h. Gene expression of different glucose transporters was measured by qPCR, normalized to Gapdh. Neutrophils were stimulated with C. a for 3 h or 6 h. Glut1 and Glut3 protein were evaluated by (C) western blot and (D) flow cytometry. (E) WT mice were infected with C. a (n=4–6). Glut1 expression in kidney-infiltrating neutrophils was measured by flow cytometry at indicated days p.i. (F) Neutrophils were stimulated with C. a (MOI=1) and phosphorylation of Glut1 (pGlut1S226) was assessed by western blot. Phorbol 12-myristate 13-acetate (PMA) (100 ng/ml) was used as a positive control. (G) Neutrophils were stimulated with C. a (MOI=1) for 1.5 h. Surface localization of Glut1 in neutrophils was visualized by ImageStream analysis. The surface translocation of Glut1 was expressed as percentage of surface expressed (Ly6G co-localized) Glut1 out of total Glut1 protein. Data pooled from 2 (A and E) and 3–4 independent experiments (B-D, F and G) and representative images and histogram plots are shown. Statistical analysis by Student’s T test (A, G), One-way ANOVA (D, E) and Two-way ANOVA (B). Data are represented as mean ± SEM (A, B, D, E, F). See also Fig S1.
Fig 2:
Fig 2:. Fungal β-glucan and dectin-1 interaction controls Glut1 function in neutrophils.
(A) BM neutrophils from WT mice were stimulated with heat-killed C. albicans (C. a) [HKCa, MOI=1 (low) or 5 (high)], mannan [Man: 10 (low) or 100 μg/ml (high)], curdlan [Cur: (10 (low) or 100 μg/ml (high)], or zymosan [Zym: (10 (low) or 100 μg/ml (high)] for 3 h. Gene expression of Slc2a1 was measured by qPCR. (B) Neutrophils were stimulated with C. a (MOI=1), HKCa (MOI=1), mannan (100 μg/ml), curdlan (100 μg/ml) or zymosan (100 μg/ml) for 30 min and Glut1 phosphorylation was assessed by western blot. Neutrophils were stimulated with curdlan (100 μg/ml) for 1.5 h. (C) Localization of Glut1 in neutrophils was visualized by ImageStream analysis and (D) glucose uptake (2-NBDG+ cells) was detected by flow cytometry. (E) Neutrophils from WT or Dectin-1−/− mice were stimulated with C. albicans (MOI=0.2) or curdlan (10 μg/ml) for 3 h. Gene expression of Slc2a1 was measured by qPCR. (F) Neutrophils from WT or Dectin-1−/− mice were stimulated with C. a (MOI=1) or curdlan (100 μg/ml). Phosphorylation of Glut1 was assessed by western blot at 30 min post-stimulation. Data pooled from at least 3 independent experiments (A-F) and representative images and histogram plots are shown. Statistical analysis by One-way ANOVA (A), Student’s T test (C, D) and Two-way ANOVA (E). Data are represented as mean ± SEM (A, C, D, E). See also Fig S1.
Fig 3:
Fig 3:. Glut1 regulation is mediated by dectin-1/PKCδ pathway in neutrophils.
(A) Schematic diagram of downstream signaling pathways of dectin-1. The diagram also shows different inhibitors or gene knockout mice used to sequentially block the signaling intermediates in dectin-1 signaling pathway. (B) BM neutrophils from WT or Card9−/− mice were stimulated with C. albicans (C. a) (MOI=0.2) or curdlan (Cur) (10 μg/ml) for 3 h with or without indicated inhibitors. Gene expression of Slc2a1 was measured by qPCR. (C-F) BM neutrophils from WT or Card9−/− mice were stimulated with C. a (MOI=1) or curdlan (100 μg/ml) in the presence or absence of indicated inhibitors. Phosphorylation of Glut1 was assessed by western blot at 30 min post-stimulation. Data pooled from at least 3 independent experiments (B-F) and representative images are shown. Statistical analysis by Two-way ANOVA (B). Data are represented as mean ± SEM (B). See also Fig S2.
Fig 4:
Fig 4:. Increased glucose uptake in fungal stimulated neutrophils is mediated by Syk-PKCδ/CARD9/NFκB-axis.
BM neutrophils from WT or Card9−/− mice were stimulated with curdlan (Cur) (100 μg/ml) for 1.5 h in the presence or absence of indicated inhibitors. (A-D) Glut1 localization in neutrophils was visualized by ImageStream and (E-H) glucose uptake (2-NBDG+ cells) by neutrophils was detected by flow cytometry. (I) Neutrophils from WT or Card9−/− mice were stimulated with curdlan (100 μg/ml) for 6 h, and glucose uptake by neutrophils was detected by flow cytometry. WT and Card9−/− mice were infected with C. albicans (C. a) for 24 h (n=4–6). (J) Glucose uptake and (K) Glut1 protein level in kidney infiltrating neutrophils were detected by flow cytometry. (L) Glut1 localization in neutrophils was visualized by ImageStream. Data pooled from at least 2–3 independent experiments (A-L) and representative images and flow cytometry plots are shown. Statistical analysis by Two-way ANOVA. Data are represented as mean ± SEM (A-L). See also Fig S2, S3.
Fig 5:
Fig 5:. Glut1 deficiency suppresses glycolysis in neutrophils during fungal stimulation.
(A) Glut1 expression in mouse peripheral blood neutrophils was measured by flow cytometry. (B) Glut1 and Glut3 protein levels in BM neutrophils were measured by western blot. (C) The number of neutrophils in blood and spleen of 6–7 weeks old male mice was assessed by flow cytometry. (D) PMNWT and PMNΔGLUT1 mice were infected with C. albicans (C. a) for 24 h (n=4–6). Glucose uptake by kidney infiltrating neutrophils (GlucoseCy5+ cells) was detected by flow cytometry. (E-I) BM neutrophils from PMNWT or PMNΔGLUT1 mice were stimulated with curdlan (Cur) (10 μg/ml) for 3 h. Cell pellets were subjected to metabolomics by untargeted high-resolution LC-HRMS. Data pooled from at least 3 independent experiments (A-I) and representative images and flow cytometry plots are shown. Statistical analysis by Student’s T test (C) or Two-way ANOVA (D and I). Data are represented as mean ± SEM (C, D, I). See also Fig S4, S5.
Fig 6:
Fig 6:. Deficiency of Glut1 in neutrophils exacerbates susceptibility of mice to disseminated candidiasis.
PMNWT and PMNΔGLUT1 mice were infected with C. albicans (C. a). (A) Mice were evaluated for survival over a period of 14 days (n=12). (B) Kidney fungal burden (n=8) and (C) renal histopathology (PAS staining) was evaluated at day 3 p.i. Black arrows indicate C. a hyphae in renal parenchyma. Magnification: 20×10. PMNWT and PMNΔGLUT1 mice were sublingually inoculated with a cotton ball saturated in C. a for 75 min (n=8–14). (D) Mice body weight were monitored daily and (E) fungal burden of the tongue was evaluated at day 5 p.i. (F) BM neutrophils from PMNWT or PMNΔGLUT1 mice were incubated with C. a (MOI=0.2) for 3 h. Candidacidal capacity was assessed by in vitro fungal killing assay. (G) PMNWT and PMNΔGLUT1 mice were infected with 5 × 10⁶ CFU of Streptavidin-AF633+dTomato+ C. a. Mice were sacrificed 2 h p.i. and phagocytosis and intracellular killing by kidney-infiltrating neutrophils were measured by flow cytometry analysis. Live C. a engaged neutrophils emit two fluorescence signals (dTomato+AF633+) while dead C. a engaged neutrophils just emit only AF633 fluorescence signal (dTomatoAF633+). (H) Mice were infected with C. a for 24 h. ROS production in kidney infiltrating neutrophils were measured by CellROX® Deep Red reagent. (I) Neutrophils were incubated with C. a (MOI=0.2) for 3 h and NET formation was visualized by staining with Sytox Orange and anti-neutrophil elastase antibody. Black triangles indicate fungal hyphae. Magnification: 40×10. Frequency of NETosis score was blindly evaluated and expressed as arbitrary units. Data pooled from at least 2–3 independent experiments (A-I) and representative images and FACS plots are shown. Statistical analysis by log-rank test (A), Mann-Whitney test (B, E), Student’s T test (F, G) or Two-way ANOVA (H, I). Data are represented as geometric mean with geometric SD (B, E) or mean ± SEM (D, F, G, H, I). See also Fig S6, S7.
Fig 7:
Fig 7:. Glut1 is critical for fungicidal function of human neutrophils.
Healthy donor neutrophils (n=10) were stimulated with C. albicans (C. a) (MOI=0.2) for 3 h. (A) Gene expression of SLC2A1 was measured by qPCR. (B) Neutrophils isolated from healthy volunteers were stimulated with C. a (MOI=1) or curdlan (100 μg/ml) for 30 min. Glut1 phosphorylation was assessed by western blot. Representative image and ImageJ quantification of band intensities are shown. Healthy donor neutrophils were stimulated with C. a (MOI=1) in the presence or absence of Glut1 inhibitor (WZB117: 10 μM) for 1.5 h. (C) Glucose uptake by neutrophils was detected by flow cytometry, and (D) candidacidal activity of neutrophils was assessed by in vitro fungal killing assay. Statistical analysis by Student’s T test (A, D) and One-way ANOVA (B, C). Data are represented as mean ± SEM (A, B). See also Table S1.

Comment in

Similar articles

Cited by

References

    1. Abram CL, Roberge GL, Hu Y, and Lowell CA (2014). Comparative analysis of the efficiency and specificity of myeloid-Cre deleting strains using ROSA-EYFP reporter mice. J Immunol Methods 408, 89–100. - PMC - PubMed
    1. Ancey PB, Contat C, Boivin G, Sabatino S, Pascual J, Zangger N, Perentes JY, Peters S, Abel ED, Kirsch DG, et al. (2021). GLUT1 Expression in Tumor-Associated Neutrophils Promotes Lung Cancer Growth and Resistance to Radiotherapy. Cancer Res 81, 2345–2357. - PMC - PubMed
    1. Ardati KO, Bajakian KM, and Tabbara KS (1997). Effect of glucose-6-phosphate dehydrogenase deficiency on neutrophil function. Acta Haematol 97, 211–215. - PubMed
    1. Bao Y, Ledderose C, Graf AF, Brix B, Birsak T, Lee A, Zhang J, and Junger WG (2015). mTOR and differential activation of mitochondria orchestrate neutrophil chemotaxis. J Cell Biol 210, 1153–1164. - PMC - PubMed
    1. Bishu S, Hernandez-Santos N, Simpson-Abelson MR, Huppler AR, Conti HR, Ghilardi N, Mamo AJ, and Gaffen SL (2014). The adaptor CARD9 is required for adaptive but not innate immunity to oral mucosal Candida albicans infections. Infect Immun 82, 1173–1180. - PMC - PubMed