. 2022 Apr 5;34(4):516-532.e11.
doi: 10.1016/j.cmet.2022.02.015. Epub 2022 Mar 21.

The glucose transporter GLUT3 controls T helper 17 cell responses through glycolytic-epigenetic reprogramming

Affiliations

The glucose transporter GLUT3 controls T helper 17 cell responses through glycolytic-epigenetic reprogramming

Sophia M Hochrein et al. Cell Metab. .

Abstract

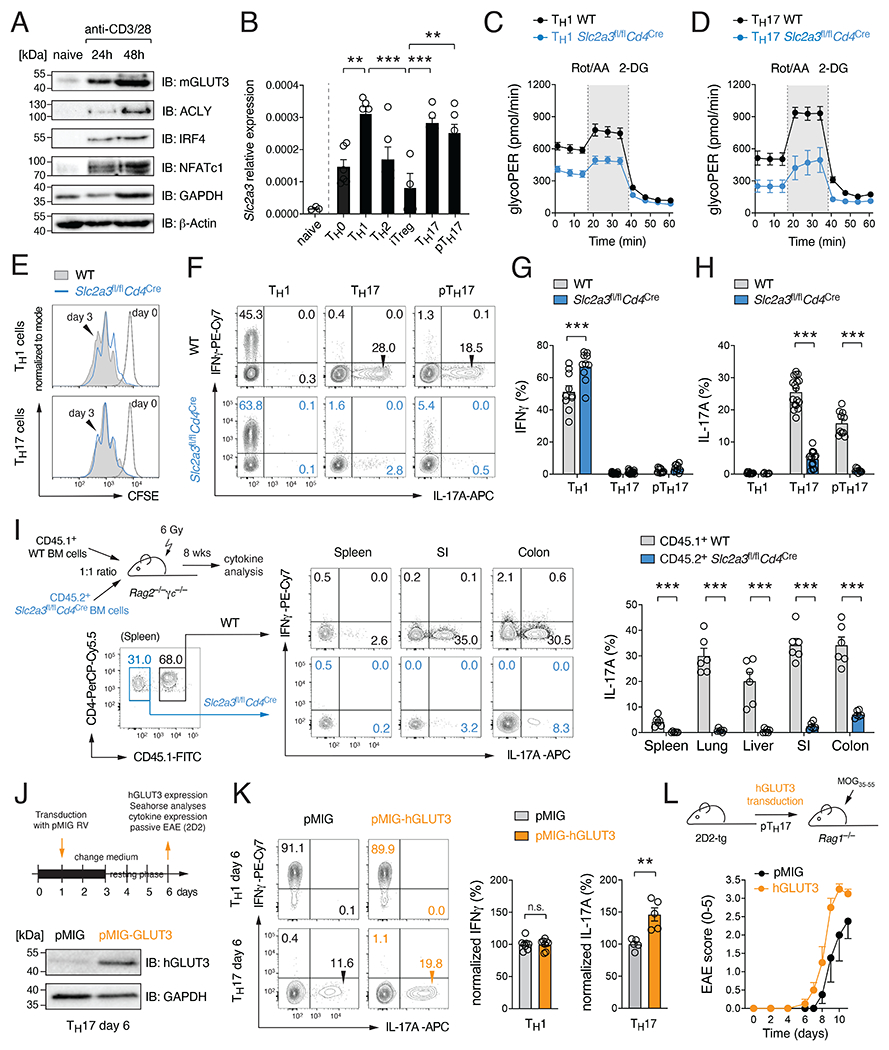
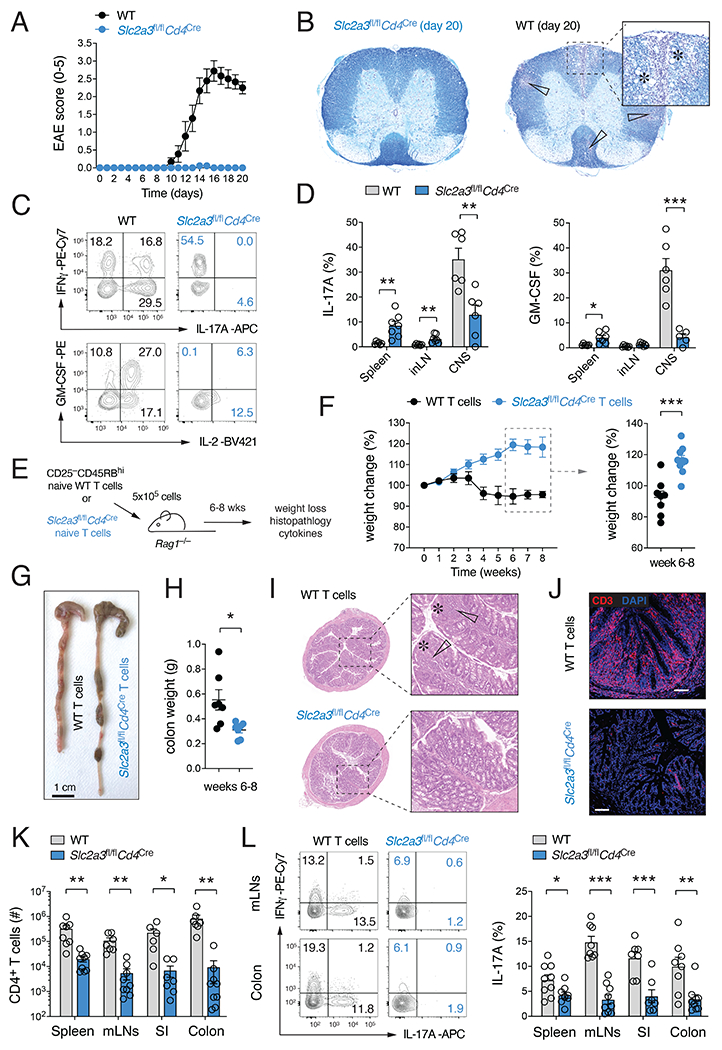
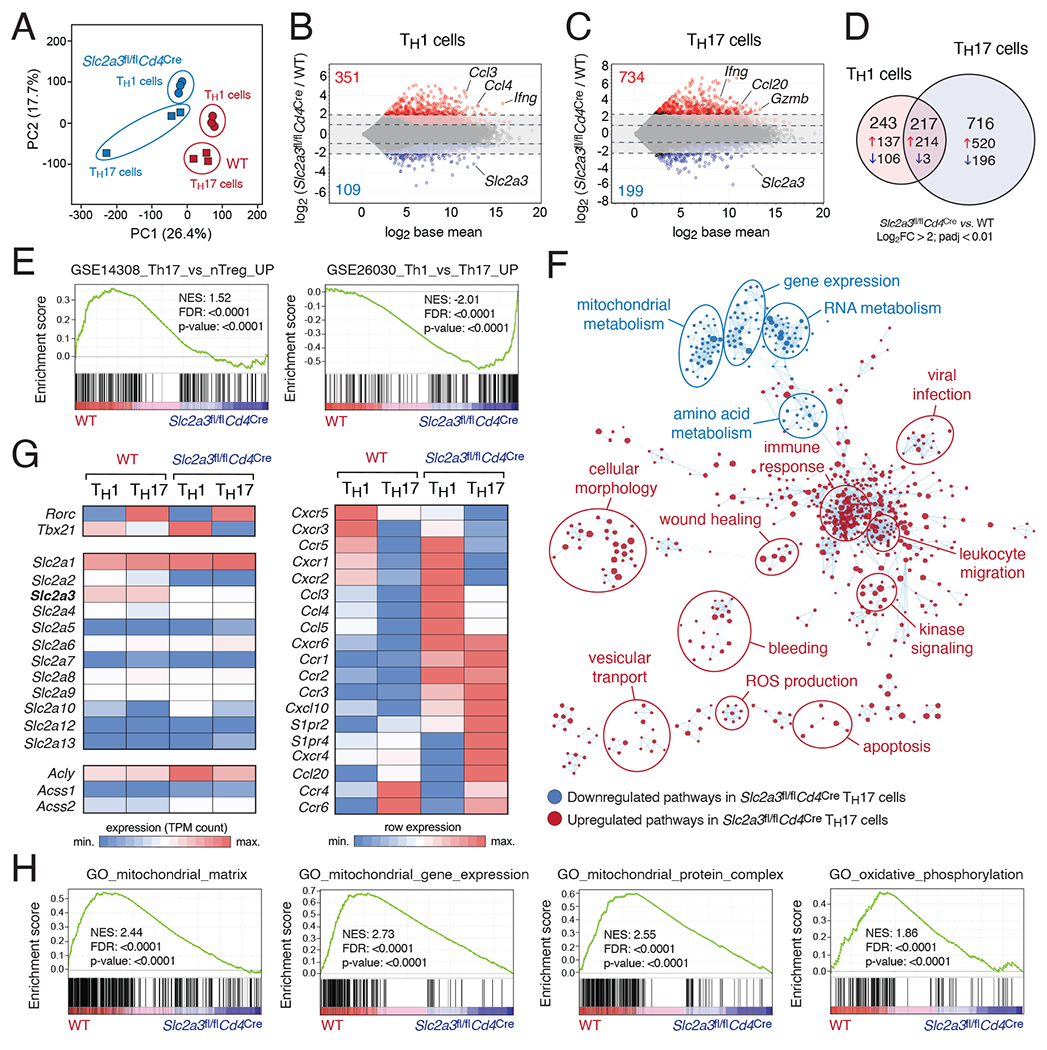
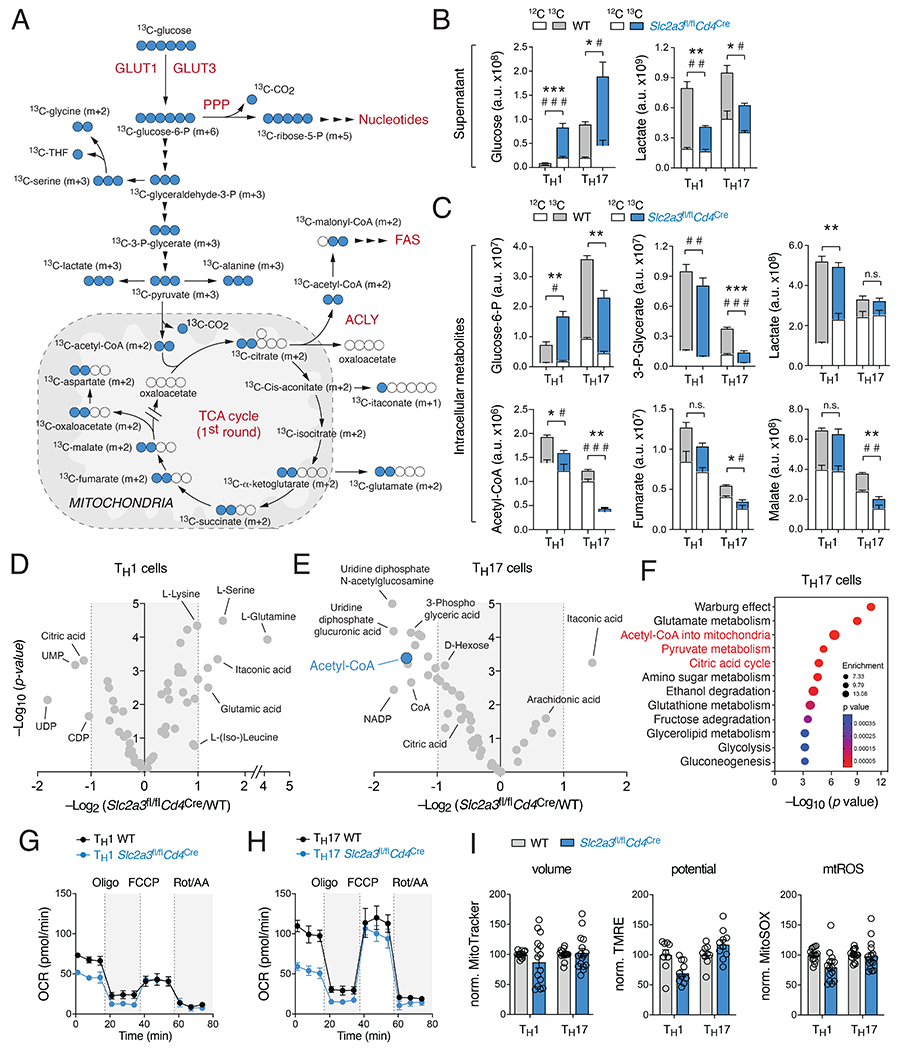
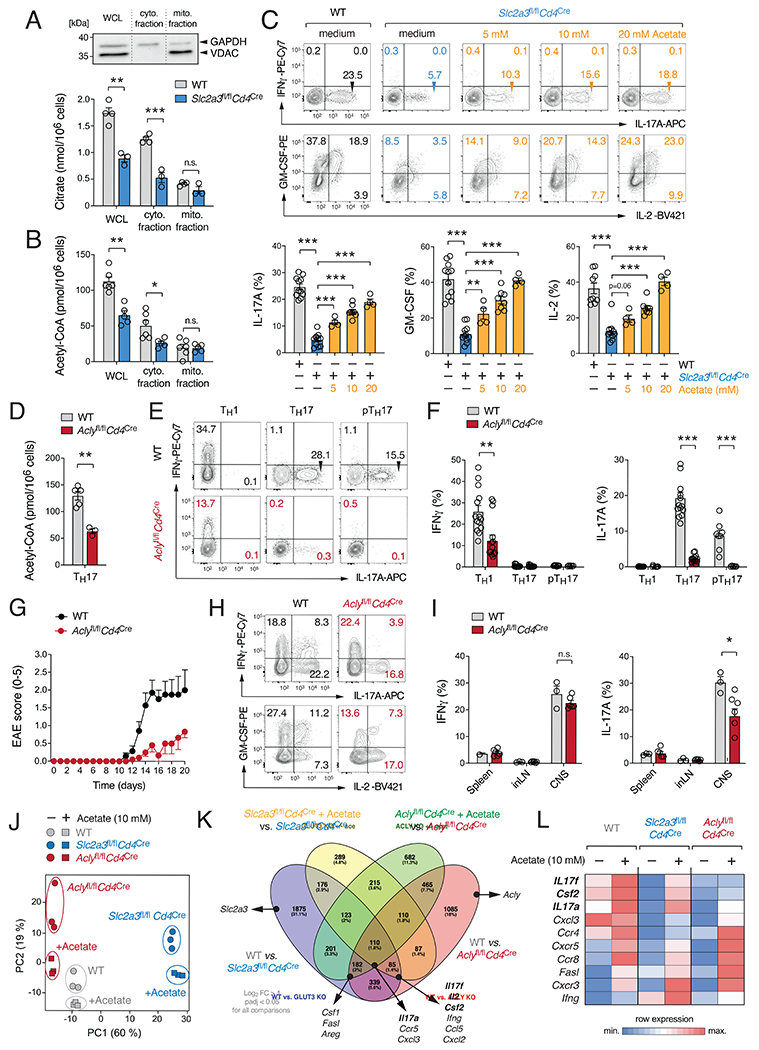
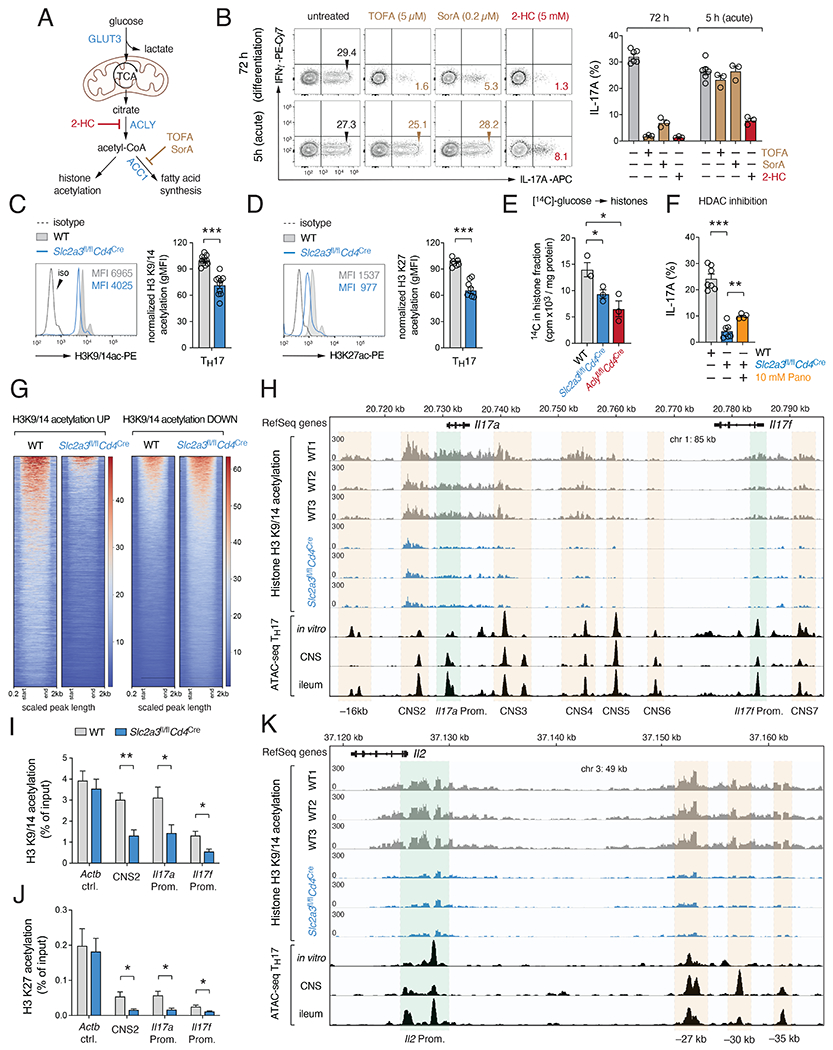
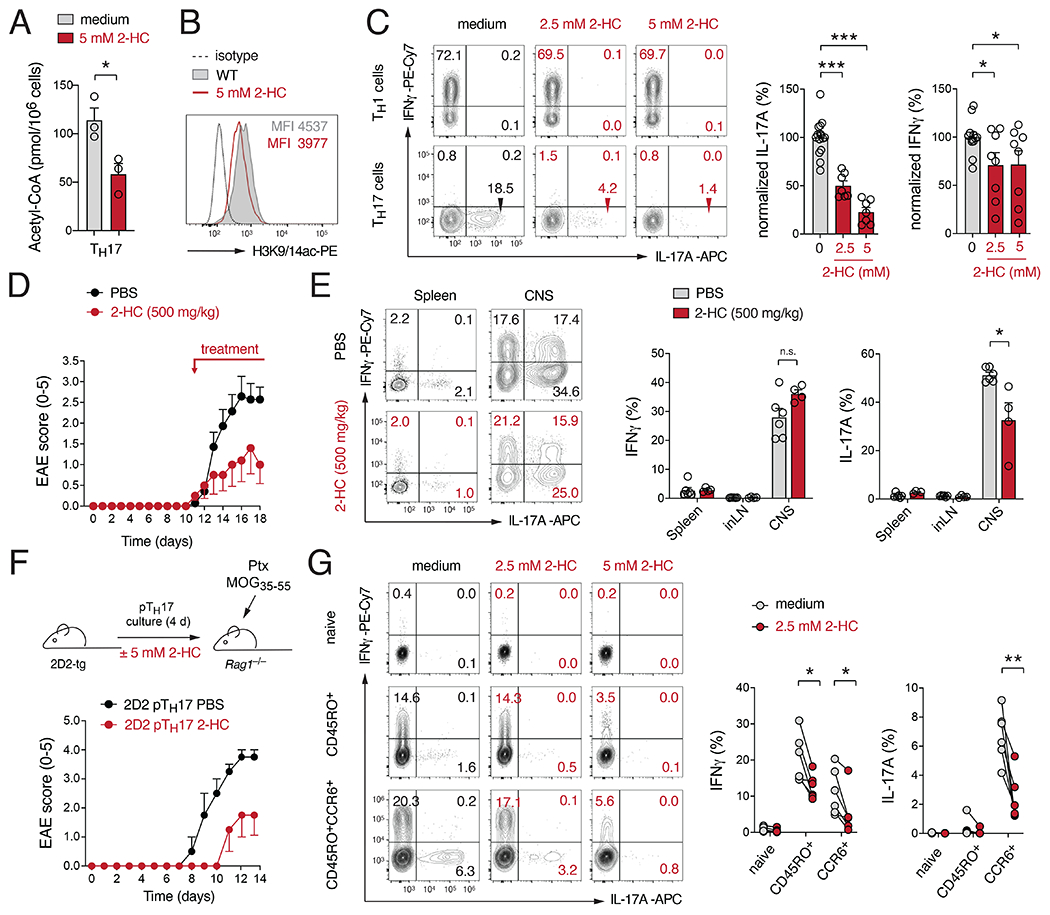
Metabolic reprogramming is a hallmark of activated T cells. The switch from oxidative phosphorylation to aerobic glycolysis provides energy and intermediary metabolites for the biosynthesis of macromolecules to support clonal expansion and effector function. Here, we show that glycolytic reprogramming additionally controls inflammatory gene expression via epigenetic remodeling. We found that the glucose transporter GLUT3 is essential for the effector functions of Th17 cells in models of autoimmune colitis and encephalomyelitis. At the molecular level, we show that GLUT3-dependent glucose uptake controls a metabolic-transcriptional circuit that regulates the pathogenicity of Th17 cells. Metabolomic, epigenetic, and transcriptomic analyses linked GLUT3 to mitochondrial glucose oxidation and ACLY-dependent acetyl-CoA generation as a rate-limiting step in the epigenetic regulation of inflammatory gene expression. Our findings are also important from a translational perspective because inhibiting GLUT3-dependent acetyl-CoA generation is a promising metabolic checkpoint to mitigate Th17-cell-mediated inflammatory diseases.

Keywords: ACLY; ATP-citrate lyase; GLUT1; GLUT3; Th17 cells; acetyl-CoA; glucose metabolism; glycolysis; histone acetylation; immunometabolism.


Conflict of interest statement

Declaration of interests The authors declare no competing interests.

Figures

Figure 1.
Figure 1.. GLUT3 is required for the effector function of Th17 cells.
(A) Immunoblot analysis of murine GLUT3, ACLY, IRF4, NFATc1 and GAPDH expression. (B) Analysis of Slc2a3 (GLUT3) gene expression in naïve CD4+ T cells and T helper (Th) cell subsets by qRT-PCR; means ± SEM of 5-6 mice. (C and D) Glycolytic proton efflux rate (glycoPER) analyses of WT and GLUT3-deficient Th1 (C) and Th17 (D) cells using a Seahorse extracellular flux analyzer; means ± SEM of 5 mice. (E) Proliferation analysis of WT and GLUT3-deficient Th1 and Th17 cells. (F-H) Flow cytometric analysis of IFNγ (G) and IL-17 (H) production of WT and GLUT3-deficient Th1, Th17 and pathogenic Th17 (pTh17) cells after re-stimulation with PMA/Iono for 5 h; means ± SEM of 9-15 mice. (I) Generation of mixed BM chimeras using BM from CD45.2+ Slc2a3fl/flCd4Cre and CD45.1+ WT mice at a 1:1 ratio. 8 weeks after reconstitution, the production of IFNγ and IL-17 in CD4+ T cells of WT and GLUT3-deficient BM origin was analyzed; means ± SEM of 6 mice. (J-L) Ectopic expression of GLUT3 in T cells augments Th17 cell effector function. (J) Retroviral transduction of WT T cells with GLUT3 or empty control vectors (EV). Immunoblot analysis of GLUT3 overexpression. (K) Flow cytometric analysis of IFNγ and IL-17 production of GLUT3-transduced Th1 and Th17 cells; means ± SEM of 5-8 mice. (L) Clinical EAE scoring of Rag1−/− mice after transfer of GLUT3-transduced 2D2 T cells; means ± SEM of 4 mice per cohort. **, p<0.01, ***, p<0.001 by unpaired Student’s t-test (B), (G-I) and (K); n.s., non-significant.
Figure 2.
Figure 2.. Ablation of GLUT3 in T cells prevents autoimmunity.
(A-D) Slc2a3fl/flCd4Cre mice are protected from experimental autoimmune encephalomyelitis (EAE). (A) Clinical EAE scores of WT and Slc2a3fl/flCd4Cre mice after immunization with MOG35-55 peptide emulsified in CFA; means ± SEM of 9 mice per cohort. (B) Representative histopathological examination of spinal cord sections of WT and Slc2a3fl/flCd4Cre mice 20 days after MOG35-55 peptide immunization. White arrows and asterisks indicate leukocytic infiltrates and areas of demyelination, respectively. (C and D) Frequencies of IL-17 and GM-CSF-producing CD4+ T cells in the spleen, inLNs and CNS of WT and Slc2a3fl/flCd4Cre mice; means ± SEM of 6-7 mice. (E-L) GLUT3-deficient T cells fail to induce adoptive transfer autoimmune colitis. (F) Weight loss of Rag1−/− host mice after transfer of naive CD4+ T cells from WT or Slc2a3fl/flCd4Cre mice; means ± SEM of 8-9 host mice. (G and H) Representative macroscopic pictures (G) and colon weights (H) 8 weeks after T cell transfer; means ± SEM of 6-7 recipient mice. (I and J) Representative H&E-stained colon sections (I) and anti-CD3 immunofluorescence analysis of inflammatory tissue damage and T cell infiltration (J). (K) T cell numbers in the spleen, mLNs, small intestine (SI) and colon in Rag1−/− recipient mice 6 to 8 weeks after transfer of T cells; means ± SEM of 6-9 host mice. (L) IFNγand IL-17 cytokine production of WT and GLUT3-deficient T cells in the spleen, mLNs, SI and colon 6-8 weeks after T cell transfer; means ± SEM of 7-9 mice. *, p<0.05; **, p<0.01, ***, p<0.001 by unpaired Student’s t-test (D), (F), (H) and (K,L).
Figure 3.
Figure 3.. GLUT3 controls a complex metabolic-transcriptional network in Th17 cells.
(A) Principal component (PC) analysis of WT and GLUT3-deficient (Slc2a3fl/flCd4Cre) Th1 and Th17 cell RNA-seq data; n=3 biological replicates per T cell subset and genotype. (B and C) MA plots of differentially expressed genes (DEGs) in WT versus GLUT3-deficient Th1 (B) and Th17 cells (C); genes significantly (padj < 0.01) up- and downregulated are depicted in red and blue, respectively. (D) Venn diagram analyses of > 4-fold DEGs (padj < 0.01) of GLUT3-deficient Th1 and Th17 cells. (E) Gene set enrichment analysis (GSEA) of WT versus GLUT3-deficient Th17 cells. (F) Network clustering of significantly (p < 0.005) enriched gene expression signatures to identify dysregulated physiological processes in GLUT3-deficient Th17 cells. Down- and upregulated gene sets in GLUT3-deficient Th17 cells compared to WT are shown in blue and red, respectively. (G) Heatmap analysis of selected genes in GLUT3-deficient and WT Th1 and Th17 cells. (H) GSEAs of WT versus GLUT3-deficient Th17 cells highlight impaired mitochondrial gene expression and function.
Figure 4.
Figure 4.. GLUT3 supports mitochondrial acetyl-CoA generation.
(A) Isotope tracing of glucose-derived metabolites in WT and GLUT3-deficient T cells by liquid chromatography and mass spectrometry (LC/MS). (B) Analysis of 13C-labelled glucose and lactate levels in cell culture supernatants of WT and GLUT3-deficient Th1 and Th17 cells by LC/MS. Asterisks and hash signs indicate significant differences in 13C and 12C-metabolites, respectively. (C) Fractional enrichment of 13C-glucose-derived glycolytic and TCA cycle intracellular metabolites in WT and GLUT3-deficient Th1 and Th17 cells; means ± SEM of 4 biological replicates. (D and E) Volcano plots of differential metabolite concentrations between WT and GLUT3-deficient Th1 (D) and Th17 (E) cells; 4 biological replicates per group. (F) Metabolite set enrichment analysis (MSEA) of differential metabolite concentrations (p < 0.05) between WT and GLUT3-deficient Th17 cells. (G and H) Oxygen consumption rate (OCR) measurements of WT and GLUT3-deficient Th1 (G) and Th17 cells (H) using a Seahorse extracellular flux analyzer; means ± SEM of 5 mice. (I) Analysis of mitochondrial volume (MitoTracker), membrane potential (TMRE) and mitochondrial ROS production (MitoSOX) in WT and GLUT3-deficient T cells; means ± SEM of 10-17 mice. *, p<0.05; ***, p<0.001 by unpaired Student’s t-test (B and C).
Figure 5.
Figure 5.. ACLY controls acetyl-CoA production and Th17 cell effector function.
(A and B) Analysis of subcellular citrate (A) and acetyl-CoA (B) in whole cell lysates (WCL) and isolated cytosolic and mitochondrial fractions; means ± SEM of 5-6 mice. Immunoblot analysis of cytosolic (GAPDH) and mitochondrial (VDAC) proteins. (C) Exogenous acetate rescues impaired cytokine production of GLUT3-deficient Th17 cells. Flow cytometric analyses of IFNγ, IL-17, IL-2 and GM-CSF expression of WT and Slc2a3fl/flCd4Cre Th17 cells treated with acetate; means ± SEM of 4-11 mice. (D-I) ACLY controls Th17 cell effector function. (D) Quantification of acetyl-CoA in WCL of WT and Aclyfl/flCd4Cre Th17 cells; means ± SEM of 3-5 mice. (E and F) Flow cytometric analysis of IFNγ and IL-17 production by WT and ACLY-deficient (Aclyfl/flCd4Cre) T cells; means ± SEM of 6-14 mice. (G–I) Inactivation of ACLY in T cells prevents autoimmune encephalomyelitis. (G) Clinical EAE scores of WT and Aclyfl/flCd4Cre mice after MOG35-55 immunization; means ± SEM of 7-10 mice per cohort. (H and I) Flow cytometric analyses of IFNγ and IL-17 production of CD4+ T cells from WT and Aclyfl/flCd4Cre mice; means ± SEM of 3-6 mice. (J-L) Global gene expression analysis of WT, GLUT3-deficient (Slc2a3fl/flCd4Cre) and ACLY-deficient (Aclyfl/flCd4Cre) Th17 cells in the presence and absence of acetate. (J) Principal component (PC) analysis of WT, GLUT3-deficient and ACLY-deficient Th17 cell gene expression data. (K) Venn diagram analyses comparing GLUT3-deficient, ACLY-deficient and WT Th17 cells in the presence or absence of 10 mM acetate; > 2-fold expression change and padj < 0.05. (L) Heatmap analysis of selected gene expression in WT, GLUT3- and ACLY-deficient Th17 cells. *, p<0.05; **, p<0.01, ***, p<0.001 by unpaired Student’s t-test (A-D), (F) and (I).
Figure 6.
Figure 6.. GLUT3-dependent histone acetylation promotes Th17 cell effector function.
(A) Effects of 2-Hydroxycitrate (2-HC), Soraphen A (SorA) or 5-Tetradecyloxy-2-furonic acid (TOFA) to inhibit ATP-citrate lyase (ACLY), acetyl-CoA carboxylases (ACC1/2) or fatty acid synthase (FAS), respectively. (B) Analysis of IL-17 expression in Th17 cells treated with 2-HC, SorA or TOFA during differentiation (72 h) or re-stimulation (5 h). (C-J) GLUT3-dependent acetyl-CoA controls the epigenetic re-programming of Th17 cells. (C and D) Analysis of global histone 3 (H3) acetylation at lysins K9/14 (C) and K27 (D) in WT and GLUT3-deficient Th17 cells; means ± SEM of 5=9 mice. (E) Glucose-derived incorporation of [14C] carbons into histones of WT, GLUT3- and ACLY-deficient Th17 cells; means ± SEM of 3 mice. (F) Analysis of IL-17 expression in GLUT3-deficient Th17 cells treated with 10 mM Panobinostat for 24 h; means ± SEM of 4-7 mice. (G-K) Genome-wide analysis of H3 K9/14 acetylation in WT and GLUT3-deficient Th17 cells by chromatin immunoprecipitation followed by DNA-sequencing (ChIP-seq). (G) Heatmaps using depth-normalized coverages of global K9/14 histone acetylation of WT and GLUT3-deficient Th17 cells relative to input samples. (H) Analysis of H3 K9/14 acetylation at the Il17a and Il17f gene cluster in WT and GLUT3-deficient Th17. Promoters (green shading), enhancers and other conserved noncoding regions (CNS, orange shading) were determined using ATAC-seq datasets of Th17 cells (Qiu et al., 2020). (I and J) Quantification of K9/14 (I) and K27 (J) acetylation in WT and GLUT3-deficient Th17 cells at the CNS-2, Il17a and Il17f promoter using ChIP-qPCR; n=5-6 mice. (K) Analysis of H3 K9/14 acetylation at the Il2 locus in WT and GLUT3-deficient Th17 cells. *, p<0.05; **, p<0.01, ***, p<0.001 by unpaired Student’s t-test (C-F), (I) and (J).
Figure 7.
Figure 7.. Pharmacological inhibition of ACLY ameliorates autoimmunity.
(A) Quantification of acetyl-CoA levels in Th17 cells treated with 5 mM 2-hydroxycitrate (2-HC) for 24 h; means ± SEM of 3 mice. (B) Analysis of global histone H3 acetylation at lysins K9/14 in Th17 cells treated with 5 mM 2-HC for 24 h. (C) Analysis of IFNγ and IL-17 expression in T cells after treatment with 2-HC for 24 h; means ± SEM of 7-15 mice. (D) Clinical EAE scores of WT mice immunized with MOG35-55 peptide and treated therapeutically with 500 mg/kg 2-HC; means ± SEM of 5-6 mice per cohort. (E) Flow cytometric analysis of IL-17 and IFNγ production in T cells isolated from mice treated with or without 2-HC; means ± SEM of 4-6 mice. (F) Transfer of in vitro differentiated 2D2 Th17 cells into Rag1−/− recipient mice with and without 2-HC treatment. Clinical EAE scores are means ± SEM of 2-4 mice. (G) 2-HC inhibits cytokine production of human CD4+ T cells. Flow cytometric analysis of IFNγ and IL-17 expression in naïve, CD45RO+ and CD45RO+CCR6+ memory CD4+ T cell subsets from healthy donors after stimulation with PMA/Iono in presence or absence of 2-HC; n=6 donors. *, p<0.05; **, p<0.01, ***, p<0.001 by unpaired Student’s t-test (A), (C), (E) and (G).

Comment in

References

    1. Akimzhanov AM, Yang XO, and Dong C (2007). Chromatin remodeling of interleukin-17 (IL-17)-IL-17F cytokine gene locus during inflammatory helper T cell differentiation. J Biol Chem 282, 5969–5972. - PubMed
    1. Alwarawrah Y, Kiernan K, and MacIver NJ (2018). Changes in Nutritional Status Impact Immune Cell Metabolism and Function. Front Immunol 9, 1055. - PMC - PubMed
    1. Bailis W, Shyer JA, Zhao J, Canaveras JCG, Al Khazal FJ, Qu R, Steach HR, Bielecki P, Khan O, Jackson R, et al. (2019). Distinct modes of mitochondrial metabolism uncouple T cell differentiation and function. Nature 571, 403–407. - PMC - PubMed
    1. Beckermann KE, Hongo R, Ye X, Young K, Carbonell K, Healey DCC, Siska PJ, Barone S, Roe CE, Smith CC, et al. (2020). CD28 costimulation drives tumor-infiltrating T cell glycolysis to promote inflammation. JCI Insight 5. - PMC - PubMed
    1. Berod L, Friedrich C, Nandan A, Freitag J, Hagemann S, Harmrolfs K, Sandouk A, Hesse C, Castro CN, Bahre H, et al. (2014). De novo fatty acid synthesis controls the fate between regulatory T and T helper 17 cells. Nat Med 20, 1327–1333. - PubMed

Publication types

MeSH terms