. 2022 Jul 21;29(7):1174-1186.e7.
doi: 10.1016/j.chembiol.2022.03.001. Epub 2022 Mar 21.

A phospholipid mimetic targeting LRH-1 ameliorates colitis

Affiliations

A phospholipid mimetic targeting LRH-1 ameliorates colitis

Suzanne G Mays et al. Cell Chem Biol. .

Abstract

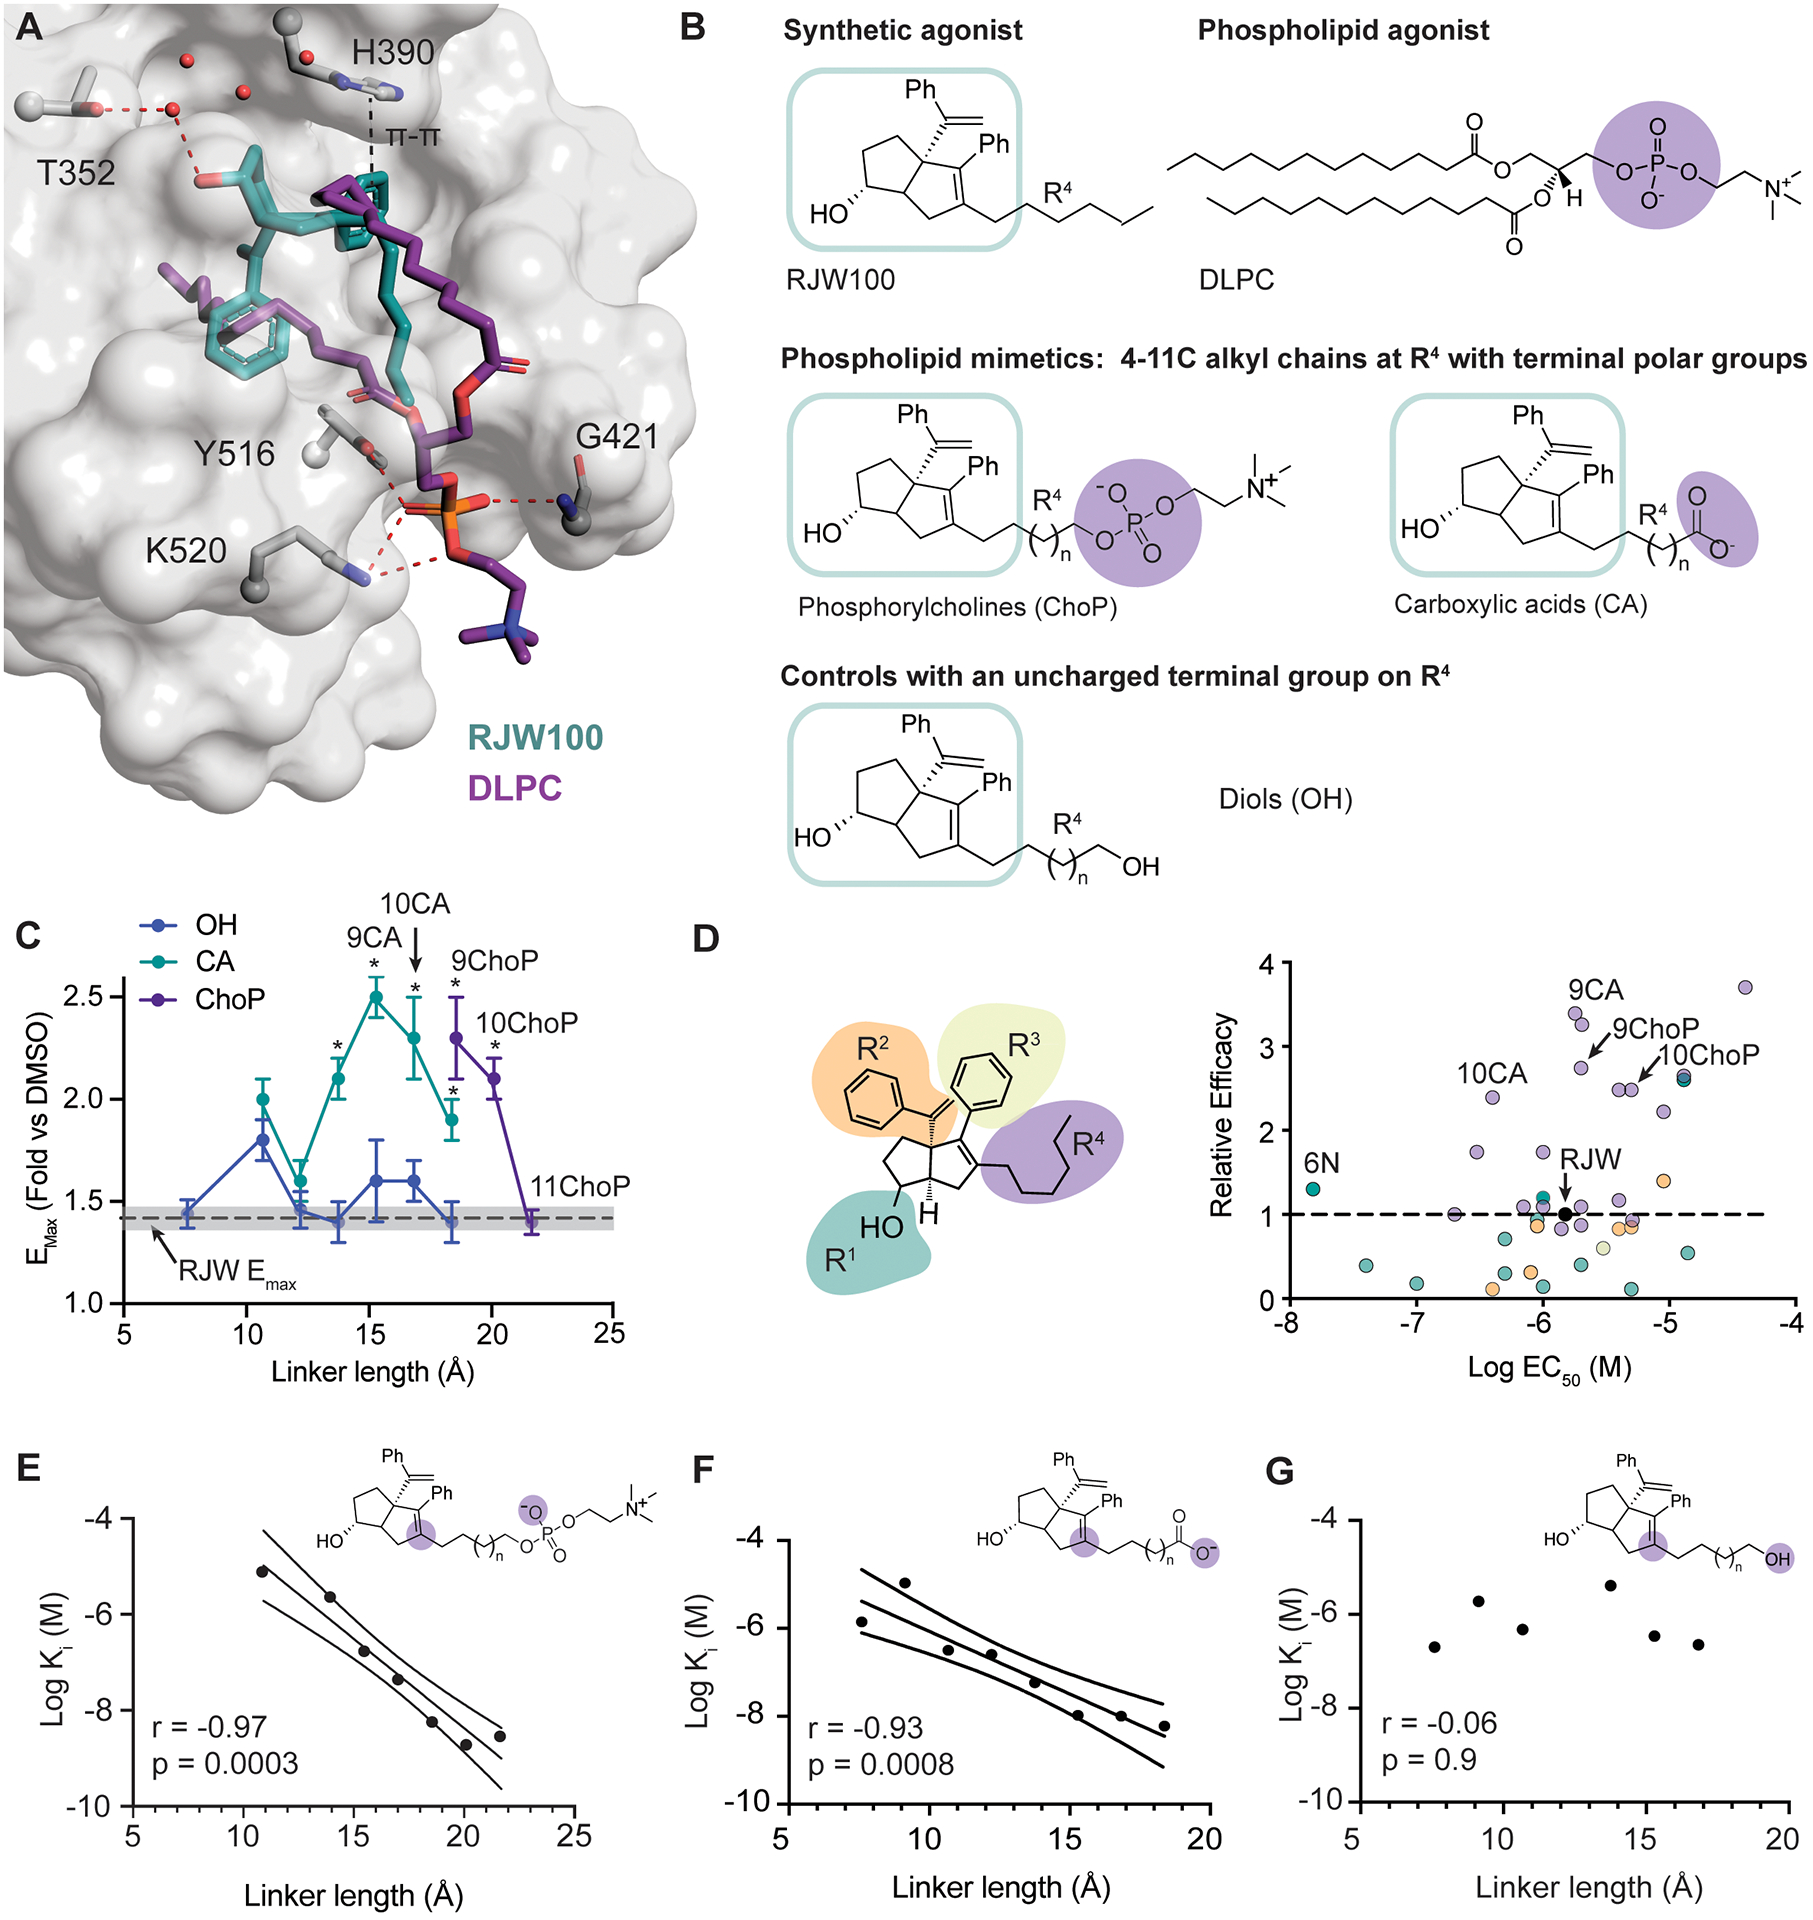
Phospholipids are ligands for nuclear hormone receptors (NRs) that regulate transcriptional programs relevant to normal physiology and disease. Here, we demonstrate that mimicking phospholipid-NR interactions is a robust strategy to improve agonists of liver receptor homolog-1 (LRH-1), a therapeutic target for colitis. Conventional LRH-1 modulators only partially occupy the binding pocket, leaving vacant a region important for phospholipid binding and allostery. Therefore, we constructed a set of molecules with elements of natural phospholipids appended to a synthetic LRH-1 agonist. We show that the phospholipid-mimicking groups interact with the targeted residues in crystal structures and improve binding affinity, LRH-1 transcriptional activity, and conformational changes at a key allosteric site. The best phospholipid mimetic markedly improves colonic histopathology and disease-related weight loss in a murine T cell transfer model of colitis. This evidence of in vivo efficacy for an LRH-1 modulator in colitis represents a leap forward in agonist development.

Keywords: LRH-1; agonist; coregulator; liver; nuclear receptor; phospholipid; ulcerative colitis; x-ray crystallography.


Conflict of interest statement

Declaration of interests E.A.O., S.G.M., A.R.F., and N.T.J. have a patent related to this work.

Figures

Figure 1.
Figure 1.. Design, binding, and activity of PL-mimetics.
A. LRH-1 ligand binding pocket (LBP) from PDB 5L11, showing the binding modes of synthetic agonist RJW100 (teal sticks) and phospholipid agonist DLPC (PDB 4DOS, purple sticks). Key interactions made by each agonist are highlighted. B. Top, Chemical structures of the LRH-1 agonists RJW100 and DLPC. The unmodified portion of RJW100 is highlighted in a teal box, and the PL headgroup of DPLC is highlighted in purple. These elements were combined to make the PL mimics through modification at position R4. Middle, Structures of PL-mimics. ChoP or CA isosteres were conjugated to the RJW100 core via alkyl linkers of 4–11 carbons (Flynn et al., 2018). Bottom, Diols with alkyl linkers of 4–11 carbons were synthesized for comparison with PL mimics. C. Plot of Emax values from luciferase reporter assays as a function of linker length. Each point represents the mean +/− SEM from 2–3 experiments. Compounds that did not activate sufficiently for Emax calculation are omitted. Dotted line is the mean Emax of RJW100; grey shading indicates SEM. *, p< 0.05 versus RJW100 by two-way ANOVA followed by Sidak’s multiple comparisons test. D. Right, Activity profiles of the PL-mimics versus related LRH-1 agonists. Left, RJW100 chemical structure, showing the color scheme for the dots in the plot (colored according to the site of modification). Relative efficacy is Emax relative to RJW100, calculated as described in Methods. E-G. Binding affinity (Ki) plotted as a function of linker length for ChoPs (E), CAs (F), and diols (G). Lower insets, Pearson correlation coefficients (r) and p-values. Upper insets, illustration of the portion of R4 used to measure linker length (distance between the two purple spheres).
Figure 2.
Figure 2.. Phospholipid mimetics make PL-like interactions in the LRH-1 binding pocket important for binding and activation.
A-B. Crystal structures of LRH-1 LBD with (A) 10CA (PDB: 7JYD) or (B) 9ChoP (PDB: 7JYE) and a fragment of the Tif2 coregulator. H, helix. In A, the AFS (parts of helices 3, 4, and the AF-H) is highlighted in light blue. C. Electron density surrounding 10CA (top) and 9ChoP (bottom). Maps are omit Fo-Fc, contoured at 2 . D. Superposition of three ligands from LRH-1 structures: 10CA (cyan sticks), 9ChoP (purple sticks), or DLPC (dark blue sticks, from PBD 4DOS). 10CA and DLPC protein backbones are shown as grey and light blue cartoons, respectively. E-F. Close-up of the interactions made by the terminal polar groups of 10CA (E) and 9ChoP (F). Hydrogen bonds are shown as red dotted lines; water molecule as a red sphere. G. Effects of K520A or Y516A mutations on binding affinity. Each bar represents the mean +/− 95% CI from two experiments conducted in quadruplicate. *, p < 0.05 by two-way ANOVA followed by Dunnett’s test for multiple comparisons. H. Fold changes in Ki for mutant versus WT LRH-1. Grey shading indicates effects of the mutations on RJW100 and 6N binding, which do not contact the mutated residues. I. Luciferase reporter assays with LRH-1 containing K520A or Y516A mutations. The A349F mutation occludes the pocket and was a negative control. Cells were treated with 30 μM of each compound for 24 hours prior to measurement of luciferase signal. *, p < 0.05 versus WT LRH-1 treated with each agonist; (two-way ANOVA followed by Dunnett’s test for multiple comparisons).
Figure 3.
Figure 3.. Longer-tailed PL mimetics stabilize the AFS and alter coregulator binding.
A. Plots of deuterium uptake over time from HDX-MS experiments at sites in the LRH-1 AFS. Each point represents the mean +/− SD for three replicates. Slower deuterium exchange indicates greater stability. *, p < 0.05. versus 4CA by two-way ANOVA followed by Holm-Sidak’s test for multiple comparisons. B-C. Differences in deuterium uptake for 10CA-LRH-1 (B) and LRH-1–9CA (C) versus LRH-1–4CA mapped to the structure. Blue circles, AFS. Scale bar indicates the degree of stabilization (teal and blue) or destabilization (yellow) by 9CA or 10CA. Black, unmapped regions. H, helix. D. Heatmap and corresponding raw traces showing log fold change (LFC) coregulator binding relative to apo-LRH-1-LBD. E-G. Upset plots showing overlaps in coregulator binding events affected by at least 1.5-fold. Horizontal bars represent the number of events in each set, and vertical bars indicate numbers of events that overlap in between the groups that have filled-in circles below them. For example, the first vertical bar in E shows that a set of 16 coregulator peptides dissociate from LRH-1 in the presence of 9CA and 10CA that are not affected by 6N and 6Na. G. Upset plot comparing overlap in coregulator recruitment events by 10CA bound to full-length LRH-1 (FL) or LRH-1 LBD. Red bars indicate coregulators that associated to the 10CA-LRH-1 complex, and purple bars indicate coregulator dissociation. H. Upset plot highlighting an opposite recruitment pattern by compounds 10CA and 6N bound to FL-LRH-1.
Figure 4.
Figure 4.. 10CA activates LRH-1 in hepatocytes and in the liver.
A. qRT-PCR analysis of LRH-1 targets in Huh7 hepatocytes. Cells were treated for 24 hours with 10CA concentrations indicated in the x-axes. Each bar represents the mean fold change versus DMSO-treated cells, with individual data points shown. Error bars are standard deviation for 2–3 replicates. Data are normalized to TBP. *, p < 0.05; **, p < 0.01; ***, p < 0.001; ****, p < 0.0001 by one-way ANOVA followed by Dunnett’s multiple comparisons test. B. Schematic of the experimental design for the mouse study. Mice were injected with AAV8-hLRH-1 intravenously to induce human LRH-1 expression, then after two weeks were treated with five doses of 10CA over three days. C. Liver tissue from mice was isolated and analyzed by qRT-PCR to measure levels of human LRH-1. D. Heatmap of Nanostring results in mice expressing AAV8-hLRH-1 and treated with vehicle, 0.1, 1.0, or 10.0 mg/ kg 10CA. The log2 fold changes (LFC) versus vehicle-treated mice are shown. E. Individual bar graphs from Nanostring showing downregulation of lipogenic genes in mice receiving AAV8-hLRH-1 but not in control (CTRL) mice. *, p < 0.05, **p, 0.01, by two-way ANOVA followed by Benjamini-Yekutieli False Discovery Rate (FDR) method, using an FDR threshold of 0.05.
Figure 5.
Figure 5.. Efficacy of 10CA in models of intestinal inflammation and colitis.
A. Gene expression changes in enteroids treated with 10CA, measured by qRT-PCR (n = 3). Bars represent the mean, error bars are standard deviation, and individual points are shown from three replicates. Bars labeled “hLRH-1” denote enteroids expressing human LRH-1 in animals where mouse Lrh-1 was conditionally deleted in the intestinal epithelium. Bars labeled “Ctrl” denote enteroids from epithelial-specific Lrh-1 knockout mice *, p < 0.05 by two-way ANOVA followed by Sidak’s multiple comparisons test. B. Plot of weight changes of mice over the course of treatment in TCT experiment. Mice (n = 5) were treated six days a week with vehicle (CTRL) or 10CA (20 mg/ kg). Each point represents the mean +/− SEM from five mice per group. *, p< 0.05 (two-way ANOVA followed by the Bonferroni test for multiple comparisons). C. Histology scores were calculated as described in the methods section and Table S3. Each bar represents the mean, error bars are SD, and individual values are shown as points. D-E. Representative colon sections stained with H&E show reduced intestinal damage with 10CA treatment (E) compared to vehicle (D) Scale bars are 100 nm. F. qRT-PCR from of LRH-1 transcriptional targets in colonic crypts of mice from the TCT experiment. Each bar represents the mean, error bars are SD, and individual values are shown as points. *, p < 0.05, **, p < 0.01, ***, p < 0.001 relative to vehicle-treated organoids or mice by two-tailed, unpaired Student’s t-test.

Similar articles

Cited by

References

    1. Aarts JM, Wang S, Houtman R, van Beuningen RM, Westerink WM, Van De Waart BJ, Rietjens IM, and Bovee TF (2013). Robust array-based coregulator binding assay predicting ERalpha-agonist potency and generating binding profiles reflecting ligand structure. Chem Res Toxicol 26, 336–346. - PubMed
    1. Adams PD, Afonine PV, Bunkoczi G, Chen VB, Davis IW, Echols N, Headd JJ, Hung LW, Kapral GJ, Grosse-Kunstleve RW, et al. (2010). PHENIX: a comprehensive Python-based system for macromolecular structure solution. Acta Crystallogr D Biol Crystallogr 66, 213–221. - PMC - PubMed
    1. Basak O, Beumer J, Wiebrands K, Seno H, van Oudenaarden A, and Clevers H (2017). Induced Quiescence of Lgr5+ Stem Cells in Intestinal Organoids Enables Differentiation of Hormone-Producing Enteroendocrine Cells. Cell Stem Cell 20, 177–190 e174. - PubMed
    1. Bayrer JR, Wang H, Nattiv R, Suzawa M, Escusa HS, Fletterick RJ, Klein OD, Moore DD, and Ingraham HA (2018). LRH-1 mitigates intestinal inflammatory disease by maintaining epithelial homeostasis and cell survival. Nat Commun 9, 4055. - PMC - PubMed
    1. Bouguen G, Langlois A, Djouina M, Branche J, Koriche D, Dewaeles E, Mongy A, Auwerx J, Colombel JF, Desreumaux P, et al. (2015). Intestinal steroidogenesis controls PPARgamma expression in the colon and is impaired during ulcerative colitis. Gut 64, 901–910. - PubMed

Publication types