

Dynamic profiling of immune microenvironment during pancreatic cancer development suggests early intervention and combination strategy of immunotherapy
- PMID: 35316682
- PMCID: PMC8943259
- DOI: 10.1016/j.ebiom.2022.103958
Dynamic profiling of immune microenvironment during pancreatic cancer development suggests early intervention and combination strategy of immunotherapy
Abstract
Background: Pancreatic ductal adenocarcinoma (PDAC) has little response to immune checkpoint inhibitors. An in-depth understanding of the immune microenvironment from a comprehensive and dynamic perspective is critical to generate effective therapeutic strategies for PDAC.
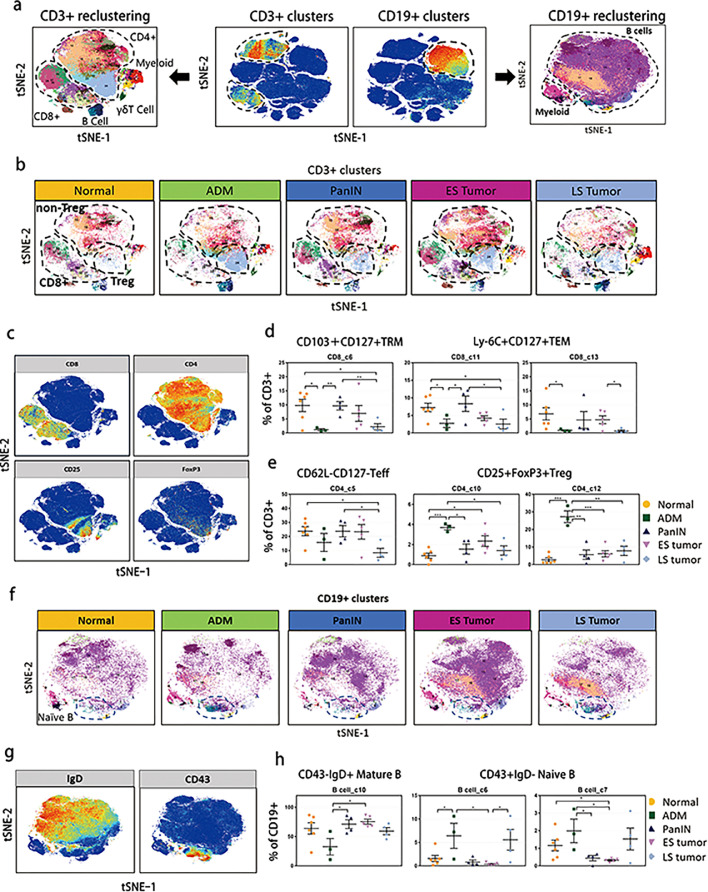
Methods: Using mass cytometry and immunohistochemistry, we explored the dynamic changes of tumor-infiltrating immune cells during the development of PDAC in a genetically engineered mouse model (KrasG12D/+; Trp53R172H/+; Pdx1-cre) and human specimens. PD-L1-/- mice were crossed with KrasG12D/+; TgfβR2flox/flox; Ptf1a-cre mice to achieve early depletion of PD-L1 in pancreatic cancer. Combination therapy of Arginase-1 (Arg-1) inhibitor and anti-PD-1 mAb was validated in syngeneic mouse models.
Findings: Two different stages of immunosuppression with unique features were observed in both mouse model and human specimens. Early stage of immunosuppression featured highly abundant Tregs during acinar-to-ductal metaplasia, despite of a prominent and continuous presence of effector lymphocytes. The differentiation/activation branch of Ly-6C+ monocytes changed from a BST2+/MHC-II+ phenotype to an Arg-1+ phenotype over time during PDAC development. The late stage of immunosuppression thus featured the presence of a large number of myeloid suppressive cells together with a significant reduction of effector lymphocytes. Removal of PD-L1 from the beginning efficiently triggered anti-tumor immunity and significantly prolonged survival in PDAC-developing mice. Targeting Arg1+ macrophages with an Arg-1 inhibitor synergized with anti-PD-1 immunotherapy and led to PDAC-specific immune memory.
Interpretation: By demonstrating the coevolution of histopathology and immunology in PDAC, this study highlights the necessity and value of early intervention and combinational approach in leveraging immunotherapy to treat pancreatic cancer.
Funding: A full list of funding bodies that contributed to this study can be found in the Acknowledgements section.
Keywords: Immunotherapy; Mass cytometry; Pancreatic ductal adenocarcinoma; Tumor microenvironment; Tumor-infiltrating immune cells.
Copyright © 2022 The Authors. Published by Elsevier B.V. All rights reserved.
Conflict of interest statement
Declaration of interests The authors declare no potential conflicts of interest.
Figures


Similar articles
-
Combination cancer immunotherapy targeting TNFR2 and PD-1/PD-L1 signaling reduces immunosuppressive effects in the microenvironment of pancreatic tumors.J Immunother Cancer. 2022 Mar;10(3):e003982. doi: 10.1136/jitc-2021-003982. J Immunother Cancer. 2022. PMID: 35260434 Free PMC article.
-
IL-6 and PD-L1 antibody blockade combination therapy reduces tumour progression in murine models of pancreatic cancer.Gut. 2018 Feb;67(2):320-332. doi: 10.1136/gutjnl-2016-311585. Epub 2016 Oct 21. Gut. 2018. PMID: 27797936 Free PMC article.
-
Single-cell RNA sequencing reveals compartmental remodeling of tumor-infiltrating immune cells induced by anti-CD47 targeting in pancreatic cancer.J Hematol Oncol. 2019 Nov 27;12(1):124. doi: 10.1186/s13045-019-0822-6. J Hematol Oncol. 2019. PMID: 31771616 Free PMC article.
-
Interplay between MAP kinases and tumor microenvironment: Opportunity for immunotherapy in pancreatic cancer.Adv Cancer Res. 2023;159:113-143. doi: 10.1016/bs.acr.2023.02.003. Epub 2023 Mar 10. Adv Cancer Res. 2023. PMID: 37268394 Review.
-
B7 Family Members in Pancreatic Ductal Adenocarcinoma: Attractive Targets for Cancer Immunotherapy.Int J Mol Sci. 2022 Nov 30;23(23):15005. doi: 10.3390/ijms232315005. Int J Mol Sci. 2022. PMID: 36499340 Free PMC article. Review.
Cited by
-
The Role of Immune Checkpoint Inhibitors in Metastatic Pancreatic Cancer: Current State and Outlook.Pharmaceuticals (Basel). 2023 Oct 4;16(10):1411. doi: 10.3390/ph16101411. Pharmaceuticals (Basel). 2023. PMID: 37895882 Free PMC article. Review.
-
Distant metastasis of oral squamous cell carcinoma: immune escape mechanism and new perspectives on treatment.Discov Oncol. 2025 Mar 1;16(1):257. doi: 10.1007/s12672-025-01997-3. Discov Oncol. 2025. PMID: 40024975 Free PMC article. Review.
-
Molecular and metabolic regulation of immunosuppression in metastatic pancreatic ductal adenocarcinoma.Mol Cancer. 2023 Jul 24;22(1):118. doi: 10.1186/s12943-023-01813-y. Mol Cancer. 2023. PMID: 37488598 Free PMC article. Review.
-
Development of a customizable mouse backbone spectral flow cytometry panel to delineate immune cell populations in normal and tumor tissues.Front Immunol. 2024 Mar 27;15:1374943. doi: 10.3389/fimmu.2024.1374943. eCollection 2024. Front Immunol. 2024. PMID: 38605953 Free PMC article.
-
MARCO expression on myeloid-derived suppressor cells is essential for their differentiation and immunosuppression.Cell Death Discov. 2025 Jul 22;11(1):337. doi: 10.1038/s41420-025-02627-1. Cell Death Discov. 2025. PMID: 40695812 Free PMC article.
References
-
- Conroy T., Desseigne F., Ychou M., et al. FOLFIRINOX versus gemcitabine for metastatic pancreatic cancer. N Engl J Med. 2011;364(19):1817–1825. - PubMed
MeSH terms
Substances
LinkOut - more resources
Full Text Sources
Medical
Molecular Biology Databases
Research Materials
Miscellaneous
