

Sensitivity of soil hydrogen uptake to natural and managed moisture dynamics in a semiarid urban ecosystem
- PMID: 35317075
- PMCID: PMC8934528
- DOI: 10.7717/peerj.12966
Sensitivity of soil hydrogen uptake to natural and managed moisture dynamics in a semiarid urban ecosystem
Abstract
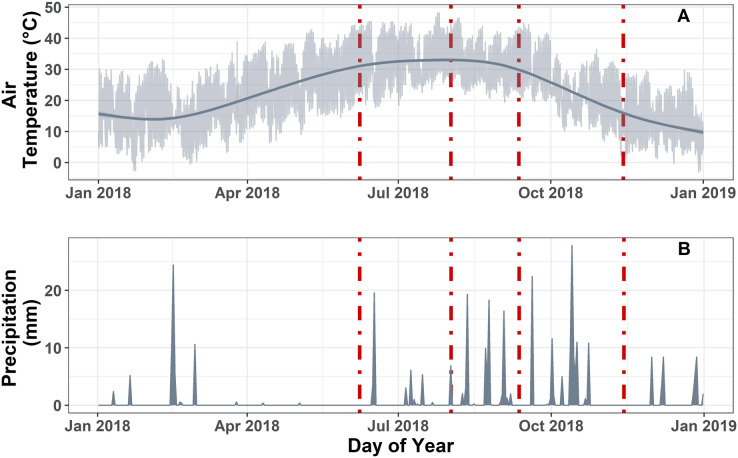
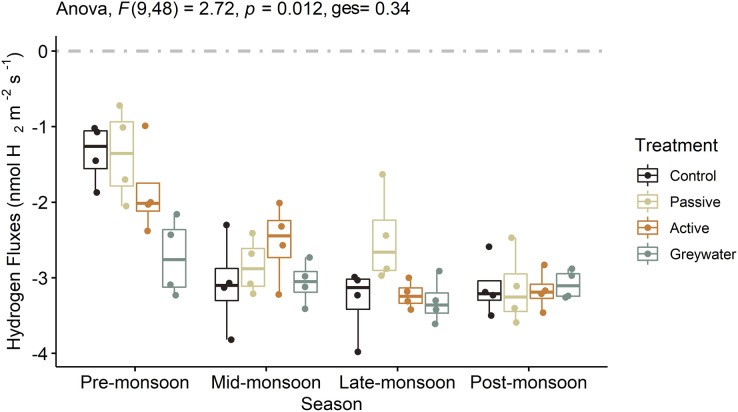
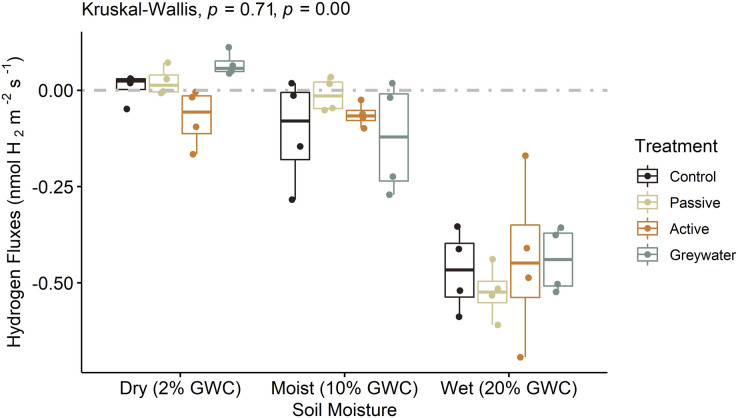
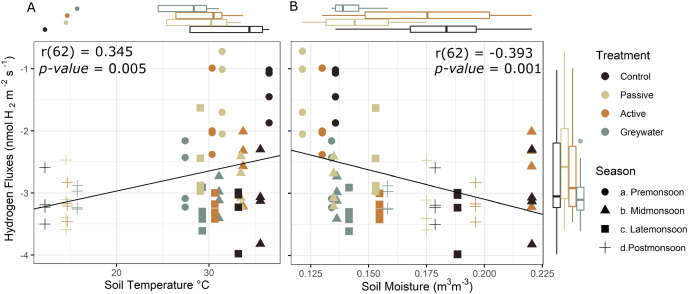
The North American Monsoon season (June-September) in the Sonoran Desert brings thunderstorms and heavy rainfall. These rains bring cooler temperature and account for roughly half of the annual precipitation making them important for biogeochemical processes. The intensity of the monsoon rains also increase flooding in urban areas and rely on green infrastructure (GI) stormwater management techniques such as water harvesting and urban rain gardens to capture runoff. The combination of increased water availability during the monsoon and water management provide a broad moisture regime for testing responses in microbial metabolism to natural and managed soil moisture pulses in drylands. Soil microbes rely on atmospheric hydrogen (H2) as an important energy source in arid and semiarid landscapes with low soil moisture and carbon availability. Unlike mesic ecosystems, transient water availability in arid and semiarid ecosystems has been identified as a key limiting driver of microbe-mediated H2 uptake. We measured soil H2 uptake in rain gardens exposed to three commonly used water harvesting practices during the monsoon season in Tucson AZ, USA. In situ static chamber measurements were used to calculate H2 uptake in each of the three water harvesting treatments passive (stormwater runoff), active (stored rooftop runoff), and greywater (used laundry water) compared to an unaltered control treatment to assess the effects of water management practices on soil microbial activity. In addition, soils were collected from each treatment and brought to the lab for an incubation experiment manipulating the soil moisture to three levels capturing the range observed from field samples. H2 fluxes from all treatments ranged between -0.72 nmol m-2 s-1 and -3.98 nmol m-2 s-1 over the monsoon season. Soil H2 uptake in the greywater treatment was on average 53% greater than the other treatments during pre-monsoon, suggesting that the increased frequency and availability of water in the greywater treatment resulted in higher H2 uptake during the dry season. H2 uptake was significantly correlated with soil moisture (r = -0.393, p = 0.001, df = 62) and temperature (r = 0.345, p = 0.005, df = 62). Our findings suggest that GI managed residential soils can maintain low levels of H2 uptake during dry periods, unlike unmanaged systems. The more continuous H2 uptake associated with GI may help reduce the impacts of drought on H2 cycling in semiarid urban ecosystems.
Keywords: Aridlands; Biogeochemistry; Green infrastructure; Hydrogen fluxes; Microbial activity; Seasonal precipitation; Semiarid urban ecosystems; Soil hydrogen uptake; Water management.
© 2022 Buzzard et al.
Conflict of interest statement
The authors declare that they have no competing interests.
Figures
Similar articles
-
Water pulses and biogeochemical cycles in arid and semiarid ecosystems.Oecologia. 2004 Oct;141(2):221-35. doi: 10.1007/s00442-004-1519-1. Epub 2004 Feb 24. Oecologia. 2004. PMID: 14986096 Review.
-
Soil microbial responses to temporal variations of moisture and temperature in a chihuahuan desert grassland.Microb Ecol. 2008 Jul;56(1):153-67. doi: 10.1007/s00248-007-9333-z. Epub 2008 Feb 2. Microb Ecol. 2008. PMID: 18246293
-
Green infrastructure influences soil health: Biological divergence one year after installation.Sci Total Environ. 2021 Dec 20;801:149644. doi: 10.1016/j.scitotenv.2021.149644. Epub 2021 Aug 13. Sci Total Environ. 2021. PMID: 34428660
-
Toxicity bioassays for ecological risk assessment in arid and semiarid ecosystems.Rev Environ Contam Toxicol. 2001;168:43-98. doi: 10.1007/978-1-4613-0143-1_2. Rev Environ Contam Toxicol. 2001. PMID: 12882227 Review.
-
Antecedent moisture and seasonal precipitation influence the response of canopy-scale carbon and water exchange to rainfall pulses in a semi-arid grassland.New Phytol. 2006;170(4):849-60. doi: 10.1111/j.1469-8137.2006.01732.x. New Phytol. 2006. PMID: 16684243
Cited by
-
Plant traits and community composition drive the assembly processes of abundant and rare fungi across deserts.Front Microbiol. 2022 Sep 28;13:996305. doi: 10.3389/fmicb.2022.996305. eCollection 2022. Front Microbiol. 2022. PMID: 36246243 Free PMC article.
References
MeSH terms
Substances
LinkOut - more resources
Full Text Sources
Miscellaneous
