

Pathways explaining racial/ethnic disparities in incident all-cause and Alzheimer's disease dementia among older US men and women
- PMID: 35317081
- PMCID: PMC8924949
- DOI: 10.1002/trc2.12275
Pathways explaining racial/ethnic disparities in incident all-cause and Alzheimer's disease dementia among older US men and women
Abstract
Introduction: Racial disparities in Alzheimer's disease (AD) and all-cause dementia (DEMENTIA) incidence may exist differentially among men and women, with unknown mechanisms.
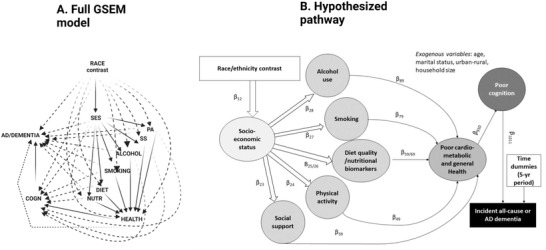
Methods: A retrospective cohort study examining all-cause and AD dementia incidence was conducted linking Third National Health and Nutrition Examination Survey (NHANES III) to Centers for Medicare & Medicaid Services Medicare data over ≤26 years of follow-up (1988 to 2014). Cox regression and generalized structural equation models (GSEMs) were constructed among men and women ≥60 years of age at baseline (N = 4592). Outcomes included onset ages of all-cause and AD dementia, whereas the main exposures were race/ethnicity contrasts (RACE_ETHN). Potential mediators) included socio-economic status (SES), lifestyle factors (dietary quality [DIET] nutritional biomarkers [NUTR], physical activity [PA], social support [SS], alcohol [ALCOHOL], poor health [or HEALTH], poor cognitive performance [or COGN]. In addition to RACE_ETHN, the following were exogenous covariates in the GSEM and potential confounders in Cox models: age, sex, urban-rural, household size, and marital status.
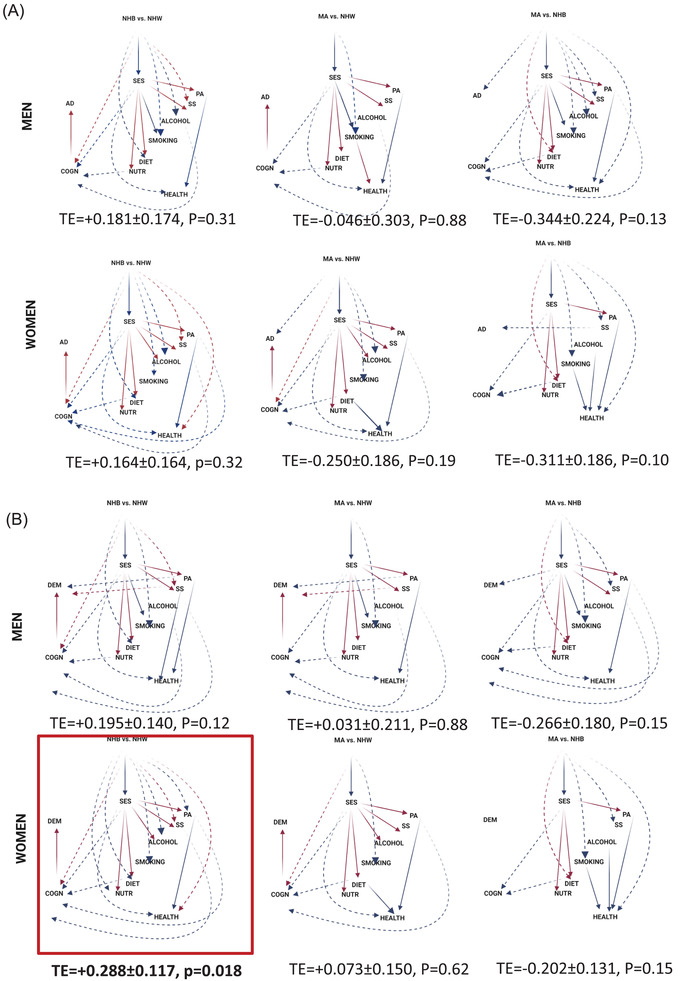
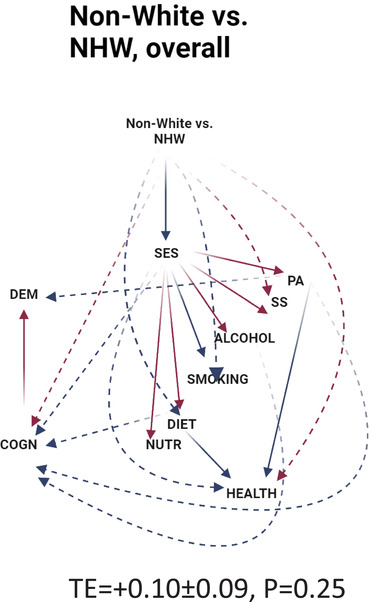
Results: Non-Hispanic Black (NHB) women had a higher risk of DEMENTIA versus non-Hispanic White (NHW) women in GSEM, consistent with Cox models (age-adjusted model: hazard ratio [HR] = 1.34, 95% confidence interval [CI]: 1.10 to 1.61). The total effect of this RACE_ETHN contrast in women was explained by four main pathways: (1) RACE_ETHN→ poor cognitive performance (COGN, +) → DEMENTIA (+); (2) RACE_ETHN → SES (-) → COGN (-) → DEMENTIA (+); (3) RACE_ETHN → SES (-) → physical activity (PA, +) → COGN (-) → DEMENTIA (+); and (4) RACE_ETHN → SES (-) → DIET (+) → COGN (-) → DEMENTIA (+). A reduced AD risk in Mexican American (MA) women versus NHW women upon adjustment for SES and downstream factors (HR = 0.53, 95% CI: 0.35 to 0.80). For the non-White versus NHW contrast in incident DEMENTIA, pathways involved lower SES, directly increasing cognitive deficits (or indirectly through lifestyle factors), which then directly increases DEMENTIA .
Discussion: Socioeconomic and lifestyle factors explaining disparities between NHB and NHW in dementia onset among women are important to consider for future observational and intervention studies.
Keywords: Alzheimer's disease; aging; dementia; modifiable risk factors; racial disparities; structural equations modeling.
© 2022 The Authors. Alzheimer's & Dementia: Diagnosis, Assessment & Disease Monitoring published by Wiley Periodicals, LLC on behalf of Alzheimer's Association.
Conflict of interest statement
None declared.
Figures
Similar articles
-
Pathways explaining racial/ethnic and socio-economic disparities in incident all-cause dementia among older US adults across income groups.Transl Psychiatry. 2022 Nov 15;12(1):478. doi: 10.1038/s41398-022-02243-y. Transl Psychiatry. 2022. PMID: 36379922 Free PMC article.
-
Pathways explaining racial/ethnic and socio-economic disparities in dementia incidence: the UK Biobank study.Aging (Albany NY). 2023 Sep 25;15(18):9310-9340. doi: 10.18632/aging.205058. Epub 2023 Sep 25. Aging (Albany NY). 2023. PMID: 37751591 Free PMC article.
-
Pathways explaining racial/ethnic disparities in incident all-cause dementia among middle-aged US adults.Alzheimers Dement. 2023 Oct;19(10):4299-4310. doi: 10.1002/alz.12976. Epub 2023 Mar 3. Alzheimers Dement. 2023. PMID: 36868873 Free PMC article.
-
Folic acid supplementation and malaria susceptibility and severity among people taking antifolate antimalarial drugs in endemic areas.Cochrane Database Syst Rev. 2022 Feb 1;2(2022):CD014217. doi: 10.1002/14651858.CD014217. Cochrane Database Syst Rev. 2022. PMID: 36321557 Free PMC article.
-
Differences in Alzheimer's Disease and Related Dementias Pathology Among African American and Hispanic Women: A Qualitative Literature Review of Biomarker Studies.Front Syst Neurosci. 2021 Jul 21;15:685957. doi: 10.3389/fnsys.2021.685957. eCollection 2021. Front Syst Neurosci. 2021. PMID: 34366799 Free PMC article. Review.
Cited by
-
Environmental, Sociocultural, Behavioral, and Biological Factors Associated with Cognitive Decline, Alzheimer's Disease, and Other Types of Dementia in Black Americans.Curr Epidemiol Rep. 2023 Dec;10(4):252-263. doi: 10.1007/s40471-023-00337-9. Epub 2023 Nov 14. Curr Epidemiol Rep. 2023. PMID: 39206249 Free PMC article.
-
Drug-induced dementia: a real-world pharmacovigilance study using the FDA Adverse Event Reporting System database.Ther Adv Neurol Disord. 2025 Jan 28;18:17562864251315137. doi: 10.1177/17562864251315137. eCollection 2025. Ther Adv Neurol Disord. 2025. PMID: 39882323 Free PMC article.
-
Infection burden, periodontal pathogens, and their interactive association with incident all-cause and Alzheimer's disease dementia in a large national survey.Alzheimers Dement. 2024 Sep;20(9):6468-6485. doi: 10.1002/alz.14141. Epub 2024 Aug 8. Alzheimers Dement. 2024. PMID: 39115027 Free PMC article.
-
A Community-Based Study of Dementia in Mexican American and Non-Hispanic White Individuals.J Alzheimers Dis. 2024;97(2):649-658. doi: 10.3233/JAD-230729. J Alzheimers Dis. 2024. PMID: 38143352 Free PMC article.
-
Helicobacter pylori, persistent infection burden and structural brain imaging markers.Brain Commun. 2024 Mar 13;6(2):fcae088. doi: 10.1093/braincomms/fcae088. eCollection 2024. Brain Commun. 2024. PMID: 38529358 Free PMC article.
References
-
- Sosa‐Ortiz AL, Acosta‐Castillo I, Prince MJ. Epidemiology of dementias and Alzheimer's disease. Arch Med Res. 2012;43:600‐608. - PubMed
-
- Lindeboom J, Weinstein H. Neuropsychology of cognitive ageing, minimal cognitive impairment, Alzheimer's disease, and vascular cognitive impairment. Eur J Pharmacol. 2004;490:83‐86. - PubMed
-
- Helmer C, Pasquier F, Dartigues JF. Epidemiology of Alzheimer disease and related disorders. Med Sci. 2006;22:288‐296. - PubMed
-
- Honjo K, van Reekum R, Verhoeff NP. Alzheimer's disease and infection: do infectious agents contribute to progression of Alzheimer's disease?. Alzheimers Dement. 2009;5:348‐360. - PubMed
Grants and funding
LinkOut - more resources
Full Text Sources