Single-Cell Sequencing Revealed Pivotal Genes Related to Prognosis of Myocardial Infarction Patients
- PMID: 35317194
- PMCID: PMC8934393
- DOI: 10.1155/2022/6534126
Single-Cell Sequencing Revealed Pivotal Genes Related to Prognosis of Myocardial Infarction Patients
Retraction in
-
Retracted: Single-Cell Sequencing Revealed Pivotal Genes Related to Prognosis of Myocardial Infarction Patients.Comput Math Methods Med. 2023 Dec 13;2023:9895238. doi: 10.1155/2023/9895238. eCollection 2023. Comput Math Methods Med. 2023. PMID: 38124937 Free PMC article.
Abstract
Objectives: Myocardial infarction (MI) is a common cardiovascular disease. Histopathology is a main molecular characteristic of MI, but often, differences between various cell subsets have been neglected. Under this premise, MI-related molecular biomarkers were screened using single-cell sequencing.
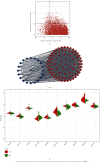
Methods: This work examined immune cell abundance in normal and MI samples from GSE109048 and determined differences in the activated mast cells and activated CD4 memory T cells, resting mast cells. Weighted gene coexpression network analysis (WGCNA) demonstrated that activated CD4 memory T cells were the most closely related to the turquoise module, and 10 hub genes were screened. Single-cell sequencing data (scRNA-seq) of MI were examined. We used t-distributed stochastic neighbor embedding (t-SNE) for cell clustering.
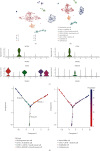
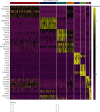
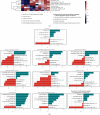
Results: We obtained 8 cell subpopulations, each of which had different marker genes. 7 out of the 10 hub genes were detected by single-cell sequencing analysis. The expression quantity and proportion of the 7 genes were different in 8 cell clusters.
Conclusion: In general, our study revealed the immune characteristics and determined 7 prognostic markers for MI at the single-cell level, providing a new understanding of the molecular characteristics and mechanism of MI.
Copyright © 2022 Jiamin Zhou et al.
Conflict of interest statement
The authors declare that they have no competing interest.
Figures


Similar articles
-
Identification of Biomarkers Related to Immune Cell Infiltration with Gene Coexpression Network in Myocardial Infarction.Dis Markers. 2021 Nov 5;2021:2227067. doi: 10.1155/2021/2227067. eCollection 2021. Dis Markers. 2021. PMID: 34777632 Free PMC article.
-
The integration of scRNA-seq with microarray and in-vivo experiments facilitates a comprehensive elucidation of the molecular mechanisms underlying endothelial cell involvement in myocardial infarction.Biochem Biophys Res Commun. 2025 Jun 20;766:151820. doi: 10.1016/j.bbrc.2025.151820. Epub 2025 Apr 14. Biochem Biophys Res Commun. 2025. PMID: 40288264
-
A combined analysis of bulk RNA-seq and scRNA-seq was performed to investigate the molecular mechanisms associated with the occurrence of myocardial infarction.BMC Genomics. 2024 Oct 3;25(1):921. doi: 10.1186/s12864-024-10813-1. BMC Genomics. 2024. PMID: 39363266 Free PMC article.
-
Identification of gene expression profiles in myocardial infarction: a systematic review and meta-analysis.BMC Med Genomics. 2018 Nov 27;11(1):109. doi: 10.1186/s12920-018-0427-x. BMC Med Genomics. 2018. PMID: 30482209 Free PMC article.
-
How to design a single-cell RNA-sequencing experiment: pitfalls, challenges and perspectives.Brief Bioinform. 2019 Jul 19;20(4):1384-1394. doi: 10.1093/bib/bby007. Brief Bioinform. 2019. PMID: 29394315 Review.
Cited by
-
Single-Cell RNA Sequencing and Microarray Analysis Reveal the Role of Lipid-Metabolism-Related Genes and Cellular Immune Infiltration in Pre-Eclampsia and Identify Novel Biomarkers for Pre-Eclampsia.Biomedicines. 2023 Aug 21;11(8):2328. doi: 10.3390/biomedicines11082328. Biomedicines. 2023. PMID: 37626824 Free PMC article.
-
Retracted: Single-Cell Sequencing Revealed Pivotal Genes Related to Prognosis of Myocardial Infarction Patients.Comput Math Methods Med. 2023 Dec 13;2023:9895238. doi: 10.1155/2023/9895238. eCollection 2023. Comput Math Methods Med. 2023. PMID: 38124937 Free PMC article.
-
Single-cell spatial transcriptomics in cardiovascular development, disease, and medicine.Genes Dis. 2023 Nov 14;11(6):101163. doi: 10.1016/j.gendis.2023.101163. eCollection 2024 Nov. Genes Dis. 2023. PMID: 39224111 Free PMC article. Review.
-
The roles of Th cells in myocardial infarction.Cell Death Discov. 2024 Jun 15;10(1):287. doi: 10.1038/s41420-024-02064-6. Cell Death Discov. 2024. PMID: 38879568 Free PMC article. Review.
-
Inflammation and Oxidative Stress Role of S100A12 as a Potential Diagnostic and Therapeutic Biomarker in Acute Myocardial Infarction.Oxid Med Cell Longev. 2022 Aug 25;2022:2633123. doi: 10.1155/2022/2633123. eCollection 2022. Oxid Med Cell Longev. 2022. Retraction in: Oxid Med Cell Longev. 2023 Dec 29;2023:9789872. doi: 10.1155/2023/9789872. PMID: 36062187 Free PMC article. Retracted.
References
Publication types
MeSH terms
Substances
LinkOut - more resources
Full Text Sources
Medical
Research Materials

