

Shear Wave Elastography in the Evaluation of Renal Parenchymal Stiffness in Patients With Chronic Kidney Disease: A Meta-Analysis
- PMID: 35317361
- PMCID: PMC8912996
- DOI: 10.14740/jocmr4621
Shear Wave Elastography in the Evaluation of Renal Parenchymal Stiffness in Patients With Chronic Kidney Disease: A Meta-Analysis
Abstract
Background: Chronic kidney disease (CKD) is a progressive loss of renal function, mainly due to hypertension, diabetes, and primary kidney disease. The histopathological findings are that of glomerulosclerosis, tubulointerstitial fibrosis and loss of renal parenchyma characterized. Therefrom, CKD can lead to higher morbidity and mortality. Patients with CKD have multiple risk factors, and the prevention work is complicated and arduous. Therefore, it is important to quantify the severity of CKD. The aim of this study is to investigate the value of shear wave elastography (SWE) in the evaluating renal parenchymal stiffness in patients with CKD.
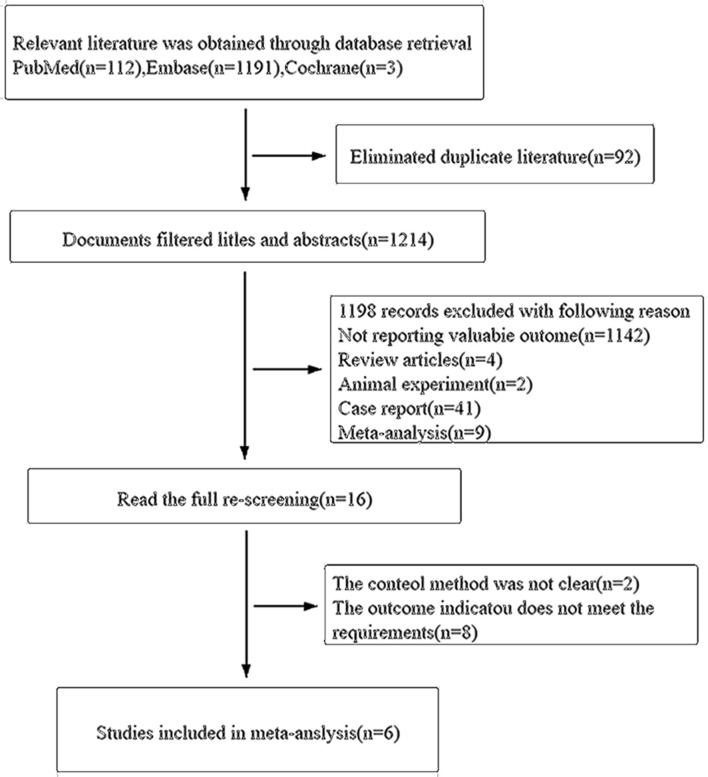
Methods: We carried out the systematic search of databases for publications in PubMed, Embase and Cochrane Library on SWE evaluating renal fibrosis in patients with CKD. The Endnote X9, STATA 16, Review Manager 5.3 and other software were used to sort out documents, extract, integrate and analyze data.
Results: The outcomes were utilized to appraise the diagnostic accuracy of SWE and diagnose the CKD with renal fibrosis. A total of 405 patients were enrolled and their data analysis results were as follows: summary of sensitivity (S-SEN) 84% (95% confidence interval (CI): 80-87%); specificity (S-SPE) 80% (95% CI: 76-84%); summary of DLR (digital light radiography) positive (DLR-P) 4.29 (95% CI: 3.43 - 5.37); and DLR negative (DLR-N) 0.20 (95% CI: 0.16 - 0.25). The corresponding areas under the curves of diagnostic odds ratio (DOR) and summary receiver operating characteristic curve (SROC) were 21.50 (95% CI: 14.69 - 31.46) and 89% (95% CI: 86-92%), respectively.
Conclusions: SWE is highly accurate and has clinical significance for evaluating renal fibrosis, especially when the shear modulus value is used as the threshold.
Keywords: Chronic kidney disease; Meta-analysis; Shear wave elastography.
Copyright 2022, Mo et al.
Conflict of interest statement
The authors disclose no conflict of interest.
Figures


Similar articles
-
Integrating shear wave elastography and estimated glomerular filtration rate to enhance diagnostic strategy for renal fibrosis assessment in chronic kidney disease.Quant Imaging Med Surg. 2024 Feb 1;14(2):1766-1777. doi: 10.21037/qims-23-962. Epub 2024 Jan 2. Quant Imaging Med Surg. 2024. PMID: 38415158 Free PMC article.
-
Diagnostic performance of contrast-enhanced ultrasound combined with shear wave elastography in differentiating benign from malignant breast lesions: a systematic review and meta-analysis.Gland Surg. 2023 Nov 24;12(11):1610-1623. doi: 10.21037/gs-23-333. Epub 2023 Oct 20. Gland Surg. 2023. PMID: 38107493 Free PMC article.
-
Value of Shear Wave Elastography in the Evaluation of Chronic Kidney Disease.Int J Nephrol Renovasc Dis. 2024 Dec 6;17:307-317. doi: 10.2147/IJNRD.S480501. eCollection 2024. Int J Nephrol Renovasc Dis. 2024. PMID: 39669874 Free PMC article.
-
Diagnostic Accuracy of Transient Elastography and Two-Dimensional Shear Wave Elastography for Staging Liver Fibrosis in Children or Adolescents: A Systematic Review and Meta-Analysis.Curr Med Imaging. 2023;19(11):1258-1272. doi: 10.2174/1573405618666220829152956. Curr Med Imaging. 2023. PMID: 36043782
-
Performance of two-dimensional shear wave elastography for detecting advanced liver fibrosis and cirrhosis in patients with biliary atresia: a systematic review and meta-analysis.Pediatr Radiol. 2023 Dec;53(13):2642-2650. doi: 10.1007/s00247-023-05796-2. Epub 2023 Nov 2. Pediatr Radiol. 2023. PMID: 37917168
Cited by
-
Noninvasive Quantitative Evaluation of Proliferative Lupus Nephritis Based on Ultrasonic Viscoelastic Imaging.J Inflamm Res. 2025 Mar 6;18:3269-3281. doi: 10.2147/JIR.S505223. eCollection 2025. J Inflamm Res. 2025. PMID: 40065905 Free PMC article.
-
Fibrosis in Chronic Kidney Disease: Pathophysiology and Therapeutic Targets.J Clin Med. 2024 Mar 25;13(7):1881. doi: 10.3390/jcm13071881. J Clin Med. 2024. PMID: 38610646 Free PMC article. Review.
-
Utility of shear wave elastography in evaluation of children with chronic kidney disease.Pediatr Nephrol. 2025 Jun;40(6):2021-2028. doi: 10.1007/s00467-024-06573-5. Epub 2024 Nov 18. Pediatr Nephrol. 2025. PMID: 39556210
-
Quantitative measurements of radiation-induced fibrosis for head and neck cancer: A narrative review.Laryngoscope Investig Otolaryngol. 2024 Apr 22;9(2):e1249. doi: 10.1002/lio2.1249. eCollection 2024 Apr. Laryngoscope Investig Otolaryngol. 2024. PMID: 38651078 Free PMC article. Review.
-
Diagnostic utility of two-dimensional shear wave elastography in nephropathic dogs and its correlation with renal contrast-enhanced ultrasound in course of acute kidney injury.J Vet Med Sci. 2023 Nov 18;85(11):1216-1225. doi: 10.1292/jvms.23-0065. Epub 2023 Oct 5. J Vet Med Sci. 2023. PMID: 37793837 Free PMC article.
References
LinkOut - more resources
Full Text Sources