

Effects of viremia and CD4 recovery on gut "microbiome-immunity" axis in treatment-naïve HIV-1-infected patients undergoing antiretroviral therapy
- PMID: 35317423
- PMCID: PMC8900548
- DOI: 10.3748/wjg.v28.i6.635
Effects of viremia and CD4 recovery on gut "microbiome-immunity" axis in treatment-naïve HIV-1-infected patients undergoing antiretroviral therapy
Abstract
Background: Human immunodeficiency virus type 1 (HIV-1) infection is characterized by persistent systemic inflammation and immune activation, even in patients receiving effective antiretroviral therapy (ART). Converging data from many cross-sectional studies suggest that gut microbiota (GM) changes can occur throughout including human immunodeficiency virus (HIV) infection, treated by ART; however, the results are contrasting. For the first time, we compared the fecal microbial composition, serum and fecal microbial metabolites, and serum cytokine profile of treatment-naïve patients before starting ART and after reaching virological suppression, after 24 wk of ART therapy. In addition, we compared the microbiota composition, microbial metabolites, and cytokine profile of patients with CD4/CD8 ratio < 1 (immunological non-responders [INRs]) and CD4/CD8 > 1 (immunological responders [IRs]), after 24 wk of ART therapy.
Aim: To compare for the first time the fecal microbial composition, serum and fecal microbial metabolites, and serum cytokine profile of treatment-naïve patients before starting ART and after reaching virological suppression (HIV RNA < 50 copies/mL) after 24 wk of ART.
Methods: We enrolled 12 treatment-naïve HIV-infected patients receiving ART (mainly based on integrase inhibitors). Fecal microbiota composition was assessed through next generation sequencing. In addition, a comprehensive analysis of a blood broad-spectrum cytokine panel was performed through a multiplex approach. At the same time, serum free fatty acid (FFA) and fecal short chain fatty acid levels were obtained through gas chromatography-mass spectrometry.
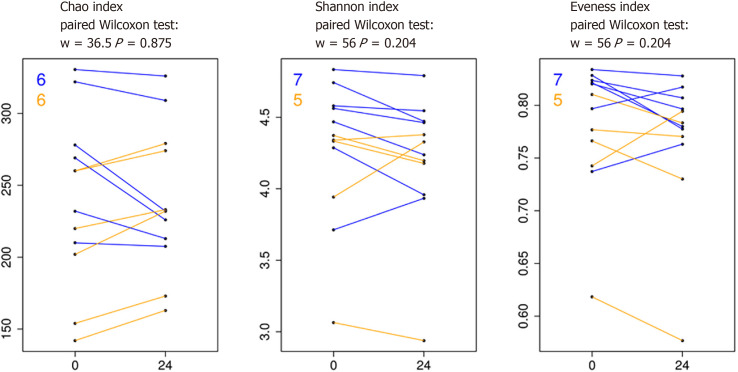
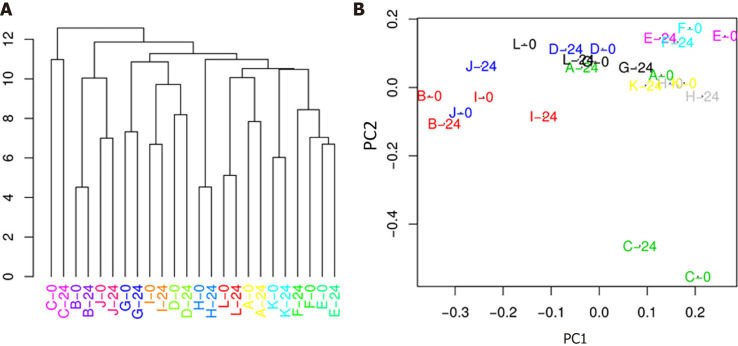
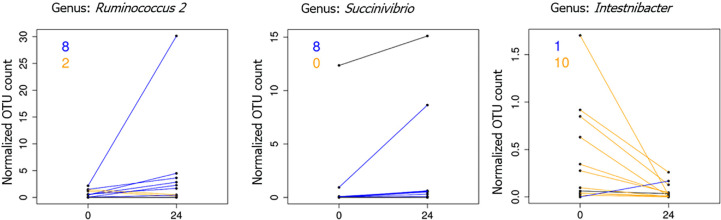
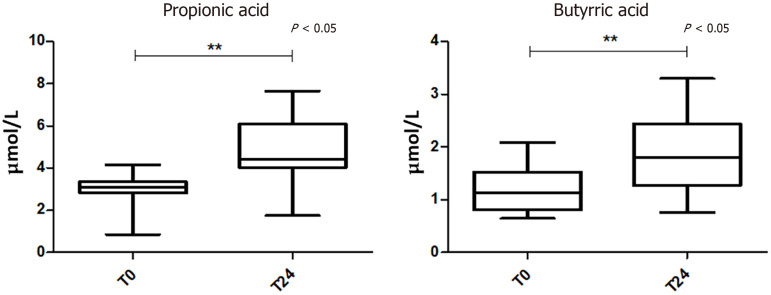
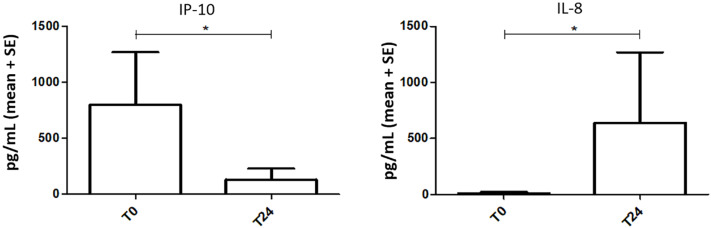
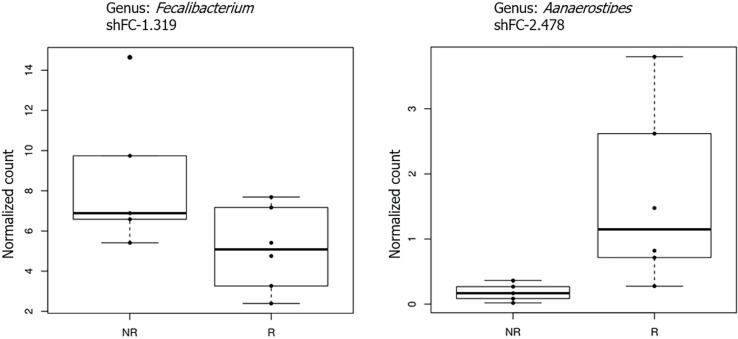
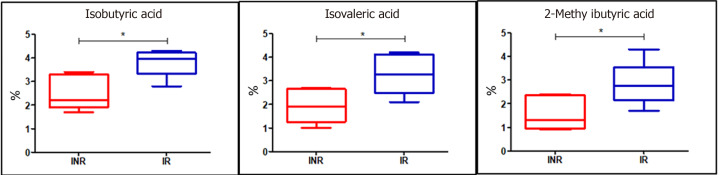
Results: We first compared microbiota signatures, FFA levels, and cytokine profile before starting ART and after reaching virological suppression. Modest alterations were observed in microbiota composition, in particular in the viral suppression condition, we detected an increase of Ruminococcus and Succinivibrio and a decrease of Intestinibacter. Moreover, in the same condition, we also observed augmented levels of serum propionic and butyric acids. Contemporarily, a reduction of serum IP-10 and an increase of IL-8 levels were detected in the viral suppression condition. In addition, the same components were compared between IRs and INRs. Concerning the microflora population, we detected a reduction of Faecalibacterium and an increase of Alistipes in INRs. Simultaneously, fecal isobutyric, isovaleric, and 2-methylbutyric acids were also increased in INRs.
Conclusion: Our results provided an additional perspective about the impact of HIV infection, ART, and immune recovery on the "microbiome-immunity axis" at the metabolism level. These factors can act as indicators of the active processes occurring in the gastrointestinal tract. Individuals with HIV-1 infection, before ART and after reaching virological suppression with 24 wk of ART, displayed a microbiota with unchanged overall bacterial diversity; moreover, their systemic inflammatory status seems not to be completely restored. In addition, we confirmed the role of the GM metabolites in immune reconstitution.
Keywords: Antiretroviral therapy; Cytokines; HIV; Immunological responders; Inflammation; Microbiome-immunity axis; Microbiota; Short chain fatty acid; Viremia.
©The Author(s) 2022. Published by Baishideng Publishing Group Inc. All rights reserved.
Conflict of interest statement
Conflict-of-interest statement: The authors declare that they have no competing interests to disclose.
Figures
Similar articles
-
Oral microbiota signatures associated with viremia and CD4 recovery in treatment-naïve HIV-1-infected patients.Microbes Infect. 2024 Jul-Aug;26(5-6):105339. doi: 10.1016/j.micinf.2024.105339. Epub 2024 Apr 16. Microbes Infect. 2024. PMID: 38636822
-
Association between CD4+ T cell counts and gut microbiota and serum cytokines levels in HIV-infected immunological non-responders.BMC Infect Dis. 2021 Aug 3;21(1):742. doi: 10.1186/s12879-021-06491-z. BMC Infect Dis. 2021. PMID: 34344350 Free PMC article.
-
Altered plasma metabolites and inflammatory networks in HIV-1 infected patients with different immunological responses after long-term antiretroviral therapy.Front Immunol. 2023 Sep 27;14:1254155. doi: 10.3389/fimmu.2023.1254155. eCollection 2023. Front Immunol. 2023. PMID: 37828979 Free PMC article.
-
Microbiota-Meditated Immunity Abnormalities Facilitate Hepatitis B Virus Co-Infection in People Living With HIV: A Review.Front Immunol. 2022 Jan 6;12:755890. doi: 10.3389/fimmu.2021.755890. eCollection 2021. Front Immunol. 2022. PMID: 35069530 Free PMC article. Review.
-
Altered gut microbiome composition in HIV infection: causes, effects and potential intervention.Curr Opin HIV AIDS. 2018 Jan;13(1):73-80. doi: 10.1097/COH.0000000000000429. Curr Opin HIV AIDS. 2018. PMID: 29045252 Review.
Cited by
-
Early changes in the gut microbiome among HIV-infected Individuals in Uganda initiating daily TMP/SMX.medRxiv [Preprint]. 2024 Oct 7:2024.10.07.24315002. doi: 10.1101/2024.10.07.24315002. medRxiv. 2024. PMID: 39417122 Free PMC article. Preprint.
-
Mechanisms of HIV-immunologic non-responses and research trends based on gut microbiota.Front Immunol. 2024 Dec 26;15:1378431. doi: 10.3389/fimmu.2024.1378431. eCollection 2024. Front Immunol. 2024. PMID: 39802299 Free PMC article. Review.
-
HIV, opioid use, and alterations to the gut microbiome: elucidating independent and synergistic effects.Front Immunol. 2023 Apr 24;14:1156862. doi: 10.3389/fimmu.2023.1156862. eCollection 2023. Front Immunol. 2023. PMID: 37168868 Free PMC article. Review.
-
Recent advances in poor HIV immune reconstitution: what will the future look like?Front Microbiol. 2023 Aug 7;14:1236460. doi: 10.3389/fmicb.2023.1236460. eCollection 2023. Front Microbiol. 2023. PMID: 37608956 Free PMC article. Review.
-
Effects of alcohol on the composition and metabolism of the intestinal microbiota among people with HIV: A cross-sectional study.Alcohol. 2024 Nov;120:151-159. doi: 10.1016/j.alcohol.2024.02.003. Epub 2024 Feb 20. Alcohol. 2024. PMID: 38387693 Free PMC article.
References
-
- Vujkovic-Cvijin I, Dunham RM, Iwai S, Maher MC, Albright RG, Broadhurst MJ, Hernandez RD, Lederman MM, Huang Y, Somsouk M, Deeks SG, Hunt PW, Lynch SV, McCune JM. Dysbiosis of the gut microbiota is associated with HIV disease progression and tryptophan catabolism. Sci Transl Med. 2013;5:193ra91. - PMC - PubMed
-
- Brenchley JM, Price DA, Schacker TW, Asher TE, Silvestri G, Rao S, Kazzaz Z, Bornstein E, Lambotte O, Altmann D, Blazar BR, Rodriguez B, Teixeira-Johnson L, Landay A, Martin JN, Hecht FM, Picker LJ, Lederman MM, Deeks SG, Douek DC. Microbial translocation is a cause of systemic immune activation in chronic HIV infection. Nat Med. 2006;12:1365–1371. - PubMed
-
- Guadalupe M, Reay E, Sankaran S, Prindiville T, Flamm J, McNeil A, Dandekar S. Severe CD4+ T-cell depletion in gut lymphoid tissue during primary human immunodeficiency virus type 1 infection and substantial delay in restoration following highly active antiretroviral therapy. J Virol. 2003;77:11708–11717. - PMC - PubMed
MeSH terms
LinkOut - more resources
Full Text Sources
Medical
Research Materials
