. 2022 Feb 22:24:755-771.
doi: 10.1016/j.omto.2022.02.021. eCollection 2022 Mar 17.

CircRHBDD1 augments metabolic rewiring and restricts immunotherapy efficacy via m6A modification in hepatocellular carcinoma

Affiliations

CircRHBDD1 augments metabolic rewiring and restricts immunotherapy efficacy via m6A modification in hepatocellular carcinoma

Juan Cai et al. Mol Ther Oncolytics. .

Abstract

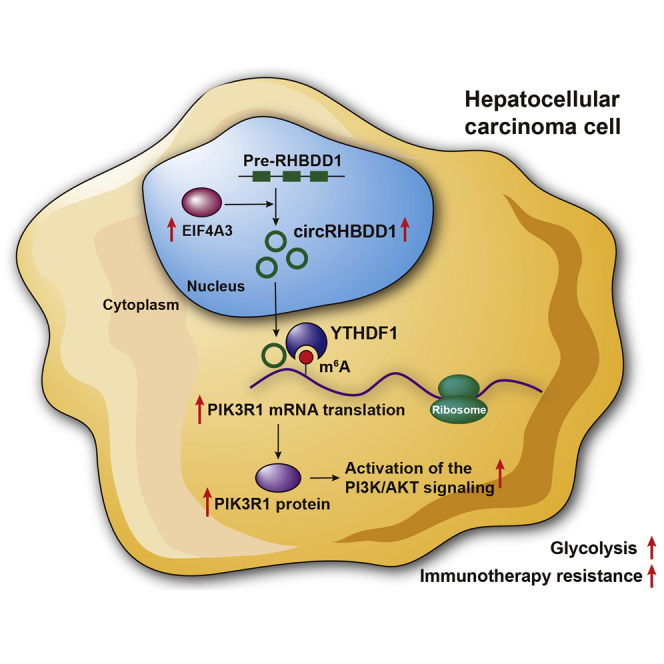
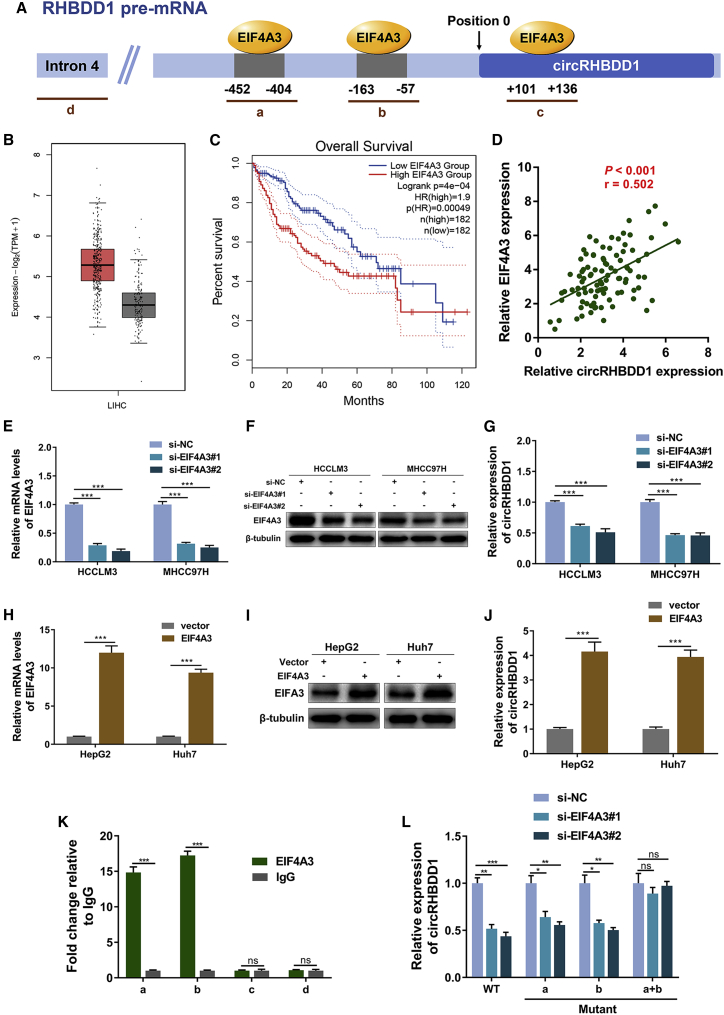
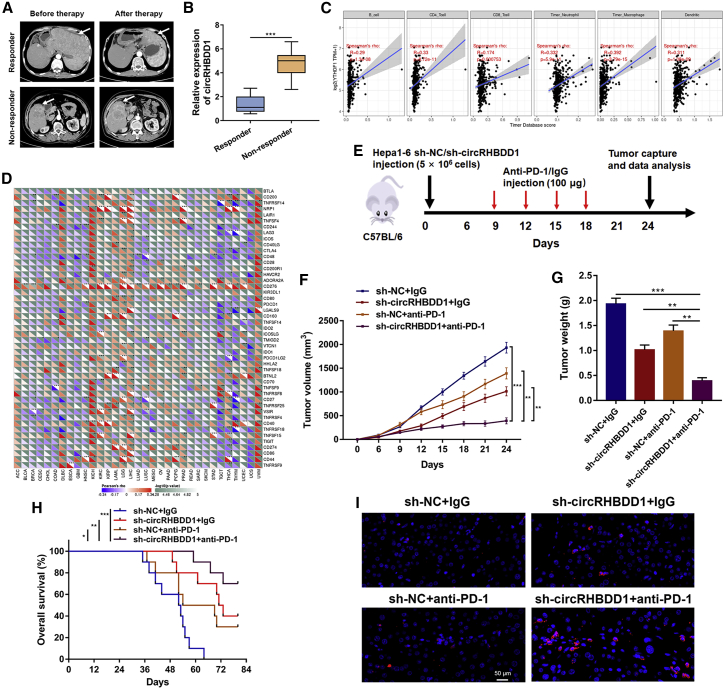
Circular RNAs are a class of highly conserved RNAs with stable covalently closed circular structures. Metabolic reprogramming of cancer cells reshapes the tumor microenvironment and can suppress antitumor immunity. Here, we discovered a novel circular RNA, termed circRHBDD1, which augments aerobic glycolysis and restricts anti-PD-1 therapy in hepatocellular carcinoma (HCC). Mechanistic studies revealed that circRHBDD1 recruits the m6A reader YTHDF1 to PIK3R1 mRNA and accelerates the translation of PIK3R1 in an m6A-dependent manner. EIF4A3-mediated exon back-splicing contributes to the upregulation of circRHBDD1. Moreover, circRHBDD1 is highly expressed in anti-PD-1 responder HCC patients, and targeting circRHBDD1 improves anti-PD-1 therapy in an immune-competent mouse model. Overall, these findings illustrate the metabolic importance of the circRHBDD1/YTHDF1/PIK3R1 axis in HCC and show that suppression of circRHBDD1 may bolster the efficacy of anti-PD-1 therapy for HCC treatment.

Keywords: PIK3R1; YTHDF1; circular RNA; glycolysis; hepatocellular carcinoma.


Conflict of interest statement

The authors declare no competing interests.

Figures

None
Graphical abstract
Figure 1
Figure 1
CircRHBDD1 is highly expressed in HCC (A) Cluster heatmap showing the differentially expressed circRNAs in paired human HCC tissues and peritumor tissues (n = 3). (B) Volcano plot showing circRNAs that changed significantly between HCC tissues and matched peritumor tissues. (C) Expression levels of the five most upregulated circRNAs were validated by qRT-PCR in 20 matched HCC and peritumor tissues from cohort 1. (D) Expression levels of circRHBDD1 in seven human HCC cell lines along with the normal human liver cell line QSG-7701. (E) Structure and back-splicing site of circRHBDD1. (F) CircRHBDD1 and GAPDH were amplified from cDNA or gDNA from HCCLM3 cells with divergent and convergent primers, respectively. (G) CircRHBDD1 and GAPDH were amplified from cDNA or gDNA from HepG2 cells with divergent and convergent primers, respectively. (H) qRT-PCR assays for circRHBDD1 and RHBDD1 mRNA using the template cDNA reverse transcribed by random primers and oligo(dT) primers in HCCLM3 and HepG2 cells. (I) qRT-PCR analysis for the expression of circRHBDD1 and RHBDD1 mRNA in HCCLM3 and HepG2 cells treated with RNase R. (J) qRT-PCR assays for the expression of circRHBDD1 and RHBDD1 mRNA in HCCLM3 cells treated with the transcription inhibitor actinomycin D at the indicated time points. (K) qRT-PCR assays for the expression of circRHBDD1 and RHBDD1 mRNA in HepG2 cells treated with the transcription inhibitor actinomycin D at the indicated time points. (L) FISH detection of circRHBDD1 in HCCLM3 cells. (M) Abundance of circRHBDD1 from separated nuclear and cytoplasmic fractions was determined by qRT-PCR in HCCLM3 cells. (N) Abundance of circRHBDD1 from separated nuclear and cytoplasmic fractions was determined by qRT-PCR in HepG2 cells. ∗p < 0.05; ∗∗p < 0.01; ∗∗∗p < 0.001; ns, no significance.
Figure 2
Figure 2
CircRHBDD1 predicts unfavorable patient survival in HCC (A) Expression levels of circRHBDD1 in 96 paired HCC and peritumor tissues from cohort 1 were determined by qRT-PCR (p < 0.001). (B) FISH detection of circRHBDD1 in ten matched HCC and peritumor tissues from cohort 1. (C) Expression levels of circRHBDD1 were compared between patients with tumor size ≤5 cm and those with tumor size >5 cm. (D) CircRHBDD1 expression levels were detected between the TNM stage I–II group and the TNM stage III–IV group. (E) Kaplan-Meier analysis of the correlation between circRHBDD1 expression levels and overall survival (p < 0.001). (F) Multivariate analyses of the independent predictive factors for overall survival. Hazard ratios (HR) and the corresponding 95% confidence intervals (CI) are shown. (G) Kaplan-Meier analysis of the association of circRHBDD1 expression levels with disease-free survival (p < 0.001). (H) Multivariate analyses of the independent predictive factors for disease-free survival. HRs with the corresponding 95% CIs are shown. ∗∗∗p < 0.001.
Figure 3
Figure 3
Knockdown of circRHBDD1 inhibits HCC viability in vitro (A) qRT-PCR analysis of circRHBDD1 and RHBDD1 mRNA in HCCLM3 cells after the transfection of two shRNAs targeting the back-spliced sequence of circRHBDD1. (B) qRT-PCR analysis of circRHBDD1 and RHBDD1 mRNA in MHCC97H cells after the transfection of sh-circRHBDD1#1 and sh-circRHBDD1#2. (C) Proliferation ability was evaluated by colony-formation assay (representative wells are presented) in circRHBDD1-silenced HCCLM3 and MHCC97H cells. (D) Proliferation of HCCLM3 cells after circRHBDD1 silencing was detected by CCK-8 assay. (E) Proliferation of circRHBDD1-silenced MHCC97H cells was examined using CCK-8 assay. (F) EdU assays were conducted to assess the proliferative ability of HCCLM3 and MHCC97H cells with circRHBDD1 knockdown. ∗p < 0.05; ∗∗p < 0.01; ∗∗∗p < 0.001; ns, no significance.
Figure 4
Figure 4
CircRHBDD1 knockdown suppresses glycolysis in HCCLM3 cells (A) Heatmap showing the differentially expressed genes upon circRHBDD1 knockdown in HCCLM3 cells (n = 3). (B) Pathway enrichment analysis showing the top canonical pathways after circRHBDD1 knockdown. (C) Levels of GLUT1 and HK2 mRNA in HCCLM3 cells with circRHBDD1 knockdown. (D) Levels of GLUT1 and HK2 proteins in circRHBDD1-silenced HCCLM3 cells. (E) ECAR data showed that silencing circRHBDD1 significantly reduced the rate of glycolysis and the glycolysis capacity in HCCLM3 cells. (F) OCR results showed that circRHBDD1-silenced HCCLM3 cells displayed increased basal respiration and maximum respiration. (G) Cellular G6P level, lactate production, and cellular ATP level were detected in HCCLM3 cells with circRHBDD1 knockdown. (H) FISH was used to determine the expression of circRHBDD1, and representative 18F-FDG PET/CT imaging of HCC patients from cohort 1 with high or low circRHBDD1 expression is shown. (I) Analysis of SUVmax in the circRHBDDhigh and circRHBDDlow groups (n = 22). ∗p < 0.05; ∗∗p < 0.01; ∗∗∗p < 0.001.
Figure 5
Figure 5
CircRHBDD1 facilitates HCC tumor growth in vivo (A) Graphic illustration of the establishment of HCC PDX mouse models. (B) Expression levels of circRHBDD1 were detected in the xenografts isolated from mice of PDX using qRT-PCR. The engrafted tumors derived from patient #5 had the highest expression level of circRHBDD1, whereas the xenografts originating from patient #2 exhibited the lowest circRHBDD1 level. (C) The engrafted tumors from patient #5 and patient #2 were histopathologically analyzed. (D) Photographs of the engrafted tumors from PDX mice treated with circRHBDD1 plasmid or cholesterol-conjugated circRHBDD1 siRNA. (E) Tumor volume was measured in the engrafted tumors. (F) Tumor weight was recorded in the engrafted tumors. (G) Expression levels of circRHBDD1 were detected in the engrafted tumors by qRT-PCR. (H) FISH images showing the expression levels of circRHBDD1 in the engrafted tumors. (I) Expression levels of GLUT1 and Ki-67 in the tumor tissues of PDX were analyzed using immunohistochemistry. ∗p < 0.05; ∗∗p < 0.01; ∗∗∗p < 0.001.
Figure 6
Figure 6
CircRHBDD1 activates PI3K/AKT signaling by augmenting YTHDF1-mediated translation of PIK3R1 (A) Western blotting analysis showing the expression levels of p-PI3K, PI3K, p-AKT, and AKT in circRHBDD1-silenced HCCLM3 and MHCC97H cells. (B) Expression levels of PIK3R1 in circRHBDD1-silenced HCCLM3 and MHCC97H cells were determined by western blotting. (C) Expression levels of PIK3R1 and p-AKT in the tumor tissues of PDX were analyzed using immunohistochemistry. (D) PIK3R1 mRNA levels were detected by qRT-PCR in circRHBDD1-silenced HCCLM3 and MHCC97H cells. (E) The effects of circRHBDD1 knockdown on the degradation rate of PIK3R1 protein in HCCLM3 cells pretreated with cycloheximide (CHX) were analyzed by western blotting. (F) Quantitative analysis of (E). (G) The effects of MG132 and chloroquine (CQ) on circRHBDD1 knockdown-induced PIK3R1 downregulation were determined by western blotting. (H) The amount of PIK3R1 mRNA in various polysome fractions was analyzed by qRT-PCR. (I) An AGO2-RIP assay was performed to detect the levels of circRHBDD1 in the AGO2 IP pellet. (J) Results from the CPAT database indicating the absence of coding potential for circRHBDD1. (K) Mass spectrometry analysis was conducted to determine the proteins that could bind to circRHBDD1. YTHDF1 was revealed as a potential circRHBDD1-interacting protein. (L) RNA pull-down assays followed by western blotting for YTHDF1 in HCCLM3 cells. (M) The interaction between YTHDF1 and circRHBDD1 was verified by RIP assays. (N) FISH for circRHBDD1 and immunofluorescence for YTHDF1 in HCCLM3 cells. The profiles of colocalization are also provided. (O) TCGA data suggested that the expression level of YTHDF1 was upregulated in HCC tissues compared with peritumoral tissues (p < 0.05). (P) YTHDF1 was associated with unfavorable overall survival in HCC patients based on the TCGA data (hazard ratio = 1.8). ∗∗∗p < 0.001; ns, no significance.
Figure 7
Figure 7
YTHDF1 regulates PIK3R1 translation in an m6A-dependent manner (A) The overexpression efficiency of YTHDF1 was validated by qRT-PCR in HepG2 and Huh7 cells. (B) Western blotting assays showing the protein levels of YTHDF1 and PIK3R1 in YTHDF1-overexpressing HepG2 and Huh7 cells. (C) meRIP-qPCR analysis showing the m6A level of PIK3R1 detected in YTHDF1-overexpressing HepG2 and Huh7 cells. (D) PIK3R1 mRNA levels of HepG2 cells with or without YTHDF1 overexpression were examined using qRT-PCR. (E) The amount of PIK3R1 mRNA in various polysome fractions was analyzed by qRT-PCR in HepG2 cells with or without YTHDF1 overexpression. (F) Schematic illustration of wild-type (YTHDF1-WT) and mutant (YTHDF1-Mut) YTHDF1 constructs. (G) Protein levels of PIK3R1 in HepG2 and Huh7 cells transfected with YTHDF1-WT or YTHDF1-Mut. (H) qRT-PCR analysis showing the levels of PIK3R1 mRNA in HepG2 and Huh7 cells transfected with YTHDF1-WT or YTHDF1-Mut. (I) PIK3R1-specific qPCR analysis of the co-precipitated RNAs by a FLAG antibody in RIP analysis. (J) The two m6A peaks among PIK3R1 mRNA. (K) The two m6A peaks among PIK3R1 mRNA were confirmed by meRIP-qPCR in HCCLM3 cells. (L) Protein level of PIK3R1 in HCCLM3 cells co-transfected with empty vector, wild-type, or mutant FLAG-tagged YTHDF1 and wild-type or mutant HA-tagged PIK3R1. ∗∗∗p < 0.001; ns, no significance.
Figure 8
Figure 8
EIF4A3 promotes the expression of circRHBDD1 (A) The putative binding sites (sites a, b, and c) of EIF4A3 in the upstream and downstream regions of RHBDD1 pre-mRNA were predicted with the CircInteractome database. (B) TCGA data suggested that the expression level of EIF4A3 was upregulated in HCC tissues compared with peritumoral tissues (p < 0.05). (C) EIF4A3 was associated with unfavorable overall survival in HCC patients based on TCGA data (hazard ratio = 1.9). (D) Correlation analysis revealed that circRHBDD1 level was positively correlated with the expression level of EIF4A3 in HCC tissues from cohort 1 (p < 0.001, r = 0.502). (E) Knockdown efficiency of EIF4A3 siRNAs was validated by qRT-PCR in HCCLM3 and MHCC97H cells. (F) Western blotting assays verifying the knockdown efficiency of EIF4A3 in HCCLM3 and MHCC97H cells. (G) Expression levels of circRHBDD1 in HCCLM3 and MHCC97H cells with EIF4A3 knockdown. (H) The overexpression efficiency of EIF4A3 was validated by qRT-PCR in HepG2 and Huh7 cells. (I) Western blotting assays verifying the overexpression efficiency of EIF4A3 in HepG2 and Huh7 cells. (J) Expression levels of circRHBDD1 in EIF4A3-overexpressing HepG2 and Huh7 cells. (K) RIP assays confirmed that EIF4A3 could directly bind to the RHBDD1 pre-mRNA at sites a and b. (L) Mutants of both sites a and b restored the reduction in circRHBDD1 expression level in EIF4A3-silenced cells. ∗p < 0.05; ∗∗p < 0.01; ∗∗∗p < 0.001; ns, no significance.
Figure 9
Figure 9
CircRHBDD1 restricts anti-PD-1 therapy in HCC (A) Representative CT imaging of HCC patients treated with anti-PD-1 in the responder and non-responder groups. (B) Expression level of circRHBDD1 in the responder group and the non-responder group (n = 18). (C) YTHDF1 expression was positively correlated with infiltration levels of immune cells in liver cancer according to TIMER database by correlation analysis. (D) Pan-cancer analysis of the correlation between YTHDF1 and the expression levels of immune-associated genes. (E) Illustration of the treatment plan for C57BL/6 mice subcutaneously transplanted with circRHBDD1-silenced or control Hepa1-6 cells. (F) Tumor volume was measured in the engrafted tumors. (G) Tumor weight was recorded in the engrafted tumors. (H) Survival curves of mice transplanted with circRHBDD1 knockdown or control Hepa1-6 cells and treated with anti-PD1 or IgG. (I) Immunofluorescence staining of CD8 in tumor tissues extracted from engrafted tumors of CB57L/6 mice. ∗p < 0.05; ∗∗p < 0.01; ∗∗∗p < 0.001.

Similar articles

Cited by

References

    1. Sung H., Ferlay J., Siegel R.L., Laversanne M., Soerjomataram I., Jemal A., Bray F. Global cancer statistics 2020: GLOBOCAN estimates of incidence and mortality worldwide for 36 cancers in 185 countries. CA Cancer J. Clin. 2021;71:209–249. - PubMed
    1. Sangro B., Sarobe P., Hervás-Stubbs S., Melero I. Advances in immunotherapy for hepatocellular carcinoma. Nat. Rev. Gastroenterol. Hepatol. 2021;18:525–543. - PMC - PubMed
    1. Llovet J.M., Kelley R.K., Villanueva A., Singal A.G., Pikarsky E., Roayaie S., Lencioni R., Koike K., Zucman-Rossi J., Finn R.S. Hepatocellular carcinoma. Nat. Rev. Dis. Primers. 2021;7:6. - PubMed
    1. Hanahan D., Weinberg R.A. Hallmarks of cancer: the next generation. Cell. 2011;144:646–674. - PubMed
    1. Thakur C., Chen F. Connections between metabolism and epigenetics in cancers. Semin. Cancer Biol. 2019;57:52–58. - PMC - PubMed

LinkOut - more resources