. 2022 Feb 20:24:849-863.
doi: 10.1016/j.omto.2022.02.015. eCollection 2022 Mar 17.

A novel PD-L1-targeted shark VNAR single-domain-based CAR-T cell strategy for treating breast cancer and liver cancer

Affiliations

A novel PD-L1-targeted shark VNAR single-domain-based CAR-T cell strategy for treating breast cancer and liver cancer

Dan Li et al. Mol Ther Oncolytics. .

Abstract

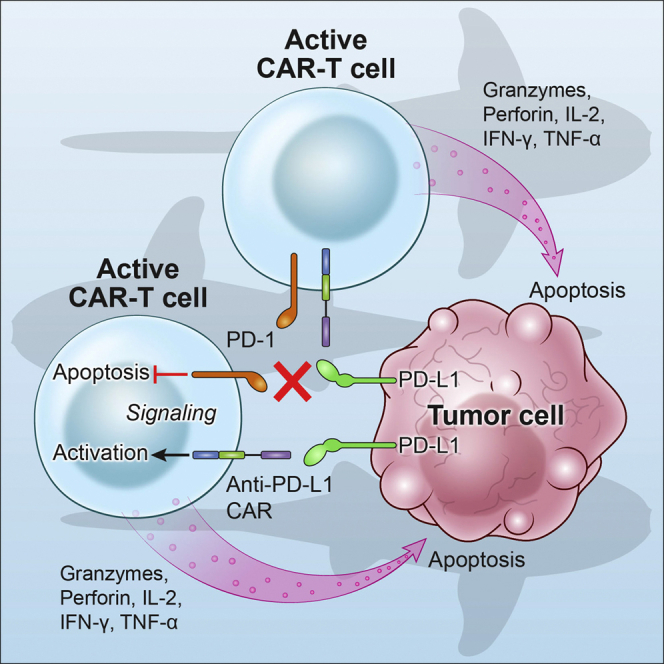
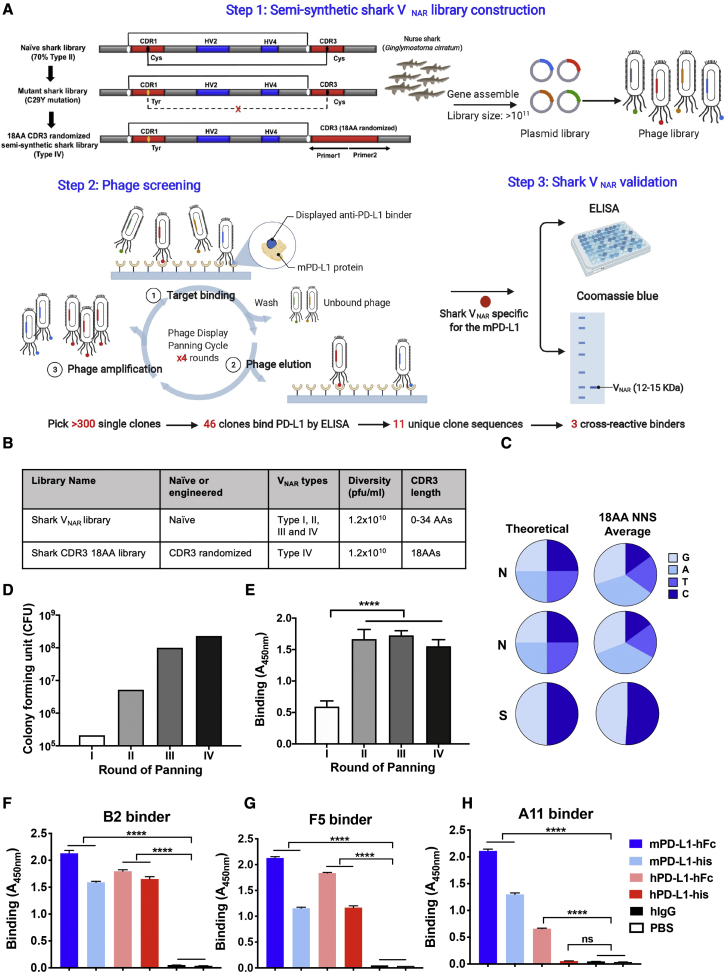
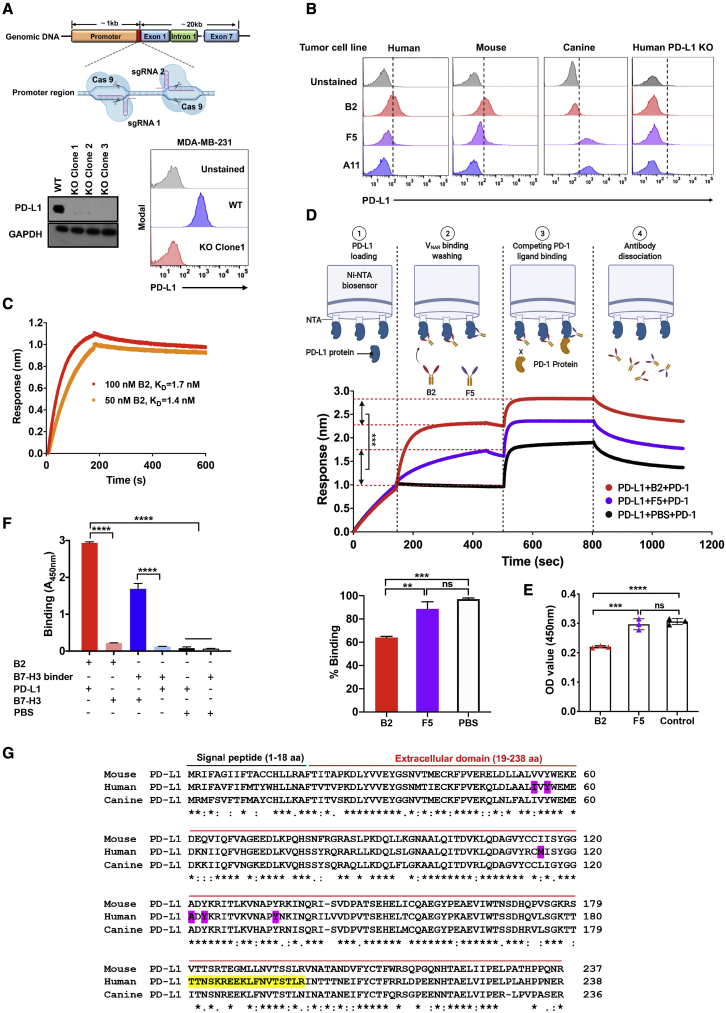
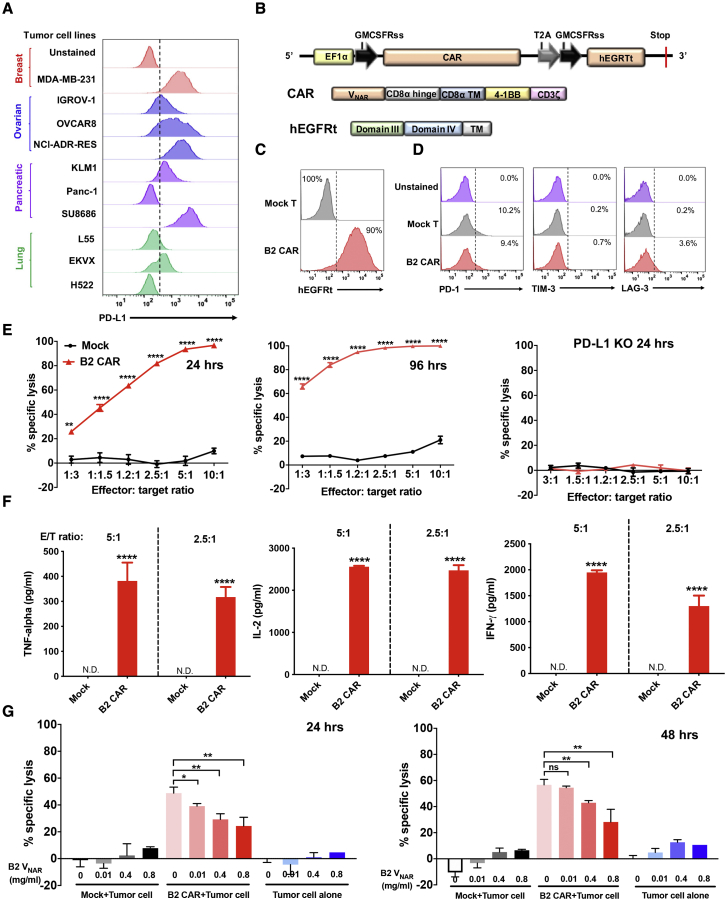
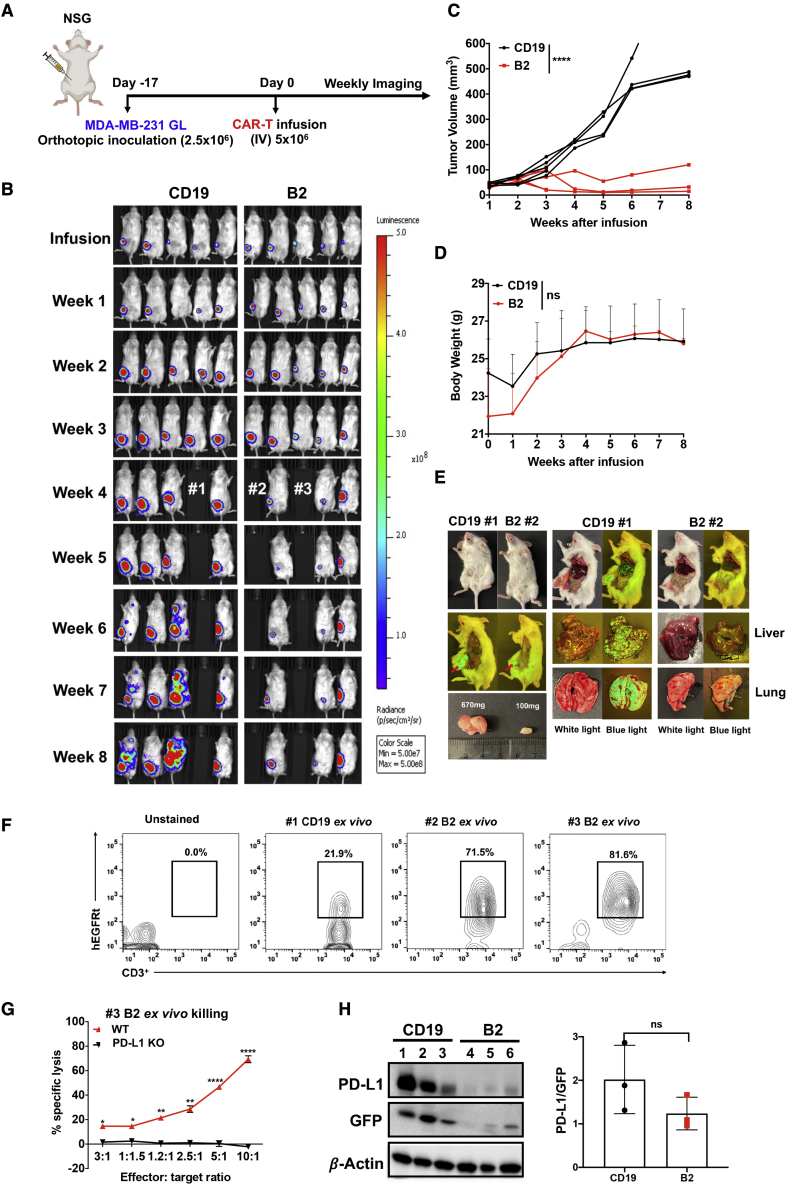
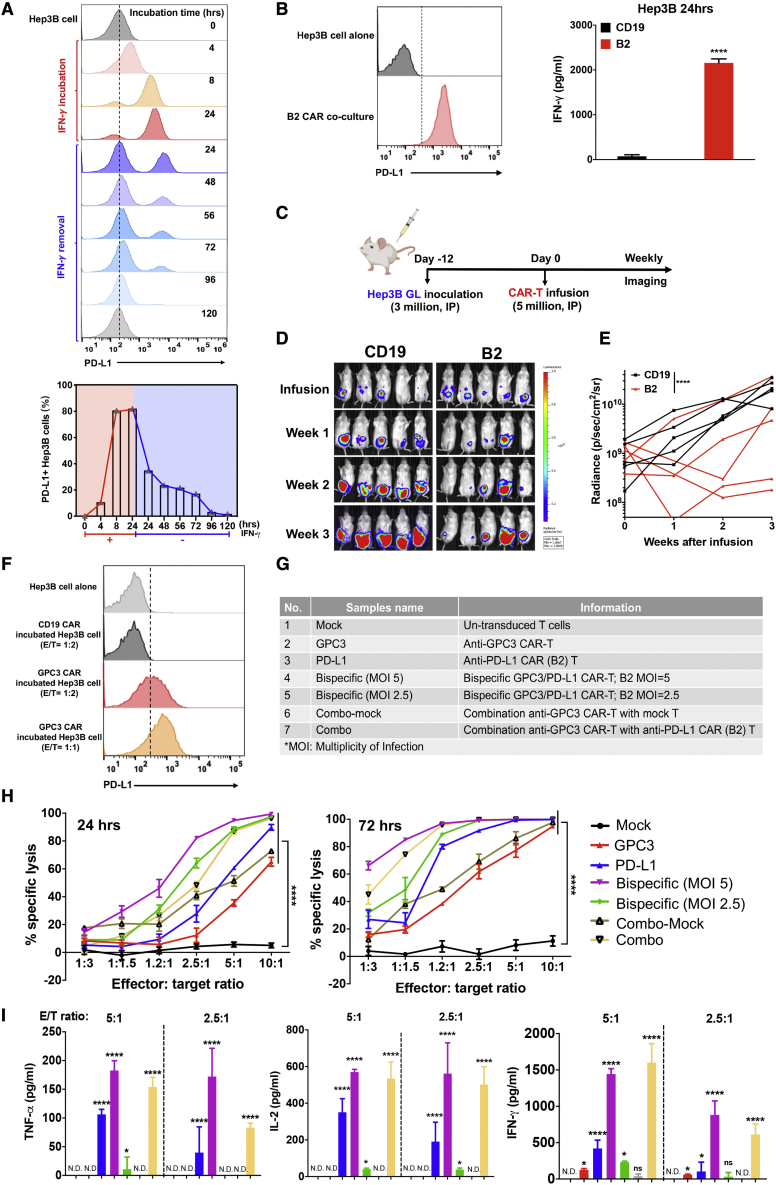
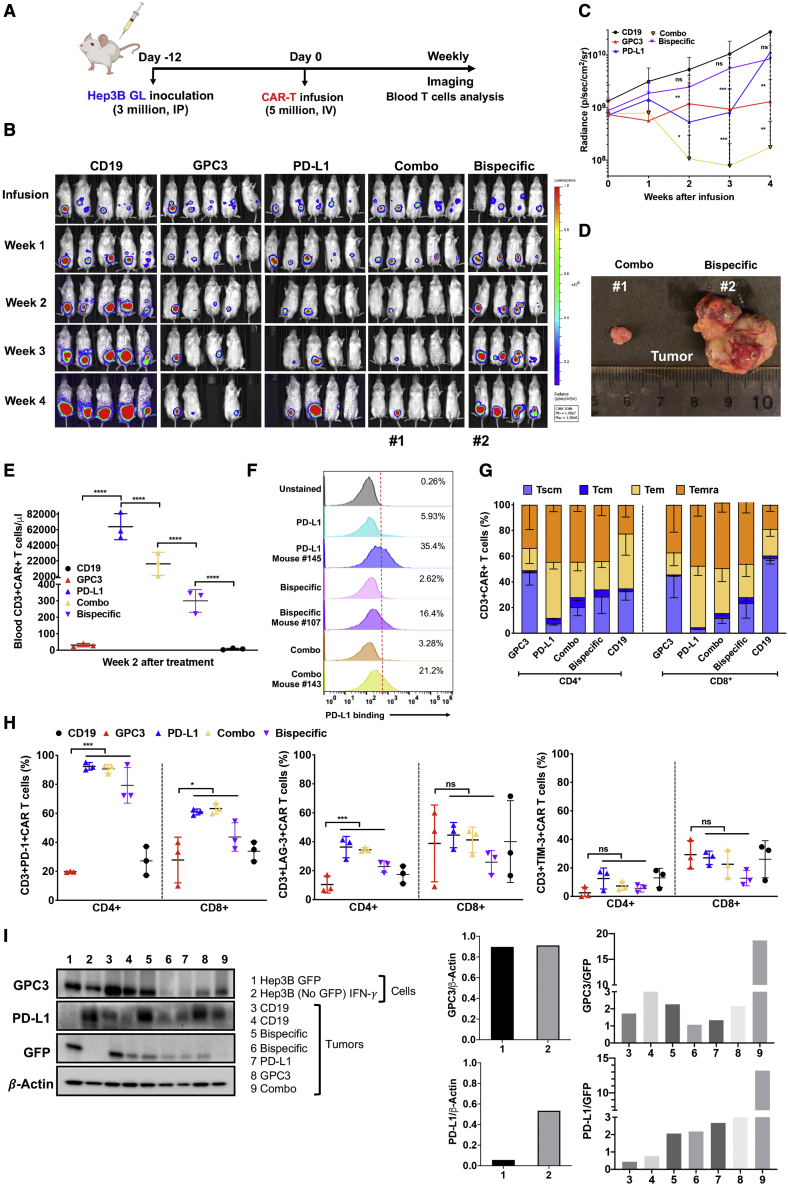
Chimeric antigen receptor (CAR)-T cell therapy shows excellent potency against hematological malignancies, but it remains challenging to treat solid tumors, mainly because of a lack of appropriate antigenic targets and an immunosuppressive tumor microenvironment (TME). The checkpoint molecule programmed death-ligand 1 (PD-L1) is widely overexpressed in multiple tumor types, and the programmed death-ligand 1 (PD-1)/PD-L1 interaction is a crucial mediator of immunosuppression in the TME. Here we constructed a semi-synthetic shark VNAR phage library and isolated anti-PD-L1 single-domain antibodies. Among these VNARs, B2 showed cross-reactivity to human, mouse, and canine PD-L1, and it partially blocked the interaction of human PD-1 with PD-L1. CAR (B2) T cells specifically lysed human breast cancer and liver cancer cells by targeting constitutive and inducible expression of PD-L1 and hindered tumor metastasis. Combination of PD-L1 CAR (B2) T cells with CAR T cells targeted by GPC3 (a liver cancer-specific antigen) regresses liver tumors in mice. We concluded that PD-L1-targeted shark VNAR single-domain-based CAR-T therapy is a novel strategy to treat breast and liver cancer. This study provides a rationale for potential use of PD-L1 CAR-T cells as a monotherapy or in combination with a tumor-specific therapy in clinical studies.

Keywords: CAR-T cells; GPC3; PD-L1; glypican-3; hepatocellular carcinoma; immune checkpoint; liver cancer; shark VNAR; single-domain antibody; triple-negative breast cancer.


Conflict of interest statement

M.H., G.M., D.L., H.E., and C.-P.D. are inventors on US provisional patent application no. 63/208,755 assigned to the NIH “Cross Species Single Domain Antibodies Targeting PD-L1 For Treating Solid Tumors.”

Figures

None
Graphical abstract
Figure 1
Figure 1
Isolation of the anti-PD-L1 single-domain antibody by phage display from an engineered semi-synthetic shark VNAR phage library (A) Circuit of three steps of library construction and phage panning. An 18-aa randomized CDR3 semi-synthetic shark VNAR phage library was constructed by PCR mutation and gene assembly. After 3–5 rounds of phage panning, anti-mPD-L1 VNARs were isolated from the phage library and validated by phage ELISA and protein purification technologies. (B) Information regarding the new shark VNAR library compared with the pre-synthetic VNAR library. (C) Pie chart of the percentages of average nucleotide (ACTG) ratio at each randomization NNS (where N = A/C/G/T, and S = C/G). (D) Phage-displayed single-domain antibody clones were identified against recombinant mPD-L1-His after four rounds of panning. A gradual increase in phage titers was observed during each round of panning. (E) Polyclonal phage ELISA from the output phage of each round of panning. (F–H) Cross-reactivity of anti-PD-L1 B2 (F), A11 (G), and F5 (H) to mPD-L1 and hPD-L1 protein within the His tag or hFc tag by monoclonal phage ELISA.
Figure 2
Figure 2
Verification of the specific binding and blocking ability of anti-PD-L1 shark VNARs (A) Schematic of constructing the PD-L1 KO MDA-MB-231 cell line using CRISPR-Cas9. Two sgRNAs were designed to target the promoter of the endogenous PD-L1 gene. Single PD-L1 KO clones were validated by western blot and flow cytometry. (B) The cross-reactive binding of anti-PD-L1 VNARs to native PD-L1 as determined by flow cytometry. Three different tumor cell lines (the human breast cancer cell line MDA-MB-231, murine melanoma cell line B8979HC, and canine tumor cell line Jones) were stained with VNARs. (C) Binding kinetics of B2-hFc to hPD-L1 protein. (D-E) Blocking activity of VNAR-hFc to the interaction of hPD-L1 and hPD-1 as determined by the Octet platform (D) and sandwich ELISA (E). (F) Specific binding of B2 to hPD-L1 and hB7-H3. (G) Epitope mapping of individual B2, F5, and A11 and sequence alignment of the PD-L1 ECD region of human, mouse, and dog. Conserved residues are marked with asterisks, residues with similar properties between variants are marked with colons, and residues with marginally similar properties are marked with periods. The main binding residues of the hPD-L1 identified previously that interact with PD-1 are shaded in magenta. The binding peptides of B2 to hPD-L1 are highlighted in yellow. Values represent mean ± SEM. ∗∗p < 0.01; ∗∗∗p < 0.001; ∗∗∗∗p < 0.0001; ns, not significant.
Figure 3
Figure 3
PD-L1 specific VNAR-based CAR-T cells exhibit antigen specific cytotoxicity against MDA-MB-231 (A) Surface PD-L1 expression on multiple human tumor types as determined by flow cytometry. (B) Construct of CAR (B2) T cells, where CAR and hEGFRt are expressed separately by the self-cleaving T2A ribosomal skipping sequence. (C) The transduction efficiency of CAR (B2) in T cells was determined by hEGFRt expression. Non-transduced T cells were the mock control. (D) Exhaustion marker expression on in-vitro-cultured mock T cell and CAR (B2) T cell populations. (E) Cytolytic activity of CAR (B2) T cells after 24 or 96 h of incubation with MDA-MB-231 GL or PD-L1 KO MDA-MB-231 GL, respectively, in a 2-fold dose-dependent manner. (F) TNF-α, IL-2, and IFN-γ concentrations in the supernatants of the killing assay at E/T ratios of 5:1 and 2.5:1 in (D), as measured by ELISA. (G) The monovalent B2 VNAR protein specifically inhibited the cytotoxicity of CAR (B2) T cells on MDA-MB-231 cells after 24- and 48-h incubation. Statistical analyses are shown from three independent experiments. Values represent mean ± SEM. ∗∗p < 0.01; ∗∗∗p < 0.001; ∗∗∗∗p < 0.0001.
Figure 4
Figure 4
Tumor regression in the orthotopic MDA-MB-231 xenograft mouse model by anti-PD-L1 CAR (B2) T cell infusion (A) Schematic of the MDA-MB-231 orthotopic xenograft NSG model infused i.v. with five million CAR (B2) T cells and CAR (CD19) T cells after 17 days of tumor inoculation. (B) Representative bioluminescence image of MDA-MB-231 tumor growth in the orthotopic model. (C) Tumor size of every mouse measured by a digital caliper [V = 1/2(length width2)]. ∗∗∗∗p < 0.0001. (D) Body weight of mice. Values represent mean ± SEM. (E) Representative pictures showing the restriction of tumor metastasis in CAR (B2) T cell-infused mice. (F-G) The persentage of persistent hEGFRt+ CAR-T cells in the total CD3+ human T cells recovered from mice after 3 weeks of CAR-T cell infusion (F) and their ex vivo killing on MDA-MB-231 tumor cells (G). (H) Detection of PD-L1 expression in MDA-MB-231 tumor xenografts by western blotting.
Figure 5
Figure 5
CAR (B2) T cells lysed Hep3B tumor by targeting inducible PD-L1 and improved CAR-T efficacy in bispecific CAR and combination manners (A) Inducible PD-L1 expression in Hep3B cells upon 50 μg/mL IFN-γ stimulation followed by depletion of IFN-γ at 24 h. (B) Inducible PD-L1 expression in the Hep3B cells after 24-h incubation with CAR (B2) T cells at an E/T ratio of 1:2. Shown are IFN-γ levels in cell supernatants of CAR (CD19) T cells or CAR (B2) T cells co-cultured with Hep3B cells. (C) Schematic of the Hep3B xenograft NSG model infused i.p. with five million CAR (B2) T cells and CAR (CD19) T cells after 12 days of tumor inoculation. (D) Representative bioluminescence image of Hep3B tumor growth in the xenograft model. (E) Tumor bioluminescence growth curve. (F) Inducible PD-L1 expression in Hep3B cells co-cultured with GPC3 CAR-T cells at an E/T ratio of 1:2 or 1:1 for 24 h. (G) Strategy of bispecific CAR-T cells and combination CAR-T cells targeting GPC3 and PD-L1. (H) Cytolytic activity of CAR-T cells on Hep3B cells after 24- or 72-h incubation in vitro. (I) TNF-α, IL-2, and IFN-γ concentration in the co-culture supernatant from (H) as measured by ELISA. Values represent mean ± SEM. ∗∗p < 0.01; ∗∗∗p < 0.001; ∗∗∗∗p < 0.0001.
Figure 6
Figure 6
Combination of PD-L1 CAR-T cells and GPC3 CAR-T cells achieved a synergistic anti-tumor effect in vivo (A) Schematic of the Hep3B xenograft NSG model infused i.p. with an equivalent of a total of five million CAR-T cells after 12 days of tumor inoculation. (B) Representative bioluminescence image of Hep3B tumor growth in the xenograft model. (C) Tumor bioluminescence growth curve. (D) At the end of the study, the sizes of tumors in mice from the combination CAR group (mouse 1 mouse) and bispecific group (mouse 2). (E) Absolute CAR-T cell count detected in mouse peripheral blood after 2 weeks of treatment and absolute CAR-T concentration (cells per microliter) ±SD for all evaluated mice in each treatment group. (F) The binding ability of CAR T cells recovered in vitro and in vivo (2 weeks after treatment) to PD-L1 antigen using flow cytometry. (G) The relative proportion of stem cell-like memory (TSCM), central memory (TCM), effector memory (TEM), and terminally differentiated effector memory (TEMRA) cell subsets defined by CD62L, CD45RA, and CD95 expression in CD4+ and CD8+ CAR+ T cell population in mouse blood at week 2 of treatment. (H) Exhaustion marker expression on CD4+ and CD8+ CAR+ T cell populations in mouse blood at week 2 after treatment. (I) Western blotting detects GPC3 and PD-L1 expression in Hep3B tumor xenografts. The expression of GPC3 and PD-L1 in Hep3B GFP (no. 1) and Hep3B (no GFP) IFN-γ cells (no. 2) was normalized by β-actin. The expresssion of GPC3 and PD-L1 in tumor samples (no. 3–9) was nomalized by tumor-specific GFP expression.

Similar articles

Cited by

References

    1. Rosenberg S.A., Restifo N.P., Yang J.C., Morgan R.A., Dudley M.E. Adoptive cell transfer: a clinical path to effective cancer immunotherapy. Nat. Rev. Cancer. 2008;8:299–308. doi: 10.1038/nrc2355. - DOI - PMC - PubMed
    1. Rosenberg S.A., Restifo N.P. Adoptive cell transfer as personalized immunotherapy for human cancer. Science. 2015;348:62–68. doi: 10.1126/science.aaa4967. - DOI - PMC - PubMed
    1. Kochenderfer J.N., Wilson W.H., Janik J.E., Dudley M.E., Stetler-Stevenson M., Feldman S.A., Maric I., Raffeld M., Nathan D.A., Lanier B.J., et al. Eradication of B-lineage cells and regression of lymphoma in a patient treated with autologous T cells genetically engineered to recognize CD19. Blood. 2010;116:4099–4102. doi: 10.1182/blood-2010-04-281931. - DOI - PMC - PubMed
    1. Maher J., Brentjens R.J., Gunset G., Riviere I., Sadelain M. Human T-lymphocyte cytotoxicity and proliferation directed by a single chimeric TCRzeta/CD28 receptor. Nat. Biotechnol. 2002;20:70–75. doi: 10.1038/nbt0102-70. - DOI - PubMed
    1. Imai C., Mihara K., Andreansky M., Nicholson I.C., Pui C.H., Geiger T.L., Campana D. Chimeric receptors with 4-1BB signaling capacity provoke potent cytotoxicity against acute lymphoblastic leukemia. Leukemia. 2004;18:676–684. doi: 10.1038/sj.leu.2403302. - DOI - PubMed