

Pandemic influenza A (H1N1) virus causes abortive infection of primary human T cells
- PMID: 35317717
- PMCID: PMC9045768
- DOI: 10.1080/22221751.2022.2056523
Pandemic influenza A (H1N1) virus causes abortive infection of primary human T cells
Abstract
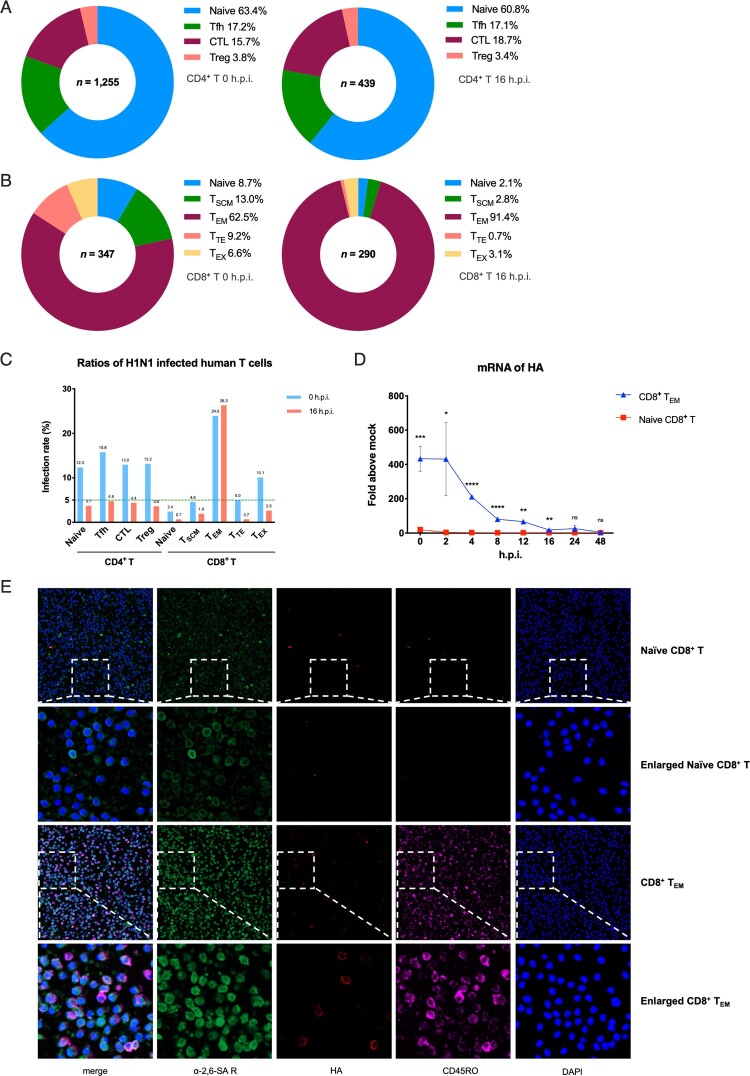
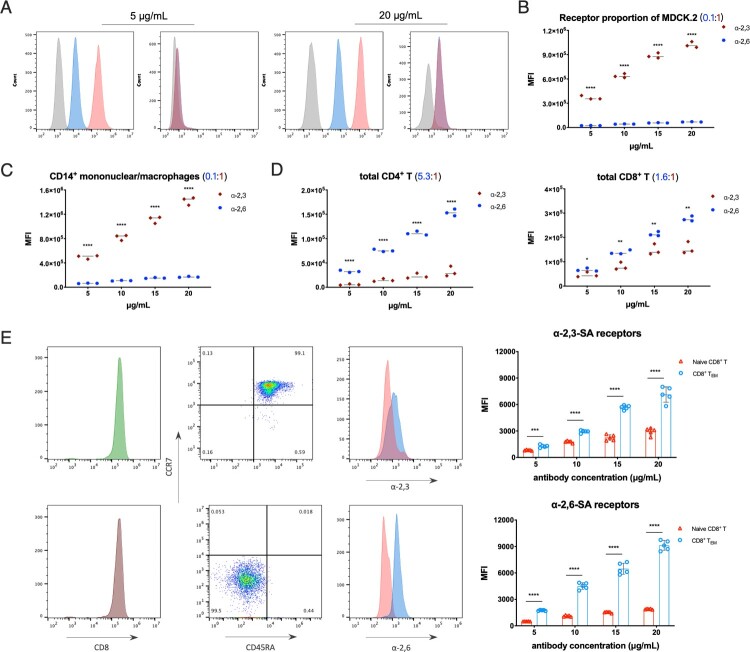
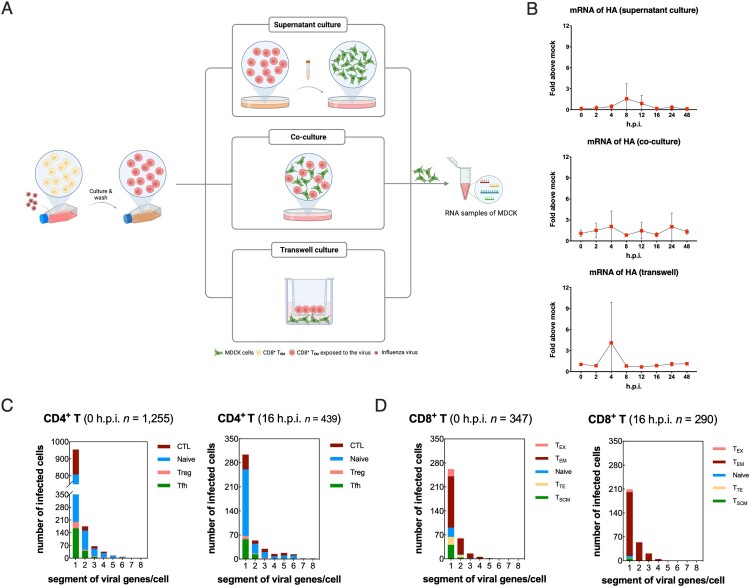
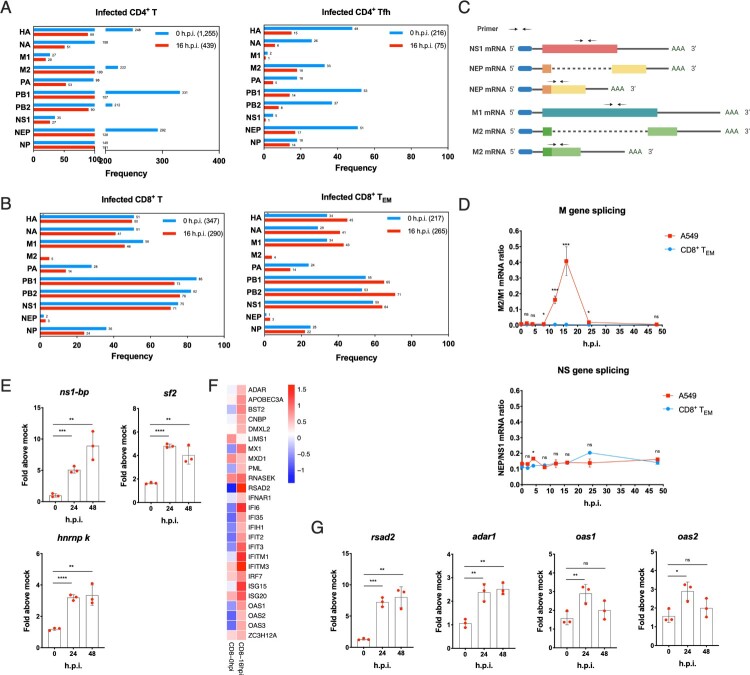
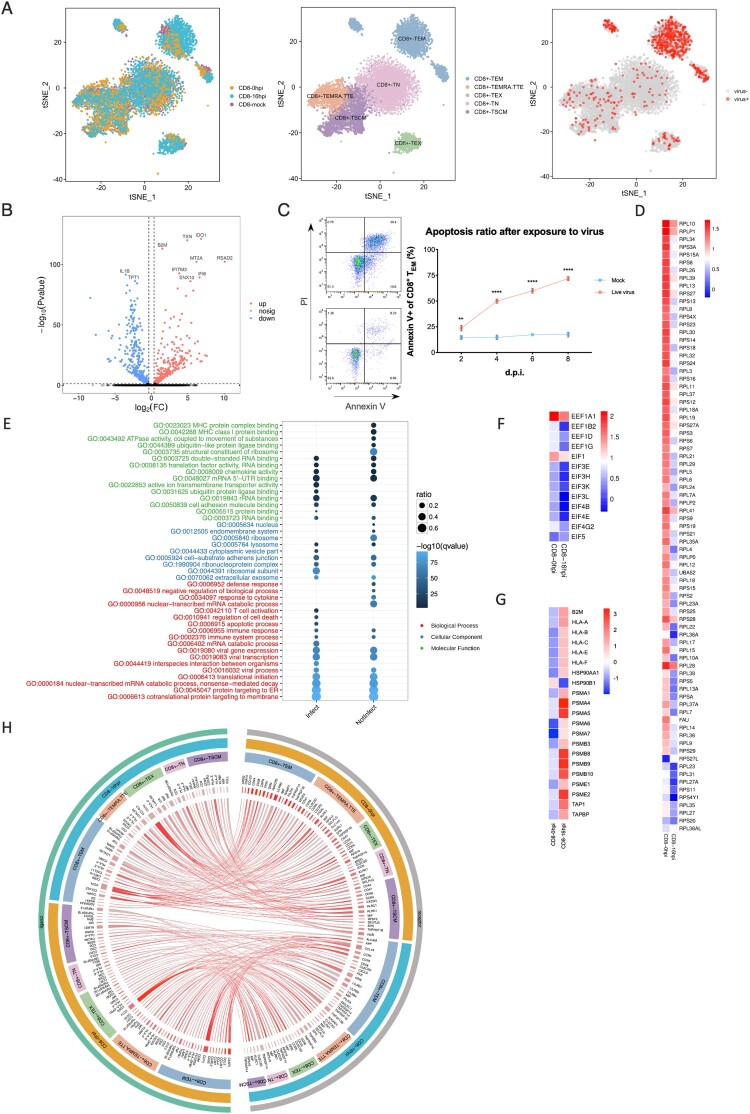
Influenza A virus still represents a noticeable epidemic risk to international public health at present, despite the extensive use of vaccines and anti-viral drugs. In the fight against pathogens, the immune defence lines consisting of diverse lymphocytes are indispensable for humans. However, the role of virus infection of lymphocytes and subsequent abnormal immune cell death remains to be explored. Different T cell subpopulations have distinct characterizations and functions, and we reveal the high heterogeneity of susceptibility to viral infection and biological responses such as apoptosis in various CD4+ T and CD8+ T cell subsets through single-cell transcriptome analyses. Effector memory CD8+ T cells (CD8+ TEM) that mediate protective memory are identified as the most susceptible subset to pandemic influenza A virus infection among primary human T cells. Non-productive infection is established in CD8+ TEM and naïve CD8+ T cells, which indicate the mechanism of intracellular antiviral activities for inhibition of virus replication such as abnormal viral splicing efficiency, incomplete life cycles and up-regulation of interferon-stimulated genes in human T cells. These findings provide insights into understanding lymphopenia and the infectious mechanisms of pandemic influenza A virus and broad immune host-pathogen interactional atlas in primary human T cells.
Keywords: Influenza A virus; abortive infection; primary T cells; single-cell sequencing; virus-host interactions.
Conflict of interest statement
No potential conflict of interest was reported by the author(s).
Figures
Similar articles
-
Oseltamivir Prophylaxis Reduces Inflammation and Facilitates Establishment of Cross-Strain Protective T Cell Memory to Influenza Viruses.PLoS One. 2015 Jun 18;10(6):e0129768. doi: 10.1371/journal.pone.0129768. eCollection 2015. PLoS One. 2015. PMID: 26086392 Free PMC article.
-
Broadly Protective CD8+ T Cell Immunity to Highly Conserved Epitopes Elicited by Heat Shock Protein gp96-Adjuvanted Influenza Monovalent Split Vaccine.J Virol. 2021 May 24;95(12):e00507-21. doi: 10.1128/JVI.00507-21. Print 2021 May 24. J Virol. 2021. PMID: 33827939 Free PMC article.
-
Investigation of CD4 and CD8 T cell-mediated protection against influenza A virus in a cohort study.BMC Med. 2022 Jul 21;20(1):230. doi: 10.1186/s12916-022-02429-7. BMC Med. 2022. PMID: 35858844 Free PMC article.
-
CCR2 Regulates Vaccine-Induced Mucosal T-Cell Memory to Influenza A Virus.J Virol. 2021 Jul 12;95(15):e0053021. doi: 10.1128/JVI.00530-21. Epub 2021 Jul 12. J Virol. 2021. PMID: 33952647 Free PMC article.
-
Recalling the Future: Immunological Memory Toward Unpredictable Influenza Viruses.Front Immunol. 2019 Jul 2;10:1400. doi: 10.3389/fimmu.2019.01400. eCollection 2019. Front Immunol. 2019. PMID: 31312199 Free PMC article. Review.
Cited by
-
Evaluation of disease severity and prediction of severe cases in children hospitalized with influenza A (H1N1) infection during the post-COVID-19 era: a multicenter retrospective study.BMC Pediatr. 2024 Apr 2;24(1):234. doi: 10.1186/s12887-024-04645-x. BMC Pediatr. 2024. PMID: 38566022 Free PMC article.
-
The Enigma of Lymphocyte Apoptosis in the Response to Influenza Virus Infection.Viruses. 2023 Mar 16;15(3):759. doi: 10.3390/v15030759. Viruses. 2023. PMID: 36992468 Free PMC article.
-
Influenza A virus dissemination and infection leads to tissue resident cell injury and dysfunction in viral sepsis.EBioMedicine. 2025 Jun;116:105738. doi: 10.1016/j.ebiom.2025.105738. Epub 2025 May 13. EBioMedicine. 2025. PMID: 40367638 Free PMC article.
-
Predicting the potentially exacerbation of severe viral pneumonia in hospital by MuLBSTA score joint CD4 + and CD8 +T cell counts: construction and verification of risk warning model.BMC Pulm Med. 2024 May 29;24(1):261. doi: 10.1186/s12890-024-03073-y. BMC Pulm Med. 2024. PMID: 38811907 Free PMC article.
-
Angiogenesis during diabetic wound repair: from mechanism to therapy opportunity.Burns Trauma. 2025 Feb 7;13:tkae052. doi: 10.1093/burnst/tkae052. eCollection 2025. Burns Trauma. 2025. PMID: 39927093 Free PMC article. Review.
References
-
- Karlsson Hedestam GB, Fouchier RA, Phogat S, et al. . The challenges of eliciting neutralizing antibodies to HIV-1 and to influenza virus. Nat Rev Microbiol. 2008;6(2):143–145. - PubMed
MeSH terms
Substances
LinkOut - more resources
Full Text Sources
Other Literature Sources
Medical
Research Materials