

Starvation causes changes in the intestinal transcriptome and microbiome that are reversed upon refeeding
- PMID: 35317738
- PMCID: PMC8941736
- DOI: 10.1186/s12864-022-08447-2
Starvation causes changes in the intestinal transcriptome and microbiome that are reversed upon refeeding
Abstract
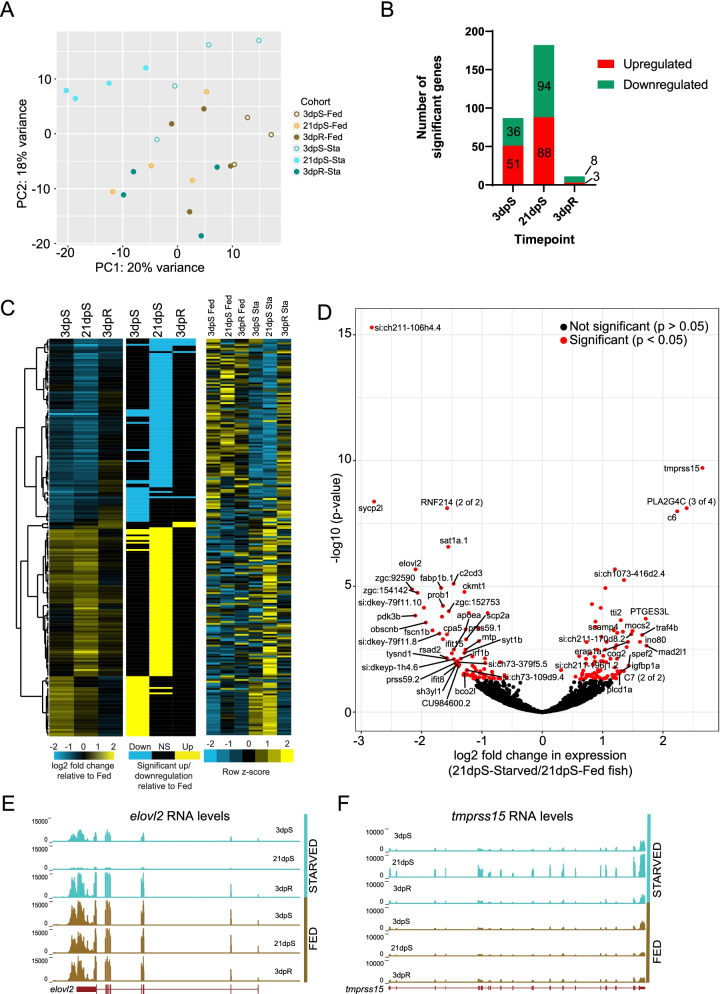
Background: The ability of animals and their microbiomes to adapt to starvation and then restore homeostasis after refeeding is fundamental to their continued survival and symbiosis. The intestine is the primary site of nutrient absorption and microbiome interaction, however our understanding of intestinal adaptations to starvation and refeeding remains limited. Here we used RNA sequencing and 16S rRNA gene sequencing to uncover changes in the intestinal transcriptome and microbiome of zebrafish subjected to long-term starvation and refeeding compared to continuously fed controls.
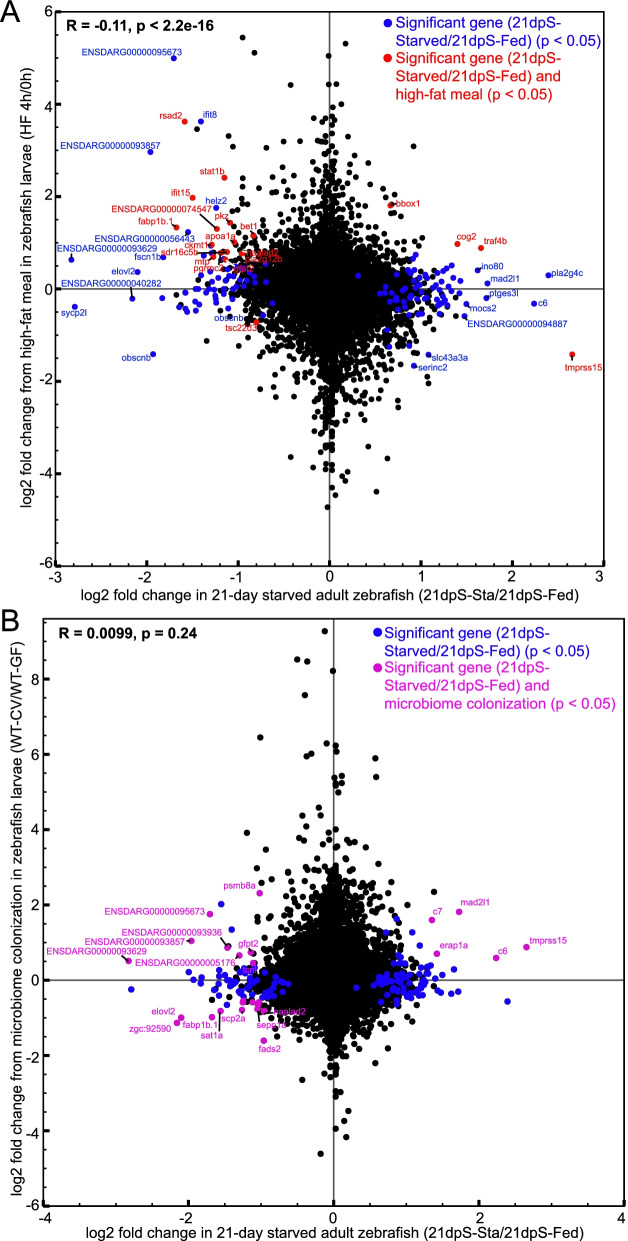
Results: Starvation over 21 days led to increased diversity and altered composition in the intestinal microbiome compared to fed controls, including relative increases in Vibrio and reductions in Plesiomonas bacteria. Starvation also led to significant alterations in host gene expression in the intestine, with distinct pathways affected at early and late stages of starvation. This included increases in the expression of ribosome biogenesis genes early in starvation, followed by decreased expression of genes involved in antiviral immunity and lipid transport at later stages. These effects of starvation on the host transcriptome and microbiome were almost completely restored within 3 days after refeeding. Comparison with published datasets identified host genes responsive to starvation as well as high-fat feeding or microbiome colonization, and predicted host transcription factors that may be involved in starvation response.
Conclusions: Long-term starvation induces progressive changes in microbiome composition and host gene expression in the zebrafish intestine, and these changes are rapidly reversed after refeeding. Our identification of bacterial taxa, host genes and host pathways involved in this response provides a framework for future investigation of the physiological and ecological mechanisms underlying intestinal adaptations to food restriction.
© 2022. The Author(s).
Conflict of interest statement
The authors declare that they have no competing interests.
Figures


Similar articles
-
The intestinal microbiome of fish under starvation.BMC Genomics. 2014 Apr 5;15:266. doi: 10.1186/1471-2164-15-266. BMC Genomics. 2014. PMID: 24708260 Free PMC article.
-
Effect of starvation and refeeding on growth, gut microbiota and non-specific immunity in hybrid grouper (Epinephelus fuscoguttatus♀×E. lanceolatus♂).Fish Shellfish Immunol. 2020 Feb;97:182-193. doi: 10.1016/j.fsi.2019.11.055. Epub 2019 Nov 29. Fish Shellfish Immunol. 2020. PMID: 31790749
-
Feeding Rapidly Alters Microbiome Composition and Gene Transcription in the Clownfish Gut.Appl Environ Microbiol. 2019 Jan 23;85(3):e02479-18. doi: 10.1128/AEM.02479-18. Print 2019 Feb 1. Appl Environ Microbiol. 2019. PMID: 30446559 Free PMC article.
-
A metagenomic study of diet-dependent interaction between gut microbiota and host in infants reveals differences in immune response.Genome Biol. 2012 Apr 30;13(4):r32. doi: 10.1186/gb-2012-13-4-r32. Genome Biol. 2012. PMID: 22546241 Free PMC article.
-
Diet, Immunity, and Microbiota Interactions: An Integrative Analysis of the Intestine Transcriptional Response and Microbiota Modulation in Gilthead Seabream (Sparus aurata) Fed an Essential Oils-Based Functional Diet.Front Immunol. 2021 Mar 4;12:625297. doi: 10.3389/fimmu.2021.625297. eCollection 2021. Front Immunol. 2021. PMID: 33746962 Free PMC article.
Cited by
-
An Integrated Bioinformatics Approach to Identify Network-Derived Hub Genes in Starving Zebrafish.Animals (Basel). 2022 Oct 10;12(19):2724. doi: 10.3390/ani12192724. Animals (Basel). 2022. PMID: 36230465 Free PMC article.
-
Gut microbiome resilience of green-lipped mussels, Perna canaliculus, to starvation.Int Microbiol. 2024 Apr;27(2):571-580. doi: 10.1007/s10123-023-00397-3. Epub 2023 Jul 31. Int Microbiol. 2024. PMID: 37523041 Free PMC article.
-
Gut physiology of rainbow trout (Oncorhynchus mykiss) is influenced more by short-term fasting followed by refeeding than by feeding fishmeal-free diets.Fish Physiol Biochem. 2024 Jun;50(3):1281-1303. doi: 10.1007/s10695-024-01339-0. Epub 2024 Apr 16. Fish Physiol Biochem. 2024. PMID: 38625479 Free PMC article.
-
Non-targeted metabolomics revealed the effect of starvation to juvenile Onychostoma sima liver.Fish Physiol Biochem. 2025 May 14;51(3):96. doi: 10.1007/s10695-025-01507-w. Fish Physiol Biochem. 2025. PMID: 40366427
-
Compositional Dynamics of Gastrointestinal Tract Microbiomes Associated with Dietary Transition and Feeding Cessation in Lake Sturgeon Larvae.Microorganisms. 2022 Sep 19;10(9):1872. doi: 10.3390/microorganisms10091872. Microorganisms. 2022. PMID: 36144474 Free PMC article.
References
-
- Watts, M. J. & Bohle, H. G. The space of vulnerability: the causal structure of hunger and famine: Progress in Human Geography (2016) doi:10.1177/030913259301700103.
-
- Fearon K, et al. Definition and classification of cancer cachexia: an international consensus. Lancet Oncol. 2011;12:489–495. - PubMed
-
- Nagy K. Food requirements of wild animals: predictive equations for free-living mammals, reptiles, and birds. 2018.
-
- McCue MD. Starvation physiology: reviewing the different strategies animals use to survive a common challenge. Comp Biochem Physiol A Mol Integr Physiol. 2010;156:1–18. - PubMed
-
- Storey KB, Storey JM. Metabolic Rate Depression and Biochemical Adaptation in Anaerobiosis. Hibernation and Estivation. Quarterly Review Biol. 1990;65:145–174. - PubMed
MeSH terms
Substances
Grants and funding
LinkOut - more resources
Full Text Sources
Molecular Biology Databases
