

Variation in intraspecific demography drives localised concordance but species-wide discordance in response to past climatic change
- PMID: 35317750
- PMCID: PMC8941757
- DOI: 10.1186/s12862-022-01990-2
Variation in intraspecific demography drives localised concordance but species-wide discordance in response to past climatic change
Abstract
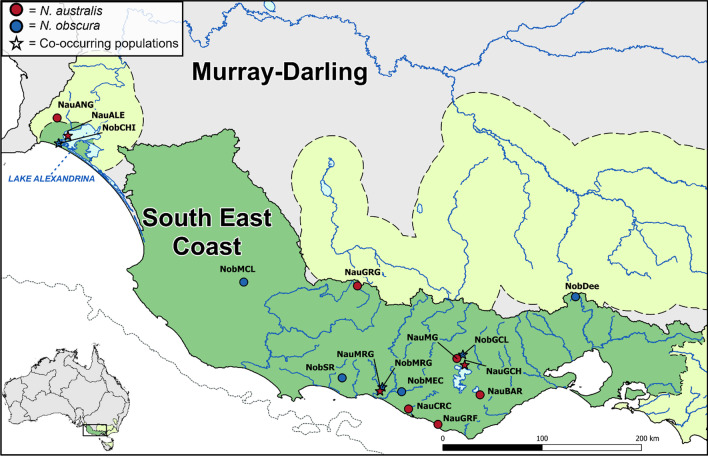
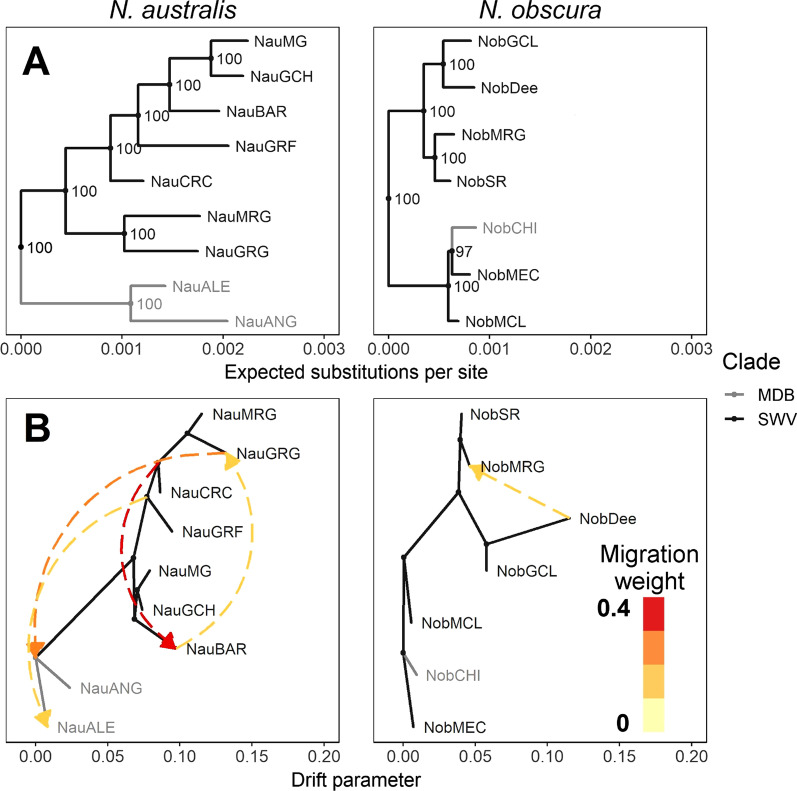
Background: Understanding how species biology may facilitate resilience to climate change remains a critical factor in detecting and protecting species at risk of extinction. Many studies have focused on the role of particular ecological traits in driving species responses, but less so on demographic history and levels of standing genetic variation. Additionally, spatial variation in the interaction of demographic and adaptive factors may further complicate prediction of species responses to environmental change. We used environmental and genomic datasets to reconstruct the phylogeographic histories of two ecologically similar and largely co-distributed freshwater fishes, the southern (Nannoperca australis) and Yarra (N. obscura) pygmy perches, to assess the degree of concordance in their responses to Plio-Pleistocene climatic changes. We described contemporary genetic diversity, phylogenetic histories, demographic histories, and historical species distributions across both species, and statistically evaluated the degree of concordance in co-occurring populations.
Results: Marked differences in contemporary genetic diversity, historical distribution changes and historical migration were observed across the species, with a distinct lack of genetic diversity and historical range expansion suggested for N. obscura. Although several co-occurring populations within a shared climatic refugium demonstrated concordant demographic histories, idiosyncratic population size changes were found at the range edges of the more spatially restricted species. Discordant responses between species were associated with low standing genetic variation in peripheral populations. This might have hindered adaptive potential, as documented in recent demographic declines and population extinctions for the two species.
Conclusion: Our results highlight both the role of spatial scale in the degree of concordance in species responses to climate change, and the importance of standing genetic variation in facilitating range shifts. Even when ecological traits are similar between species, long-term genetic diversity and historical population demography may lead to discordant responses to ongoing and future climate change.
Keywords: Biogeography; Coalescent analysis; Comparative phylogeography; Percichthyidae; Temperate Australia.
© 2022. The Author(s).
Conflict of interest statement
The authors have no competing interests to declare.
Figures


Similar articles
-
Long-term climatic stability drives accumulation and maintenance of divergent freshwater fish lineages in a temperate biodiversity hotspot.Heredity (Edinb). 2024 Sep;133(3):149-159. doi: 10.1038/s41437-024-00700-6. Epub 2024 Jun 25. Heredity (Edinb). 2024. PMID: 38918613 Free PMC article.
-
A phylogenetic analysis of pygmy perches (Teleostei: Percichthyidae) with an assessment of the major historical influences on aquatic biogeography in southern Australia.Syst Biol. 2011 Dec;60(6):797-812. doi: 10.1093/sysbio/syr042. Epub 2011 May 5. Syst Biol. 2011. PMID: 21551126
-
Discordant Pleistocene population size histories in a guild of hymenopteran parasitoids.Mol Ecol. 2021 Sep;30(18):4538-4550. doi: 10.1111/mec.16074. Epub 2021 Aug 2. Mol Ecol. 2021. PMID: 34252238
-
Problems and Cautions With Sequence Mismatch Analysis and Bayesian Skyline Plots to Infer Historical Demography.J Hered. 2015 Jul-Aug;106(4):333-46. doi: 10.1093/jhered/esv020. Epub 2015 Apr 29. J Hered. 2015. PMID: 25926628 Review.
-
Integrating Spatial Analyses of Genomic and Physiological Data to Understand Avian Responses to Environmental Change.Integr Comp Biol. 2024 Dec 20;64(6):1792-1810. doi: 10.1093/icb/icae059. Integr Comp Biol. 2024. PMID: 38830811 Review.
Cited by
-
How individual variation shapes ecological niches in two Pipistrellus bat species.Commun Biol. 2025 Mar 27;8(1):503. doi: 10.1038/s42003-025-07948-6. Commun Biol. 2025. PMID: 40148495 Free PMC article.
References
-
- Travis JMJ, Delgado M, Bocedi G, Baguette M, Bartoń K, Bonte D, Boulangeat I, Hodgson JA, Kubisch A, Penteriani V, et al. Dispersal and species’ responses to climate change. Oikos. 2013;122(11):1532–1540. doi: 10.1111/j.1600-0706.2013.00399.x. - DOI
-
- Pearson RG, Stanton JC, Shoemaker KT, Aiello-Lammens ME, Ersts PJ, Horning N, Fordham DA, Raxworthy CJ, Ryu HY, McNees J, et al. Life history and spatial traits predict extinction risk due to climate change. Nat Clim Chang. 2014;4(3):217–221. doi: 10.1038/nclimate2113. - DOI
Publication types
MeSH terms
LinkOut - more resources
Full Text Sources
Miscellaneous