. 2022 Mar 23;20(1):70.
doi: 10.1186/s12915-022-01270-x.

A comparative methylome analysis reveals conservation and divergence of DNA methylation patterns and functions in vertebrates

Affiliations

A comparative methylome analysis reveals conservation and divergence of DNA methylation patterns and functions in vertebrates

Hala Al Adhami et al. BMC Biol. .

Abstract

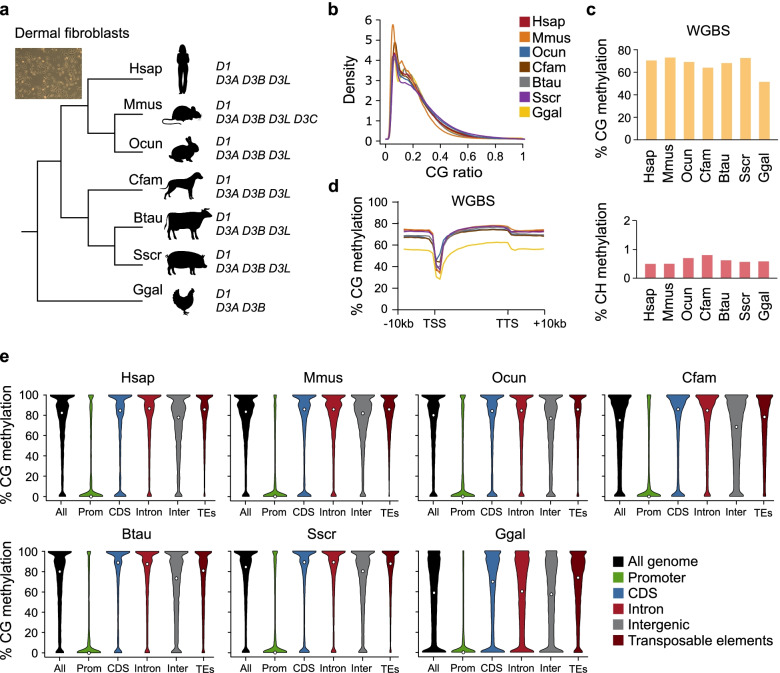
Background: Cytosine DNA methylation is a heritable epigenetic mark present in most eukaryotic groups. While the patterns and functions of DNA methylation have been extensively studied in mouse and human, their conservation in other vertebrates remains poorly explored. In this study, we interrogated the distribution and function of DNA methylation in primary fibroblasts of seven vertebrate species including bio-medical models and livestock species (human, mouse, rabbit, dog, cow, pig, and chicken).

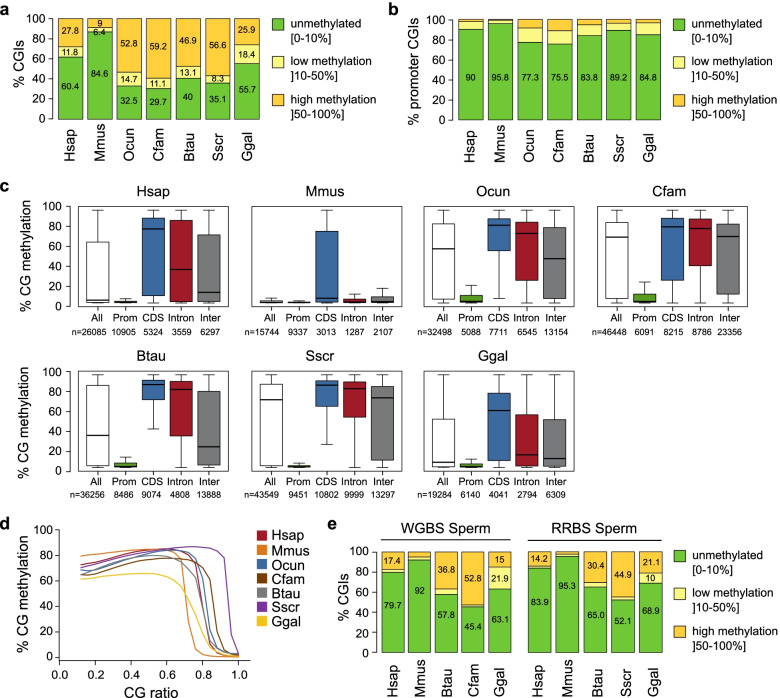
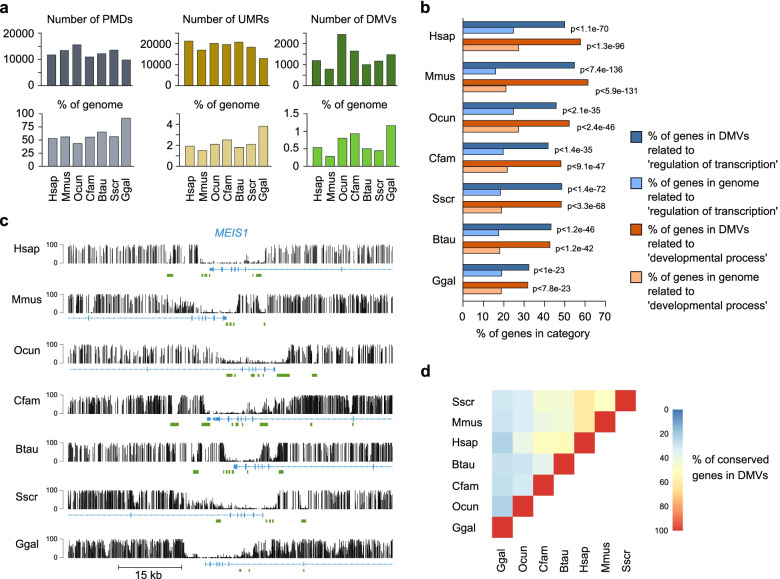
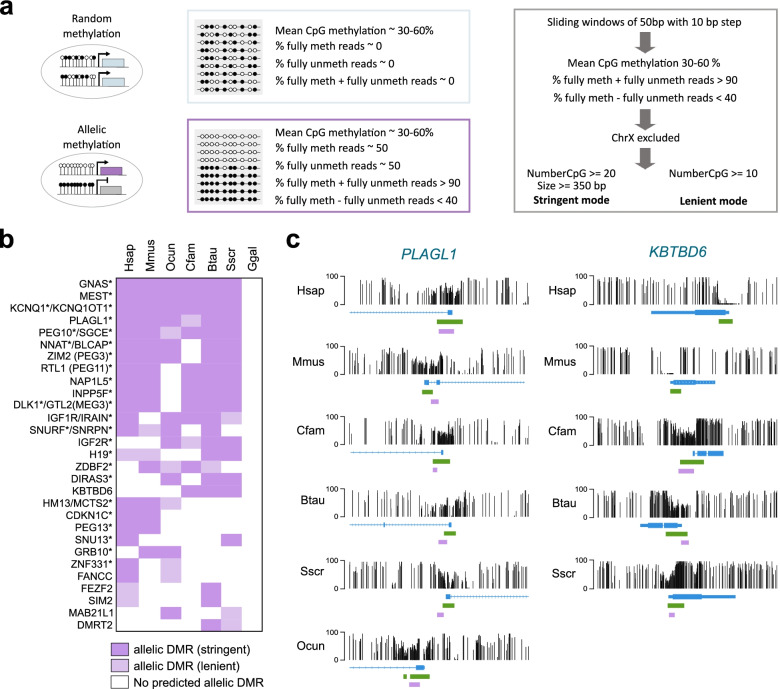
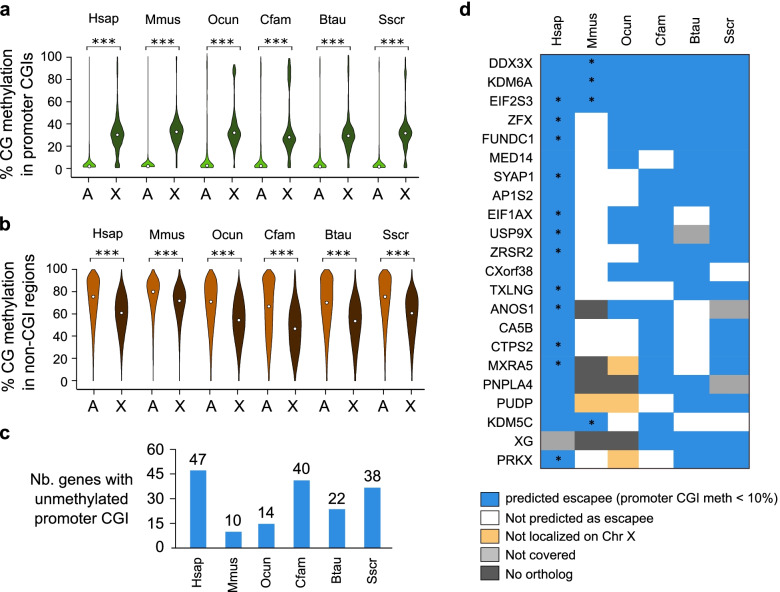
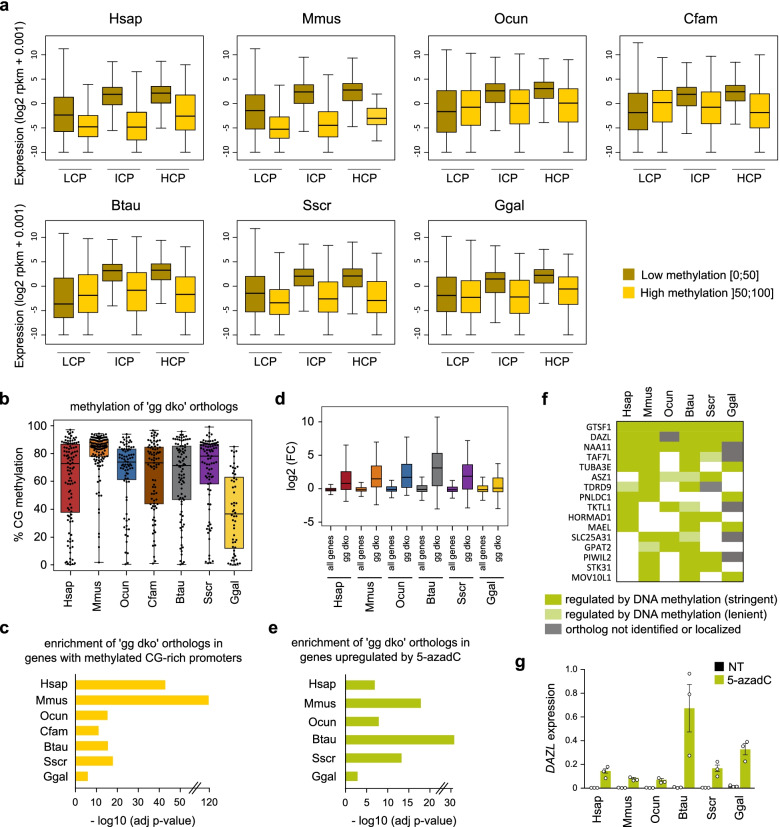
Results: Our data highlight both divergence and conservation of DNA methylation patterns and functions. We show that the chicken genome is hypomethylated compared to other vertebrates. Furthermore, compared to mouse, other species show a higher frequency of methylation of CpG-rich DNA. We reveal the conservation of large unmethylated valleys and patterns of DNA methylation associated with X-chromosome inactivation through vertebrate evolution and make predictions of conserved sets of imprinted genes across mammals. Finally, using chemical inhibition of DNA methylation, we show that the silencing of germline genes and endogenous retroviruses (ERVs) are conserved functions of DNA methylation in vertebrates.

Conclusions: Our data highlight conserved properties of DNA methylation in vertebrate genomes but at the same time point to differences between mouse and other vertebrate species.

Keywords: 5mC; CpG island; DNA methylation; Genomic imprinting; Germline genes; Vertebrates.


Conflict of interest statement

The authors declare that they have no competing interests.

Figures

Fig. 1
Fig. 1
Single-base methylomes in primary dermal fibroblasts of seven vertebrate species. a Phylogenetic relationships between the studied species. For each species, we indicate whether the genome contains an annotated DNMT1 (D1), DNMT3A (D3A), DNMT3B (D3B) and DNMT3L (D3L) gene. b Density plot of the distribution of CG ratios (CpG observed/expected) calculated in 0.5 kb genomic sliding windows. c Average methylation of CG (upper panel) and CH (lower panel) sites with at least 5 unique reads in WGBS datasets generated from dermal fibroblasts. d Metaplot of CG methylation levels over Ensembl genes and 10 kb flanking sequences calculated from the WGBS datasets in dermal fibroblasts. TSS: Transcription start site, TTS: Transcription termination site. e Violin plots of WGBS CG methylation levels in different genomic features in dermal fibroblasts. Median values are indicated by white circles
Fig. 2
Fig. 2
Comparison of DNA methylation of CG-rich regions in vertebrates. a, b Stacked bar graphs representing the proportions of CGIs (a) and promoter-CGIs (b) classified according to their mean CG methylation in dermal fibroblasts. The percent values are indicated on the graphs. c Box plots of the mean CG methylation of CGIs overlapping promoters (prom), coding sequences (CDS), introns or intergenic regions (inter) in dermal fibroblasts. The line in the boxplots indicates the median, the box limits indicate the upper and lower quartiles, and the whiskers extend to 1.5 IQR from the quartiles. The numbers of CGIs in each category are indicated below the graphs. d Median values of the methylation in 0.5 kb genomic windows according to their CG ratio. e Stacked bar graphs representing the proportions of CGIs classified according to their mean CG methylation in sperm samples. Data from WGBS and RRBS libraries are shown
Fig. 3
Fig. 3
Conservation of DNA Methylation Valleys (DMVs) across vertebrates. a Bar graphs showing the number of identified PMDs, UMRs and DMVs (UMR >= 5kb) and the percentage of the genome covered by each feature in dermal fibroblasts of the seven studied species. b Gene ontology analysis of genes located in DMVs. The graph shows the enrichments of ontology terms 'regulation of transcription' and 'developmental process' in DMV-associated genes compared to all genes (p value: hypergeometric test). c Genome browser snapshots of WGBS methylation scores showing a conserved DMV overlapping the MEIS1 gene in dermal fibroblasts of the seven species. Each WGBS track shows the percent methylation of individual CpGs between 0 and 100%. CpG islands (green rectangles) and Ensembl gene annotations are shown below the tracks. d Analysis of the overlap of genes located in DMVs in fibroblasts across the seven vertebrate species. Each square in the heatmap represents the percentage of common genes associated with DMVs between two species. Details about the calculation are provided in the Methods section
Fig. 4
Fig. 4
Prediction of imprinted DMRs in mammals using WGBS data. a Description of the pipeline used to detect potential imprinted DMRs using WGBS data. To differentiate allelic from partial random methylation, we use single read methylation scores to identify regions that contain a mixture of fully methylated and fully unmethylated reads. We applied a stringent mode to identify regions larger than 350 bp with a minimum of 20 CpGs, and a lenient mode to identify regions with a minimum of 10 CpGs. b Top ranked genes associated with predicted allelic DMRs in fibroblast in stringent and lenient mode in at least 2 species. Asterisks indicate genes previously known to be imprinted in human or mouse. c Genome browser snapshots of WGBS profiles over the PLAGL1 (left panel) and KBTBD6 (right panel) genes in dermal fibroblasts of 6 mammalian species. KBTBD6 is not shown in the rabbit because of lack of gene annotation. CpG islands (green rectangles), predicted DMRs (purple rectangles) and Ensembl or Refseq gene annotations are shown below the tracks
Fig. 5
Fig. 5
Conserved DNA methylation signature of X chromosome inactivation in mammals. a Violin plots of CG methylation scores of promoter-CGIs measured by WGBS in dermal fibroblasts across autosomes (A) or the X chromosome (X) in mammalian species. Median values are indicated by white circles. ***: p-value < 0.001 (Wilcoxon test). b Violin plots of CG methylation scores of 1 kb genomic tiles (excluding CGIs) measured by WGBS in dermal fibroblasts across autosomes (A) or the X chromosome (X) in mammalian species. Median values are indicated by white circles. ***: p-value < 0.001 (Wilcoxon test). c Number of X-linked genes with an unmethylated promoter CGI (methylation < 10%), predicted to escape XCI, identified in each species. d Table of genes predicted to escape XCI in at least 3 species. Asterisks indicate genes previously shown as escapees in human and mouse
Fig. 6
Fig. 6
Impact of promoter DNA methylation on gene expression in vertebrates. a Boxplots showing gene expression scores (rpkm) depending on the level of promoter DNA methylation for genes with LCP, ICP or HCP promoters in each species. b Boxplots of promoter DNA methylation scores in fibroblasts for the previously identified list of germline genes upregulated in Dnmt3a/3b double knockout embryos (termed 'gg dko' genes). For the species other than mouse, orthologs of mouse 'gg dko' genes are shown. c Enrichment of 'gg dko' orthologs among genes with methylated CG-rich promoters in fibroblasts for each species. The graph shows the associated adjusted p-values (-log10) calculated by hypergeometric tests. d Boxplots of the fold change (FC) of gene expression of 'gg dko' orthologs compared to all genes after 5-azadC treatment in fibroblasts. e Enrichment of 'gg dko' orthologs among genes upregulated by 5-azadC in each species. The graph shows adjusted p-values (-log10) calculated by hypergeometric tests. f Table showing germline genes upregulated by 5-azadC in at least 3 vertebrate species. The stringent mode corresponds to genes with a methylated promoter in control condition (> 50%), a fold change upon 5-azadC treatment > 3 and an adjusted p-value < 0.01. The lenient mode corresponds to less stringent cut-offs on promoter DNA methylation (> 25%) or fold change upon 5-azadC treatment (> 2). Genes in white did not pass the previous criteria. g RT-qPCR quantification of the expression of the DAZL gene in dermal fibroblasts treated with 5-azadC for 72h compared to untreated fibroblasts (NT). The expression was normalized to two housekeeping genes (Gusb and Mrpl32) (mean ± SEM, n=3 independent experiments). In the boxplots, the line indicates the median, the box limits indicate the upper and lower quartiles, and the whiskers extend to 1.5 IQR from the quartiles in a, d or to the data extremes in b

Similar articles

Cited by

References

    1. Zemach A, McDaniel IE, Silva P, Zilberman D. Genome-wide evolutionary analysis of eukaryotic DNA methylation. Science. 2010;328:916–919. - PubMed
    1. Suzuki MM, Bird A. DNA methylation landscapes: provocative insights from epigenomics. Nat Rev Genet. 2008;9:465–476. - PubMed
    1. Ziller MJ, Muller F, Liao J, Zhang Y, Gu H, Bock C, Boyle P, Epstein CB, Bernstein BE, Lengauer T, et al. Genomic distribution and inter-sample variation of non-CpG methylation across human cell types. PLoS Genet. 2011;7:e1002389. - PMC - PubMed
    1. Bird AP. DNA methylation and the frequency of CpG in animal DNA. Nucleic Acids Res. 1980;8:1499–1504. - PMC - PubMed
    1. Deaton AM, Bird A. CpG islands and the regulation of transcription. Genes Dev. 2011;25:1010–1022. - PMC - PubMed

Publication types