. 2022 Apr 19;121(8):1381-1394.
doi: 10.1016/j.bpj.2022.03.021. Epub 2022 Mar 19.

Distinct timing of neutrophil spreading and stiffening during phagocytosis

Affiliations

Distinct timing of neutrophil spreading and stiffening during phagocytosis

Alexandra Zak et al. Biophys J. .

Abstract

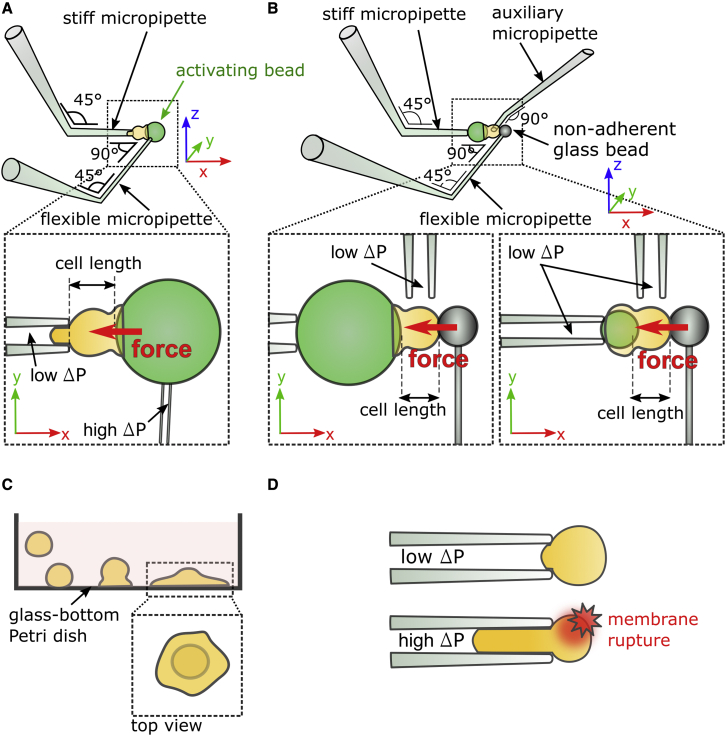
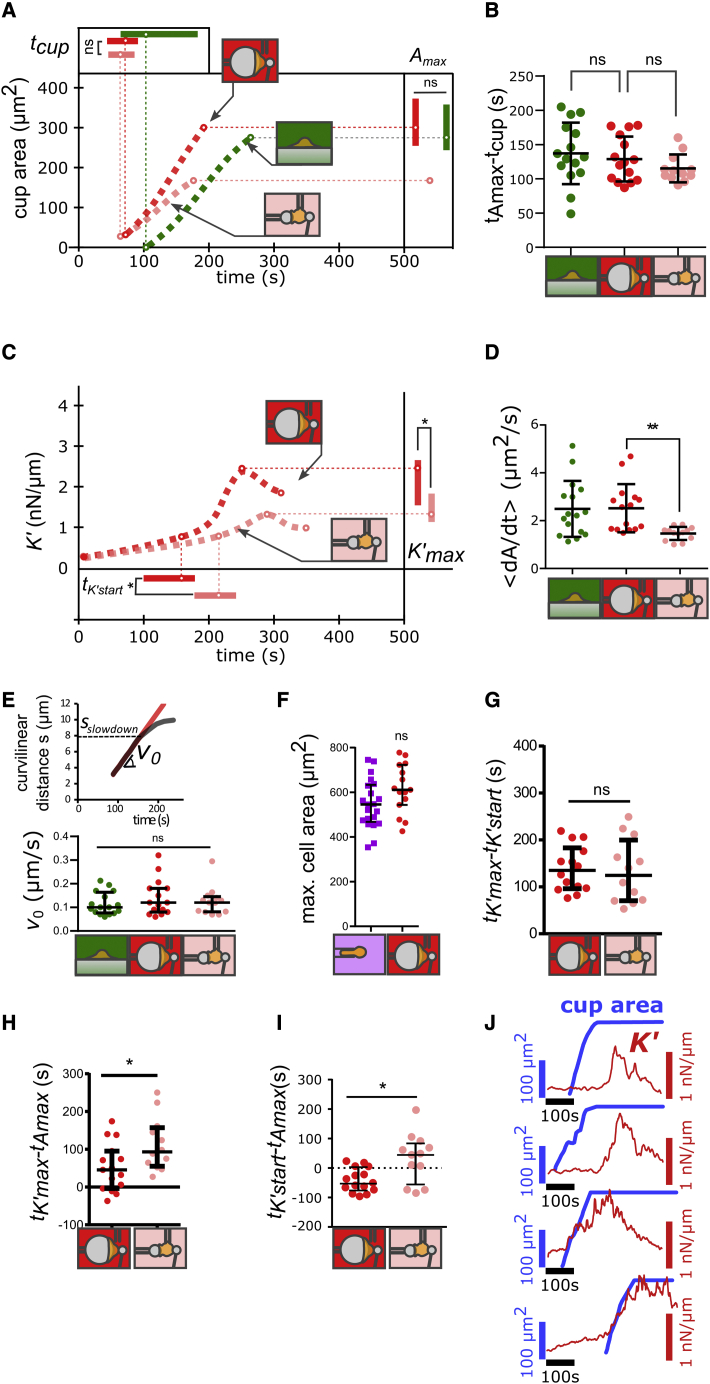
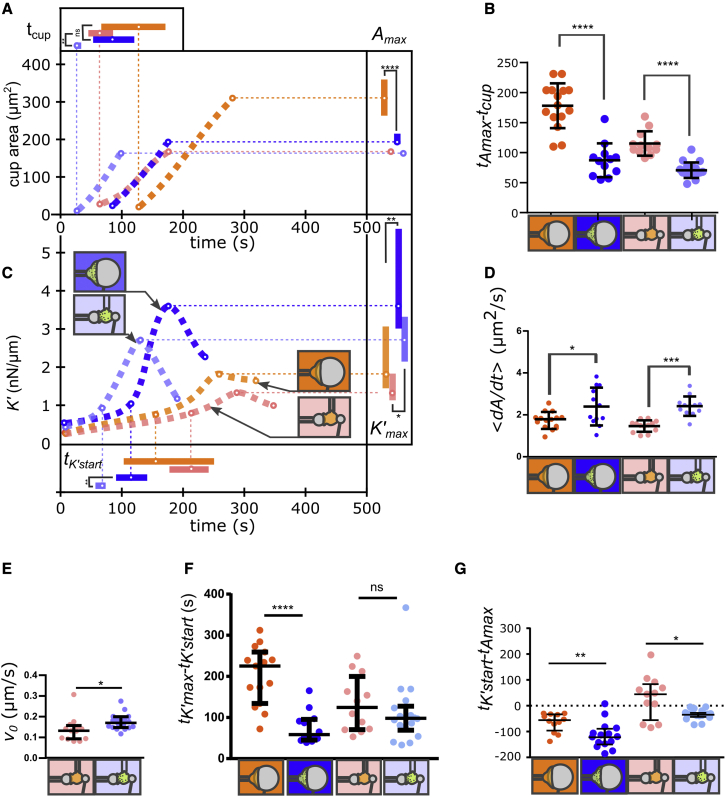
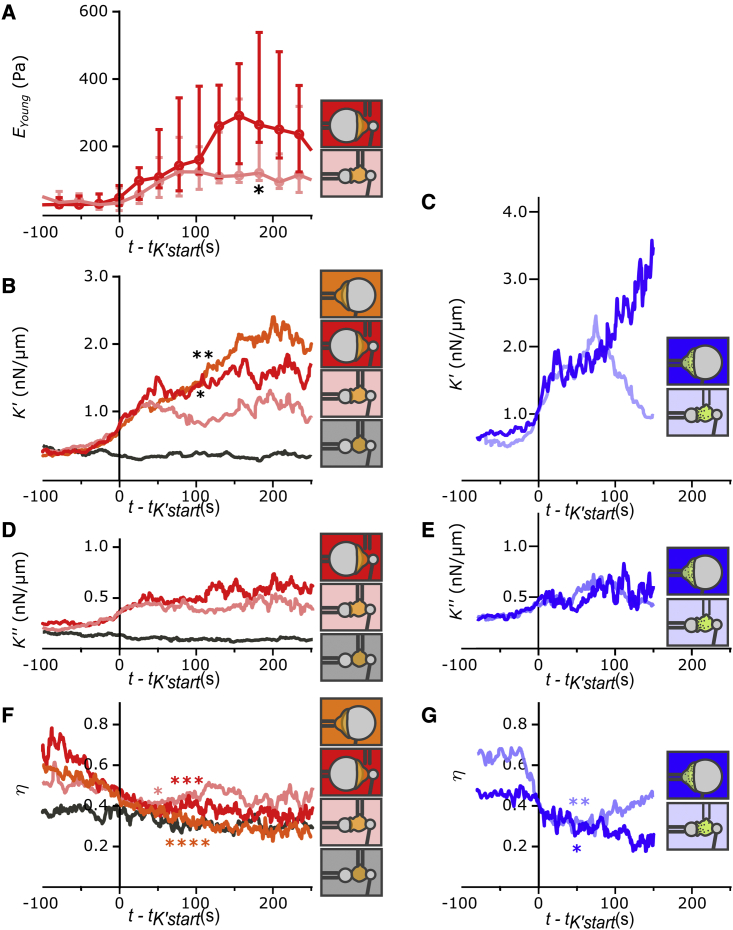
Phagocytic cells form the first line of defense in an organism, engulfing microbial pathogens. Phagocytosis involves cell mechanical changes that are not yet well understood. Understanding these mechanical modifications promises to shed light on the immune processes that trigger pathological complications. Previous studies showed that phagocytes undergo a sequence of spreading events around their target followed by an increase in cell tension. Seemingly in contradiction, other studies observed an increase in cell tension concomitant with membrane expansion. Even though phagocytes are viscoelastic, few studies have quantified viscous changes during phagocytosis. It is also unclear whether cell lines behave mechanically similarly to primary neutrophils. We addressed the question of simultaneous versus sequential spreading and mechanical changes during phagocytosis by using immunoglobulin-G-coated 8- and 20-μm-diameter beads as targets. We used a micropipette-based single-cell rheometer to monitor viscoelastic properties during phagocytosis by both neutrophil-like PLB cells and primary human neutrophils. We show that the faster expansion of PLB cells on larger beads is a geometrical effect reflecting a constant advancing speed of the phagocytic cup. Cells become stiffer on 20- than on 8-μm beads, and the relative timing of spreading and stiffening of PLB cells depends on target size: on larger beads, stiffening starts before maximal spreading area is reached but ends after reaching maximal area. On smaller beads, the stiffness begins to increase after cells have engulfed the bead. Similar to PLB cells, primary cells become stiffer on larger beads but start spreading and stiffen faster, and the stiffening begins before the end of spreading on both bead sizes. Our results show that mechanical changes in phagocytes are not a direct consequence of cell spreading and that models of phagocytosis should be amended to account for causes of cell stiffening other than membrane expansion.


Figures

Figure 1
Figure 1
Experimental techniques. (A) Setup to indent cells at the “front.” Left inset: a compressive force (red arrow) is exerted against the cell while it is phagocyting a 20-μm activating bead (represented in green) tightly held by a flexible micropipette. The cell length is recorded during the experiments. (B) Setup to indent cells at the “back.” Left inset: a 20-μm activating microbead is held by a stiff micropipette. A compressive force is exerted at the back of the cell with a non-adherent glass bead located at the tip of a flexible micropipette. Right inset: an 8-μm activating microbead is held by a stiff micropipette with a low aspiration pressure ΔP ∼20 Pa. With this setup and bead size, cells can perform complete phagocytosis. (C) Frustrated phagocytosis on IgG-coated flat surfaces seen from the side. Inset: top view of a cell during frustrated phagocytosis. (D) Passive aspiration of a neutrophil into a stiff micropipette. A cell is first gently held (with a low aspiration pressure ΔP ∼20 Pa) and then aspirated under high aspiration pressure (ΔP ∼ 500 Pa) until the cell membrane breaks as reported by an increase in fluorescence level of propidium iodide (red star). To see this figure in color, go online.
Figure 2
Figure 2
Spreading and stiffening of PLB cells during phagocytosis. (A) Phagocytic cup area as a function of time following cell-substrate contact for PLB cells. Dotted lines are a guide to the eye, but circles on the lines are median values, and error bars on top and right are interquartile ranges. Raw data are shown in Figs. S6–S11. Each condition is represented by a drawing: back indentation of PLB cells during phagocytosis of 20-μm beads (red; N = 3, n = 15 cells) and 8-μm beads (pink, N = 3, n = 12 cells), and frustrated phagocytosis on flat surfaces (green; N = 3, n = 16 cells, a condition where K′ was not quantified). Inset on the right: maximal phagocytic cup area Amax. Inset on top: time tcup (relative to cell-substrate contact) when cells start forming a phagocytic cup. (B) Delay between the beginning of the cup formation (tcup) and the time at which the phagocytic cup reaches its maximal area (tAmax). (C) Cell stiffness K′ as a function of time following cell-substrate contact for PLB cells. Curves are a guide to the eye, but dots on the curves are median values. Each condition is represented by a drawing: back indentation of PLB cells during phagocytosis of 20-μm beads (red; N = 3, n = 15 cells) and 8-μm beads (pink, N = 3, n = 12 cells). Inset on the right: maximal value of K′, K’max. Inset at the bottom: time tK’start (relative to cell-substrate contact) when K′ starts increasing faster. (D) Average spreading rate of the phagocytic cup dAdt=AmaxAinittAmaxtcup, where Ainit is the initial area of the phagocytic cup. (E) Initial speed v0=dsdt of the cup front during spreading. Inset on top: example of time evolution of the curvilinear abscissa s of the front of a PLB cell during the phagocytosis of a 20-μm bead. During indentation in the back of the cell, s slows down when reaching a level s = sslowdown. (F) Maximal total cell area as measured using micropipette aspiration (purple squares) and during frustrated phagocytosis on 20-μm beads during back indentation (red squares), both for PLB cells. (G) Duration of cell stiffening, tK’max- tK’start. (H) Difference between tK’max and tAmax. This difference is positive if K′ reaches its maximum after the phagocytic cup had already reached its maximal area. (I) Difference between tK’start and tAmax. This difference is positive if K′ starts increasing after the phagocytic cup had already reached its maximal area. (J) Examples of different relative time of cell spreading (phagocytic cup area in thick blue line) and stiffening (cell stiffness K′ in red thin line) during phagocytosis (indentation in the back of PLB cells phagocyting 8-μm beads). In (A)(I), lines are median values, and error bars are interquartile ranges. Statistical tests in (A) and (F): Kolmogorov-Smirnov test (p < 0.05, ∗∗p < 0.01). Statistical tests in (B)(E) and (G)(I): two-tailed Mann-Whitney (p < 0.05, ∗∗p < 0.01). To see this figure in color, go online.
Figure 3
Figure 3
Comparison of PLB cells and primary neutrophils. (A) Phagocytic cup area as a function of time following cell-substrate contact. Dotted lines are a guide to the eye, but circles on the lines are median values, and error bars on top and right are interquartile ranges. Added data for primary neutrophils (blue) are back indentation during phagocytosis of 20-μm beads (dark blue in A–G; N = 2, n = 15 cells) and 8-μm beads (light blue in A–G; N = 2, n = 13 cells). Inset on the right: maximal phagocytic cup area Amax. Inset on top: time tcup (relative to cell-substrate contact) at which cells start forming a phagocytic cup. Raw data are shown in Figs. S6–S11. (B) Delay tAmax- tcup between the beginning of the cup formation (tcup) and the time at which the phagocytic cup reaches its maximal area (tAmax). (C) Cell stiffness K′ as a function of time following cell-substrate contact. Curves are a guide to the eye, but dots on the curves are median values. Each condition is represented by a drawing: back indentation of 20- and 8-μm beads for PLB cells and primary neutrophils. Inset on the right: maximal value of K′, K’max. Inset at the bottom: time tK’start (relative to cell-substrate contact) when K′ starts increasing faster. (D) Average spreading rate of the phagocytic cup dAdt=AmaxAinittAmaxtcup, where Ainit is the initial area of the phagocytic cup. (E) Initial speed v0=dsdt of the cup front during spreading. (F) Duration of cell stiffening, tK’max- tK’start. (G) Difference between tK’start and tAmax. This difference is positive if K′ starts increasing after the phagocytic cup had already reached its maximal area. In (A)–(G), median values are shown with interquartile ranges. Statistical tests in (A) and (C): Kolmogorov-Smirnov test (p < 0.05). Statistical tests in (B) and (D)–(G): two-tailed Mann-Whitney (p < 0.05, ∗∗p < 0.01, ∗∗∗p < 0.001, ∗∗∗∗p < 0.0001). To see this figure in color, go online.
Figure 4
Figure 4
Viscoelastic behavior during both complete and frustrated phagocytosis when indenting PLB cells (A, B, D, and F) and primary neutrophils (C, E, and G). Indentation in the front, back, and on 20- or 8-μm beads is indicated with schematics of the protocol used. In (B)–(G), for each individual curve, time was shifted so that time origin corresponds to the moment at which K′ reaches a level of 0.5 nN/μm above the initial level (t = tK’start). (A) Young’s modulus EYoung of PLB cells measured by cyclic indentation in the back (see Materials and methods and Fig. S1). EYoung is significantly higher during back indentation on 20- than on 8-μm beads at t = 178 s (). Median values (dots) and interquartile ranges (error bars) are shown. (B and C) Median cell stiffness K′ over time. In (B), at t = 78 s, K′ is larger during indentation of 20- than 8-μm beads ( and ∗∗, Mann). (D and E) Median K″ over time. (F and G) Bottom: loss tangent η=KK over time. Different experimental conditions are shown: PLB cells with 20-μm (red; N = 3, n = 15 cells) and 8-μm beads (pink; N = 3 experiments; n = 12 cells); control condition with non-opsonized 8-μm beads with back indentation of PLB cells (black, N = 3 experiments, n = 17 cells), and human primary neutrophils with 20-μm (dark blue; N = 2 experiments, n = 12 cells) and 8-μm (light blue; N = 2 experiments, n = 18 cells) beads. Each solid line represents the median value; for readability, the interquartile range is not shown. η decreases during phagocytosis (comparing t - tK’start = -100 s with t - tK’start = 50 or 80 s in (F) and comparing t - tK’start = -60 s with t - tK’start = 50 s in (G), star symbols, two-tailed Mann-Whitney test). Raw data are shown in Figs. S6–S11. To see this figure in color, go online.

Similar articles

Cited by

References

    1. Flannagan R.S., Jaumouillé V., Grinstein S. The cell biology of phagocytosis. Annu. Rev. Pathol. 2012;7:61–98. - PubMed
    1. Hallett M.B., editor. Molecular and Cellular Biology of Phagocytosis. Springer International Publishing; 2020.
    1. Niedergang F., Grinstein S. How to build a phagosome: new concepts for an old process. Curr. Opin. Cell Biol. 2018;50:57–63. - PubMed
    1. Ostrowski P.P., Grinstein S., Freeman S.A. Diffusion barriers, mechanical forces, and the biophysics of phagocytosis. Dev. Cell. 2016;38:135–146. - PubMed
    1. Maxson M.E., Naj X., et al. Grinstein S. Integrin-based diffusion barrier separates membrane domains enabling the formation of microbiostatic frustrated phagosomes. Elife. 2018;7:1–37. - PMC - PubMed

Publication types

LinkOut - more resources