

Interacting-heads motif explains the X-ray diffraction pattern of relaxed vertebrate skeletal muscle
- PMID: 35318005
- PMCID: PMC9072692
- DOI: 10.1016/j.bpj.2022.03.023
Interacting-heads motif explains the X-ray diffraction pattern of relaxed vertebrate skeletal muscle
Abstract
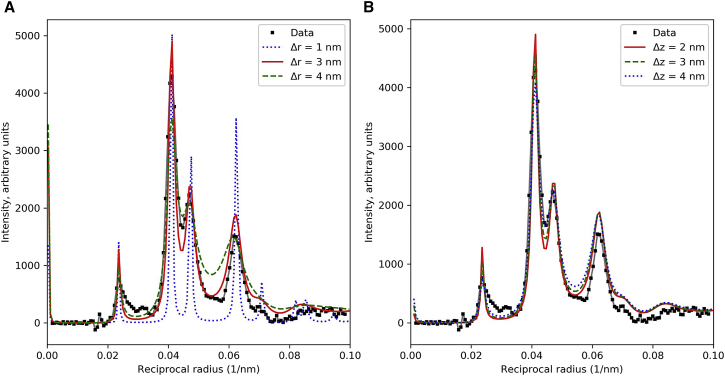
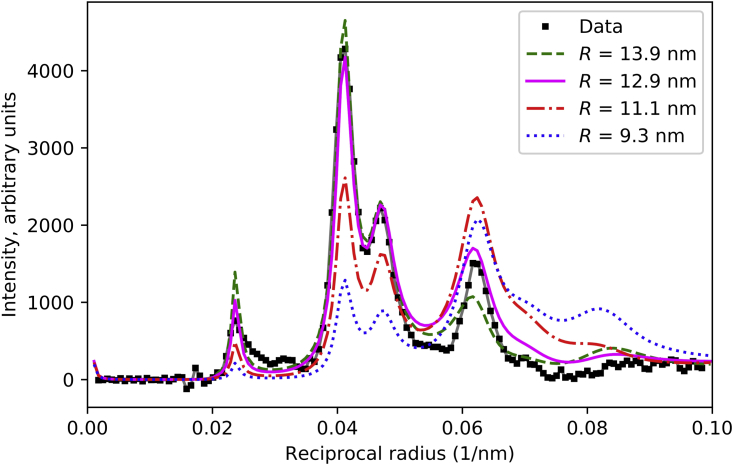
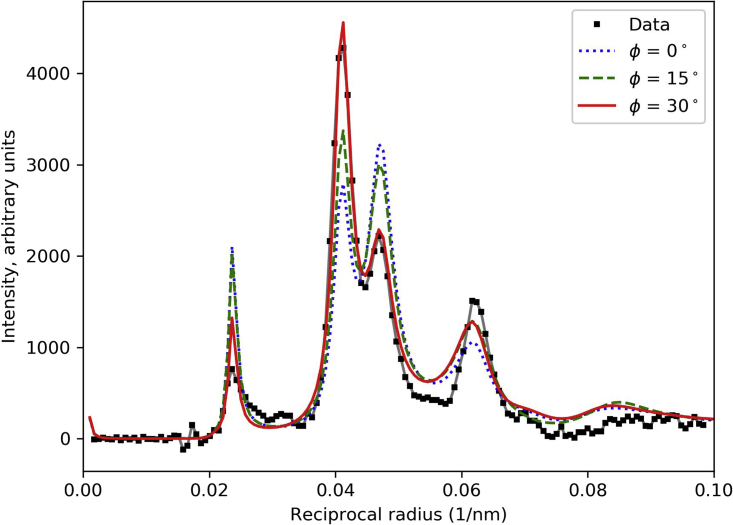
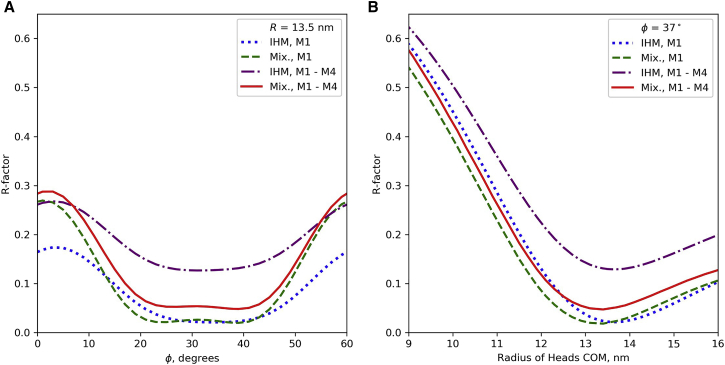
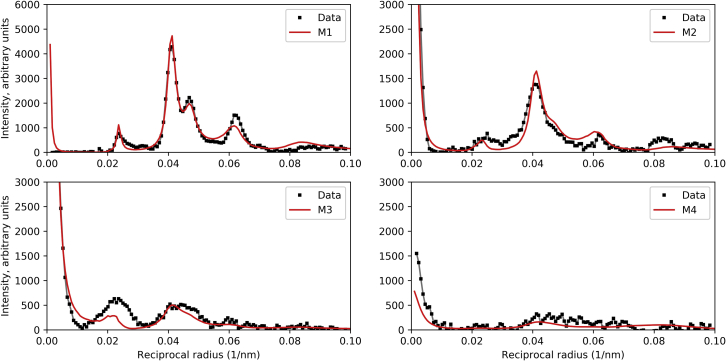
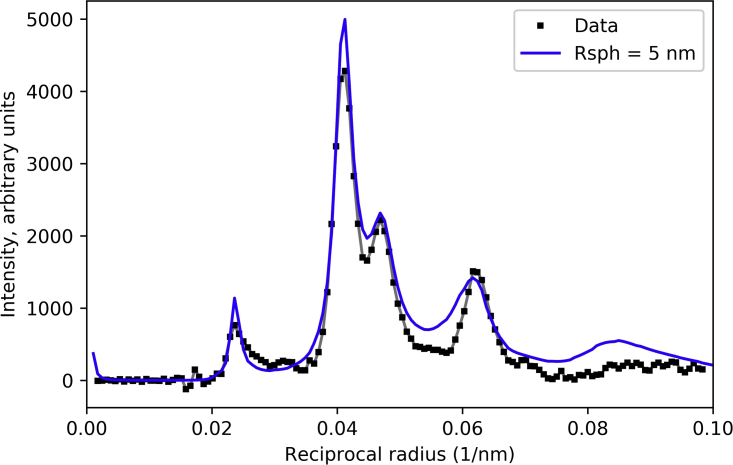
Electron microscopy (EM) shows that myosin heads in thick filaments isolated from striated muscles interact with each other and with the myosin tail under relaxing conditions. This "interacting-heads motif" (IHM) is highly conserved across the animal kingdom and is thought to be the basis of the super-relaxed state. However, a recent X-ray modeling study concludes, contrary to expectation, that the IHM is not present in relaxed intact muscle. We propose that this conclusion results from modeling with a thick filament 3D reconstruction in which the myosin heads have radially collapsed onto the thick filament backbone, not from absence of the IHM. Such radial collapse, by about 3-4 nm, is well established in EM studies of negatively stained myosin filaments, on which the reconstruction was based. We have tested this idea by carrying out similar X-ray modeling and determining the effect of the radial position of the heads on the goodness of fit to the X-ray pattern. We find that, when the IHM is modeled into a thick filament at a radius 3-4 nm greater than that modeled in the recent study, there is good agreement with the X-ray pattern. When the original (collapsed) radial position is used, the fit is poor, in agreement with that study. We show that modeling of the low-angle region of the X-ray pattern is relatively insensitive to the conformation of the myosin heads but very sensitive to their radial distance from the filament axis. We conclude that the IHM is sufficient to explain the X-ray diffraction pattern of intact muscle when placed at the appropriate radius.
Copyright © 2022 Biophysical Society. Published by Elsevier Inc. All rights reserved.
Figures
Similar articles
-
The myosin interacting-heads motif is present in the relaxed thick filament of the striated muscle of scorpion.J Struct Biol. 2012 Dec;180(3):469-78. doi: 10.1016/j.jsb.2012.08.010. Epub 2012 Sep 7. J Struct Biol. 2012. PMID: 22982253
-
The myosin interacting-heads motif present in live tarantula muscle explains tetanic and posttetanic phosphorylation mechanisms.Proc Natl Acad Sci U S A. 2020 Jun 2;117(22):11865-11874. doi: 10.1073/pnas.1921312117. Epub 2020 May 22. Proc Natl Acad Sci U S A. 2020. PMID: 32444484 Free PMC article.
-
Lessons from a tarantula: new insights into muscle thick filament and myosin interacting-heads motif structure and function.Biophys Rev. 2017 Oct;9(5):461-480. doi: 10.1007/s12551-017-0295-1. Epub 2017 Sep 4. Biophys Rev. 2017. PMID: 28871556 Free PMC article. Review.
-
Conserved Intramolecular Interactions Maintain Myosin Interacting-Heads Motifs Explaining Tarantula Muscle Super-Relaxed State Structural Basis.J Mol Biol. 2016 Mar 27;428(6):1142-1164. doi: 10.1016/j.jmb.2016.01.027. Epub 2016 Feb 2. J Mol Biol. 2016. PMID: 26851071 Free PMC article.
-
Lessons from a tarantula: new insights into myosin interacting-heads motif evolution and its implications on disease.Biophys Rev. 2018 Oct;10(5):1465-1477. doi: 10.1007/s12551-017-0292-4. Epub 2017 Sep 4. Biophys Rev. 2018. PMID: 28871552 Free PMC article. Review.
Cited by
-
Structure of mavacamten-free human cardiac thick filaments within the sarcomere by cryoelectron tomography.Proc Natl Acad Sci U S A. 2024 Feb 27;121(9):e2311883121. doi: 10.1073/pnas.2311883121. Epub 2024 Feb 22. Proc Natl Acad Sci U S A. 2024. PMID: 38386705 Free PMC article.
-
Structural OFF/ON transitions of myosin in relaxed porcine myocardium predict calcium-activated force.Proc Natl Acad Sci U S A. 2023 Jan 31;120(5):e2207615120. doi: 10.1073/pnas.2207615120. Epub 2023 Jan 25. Proc Natl Acad Sci U S A. 2023. PMID: 36696446 Free PMC article.
-
Cryo-EM structure of the folded-back state of human β-cardiac myosin.Nat Commun. 2023 May 31;14(1):3166. doi: 10.1038/s41467-023-38698-w. Nat Commun. 2023. PMID: 37258552 Free PMC article.
-
Muscle Mechanics and Thick Filament Activation: An Emerging Two-Way Interaction for the Vertebrate Striated Muscle Fine Regulation.Int J Mol Sci. 2023 Mar 27;24(7):6265. doi: 10.3390/ijms24076265. Int J Mol Sci. 2023. PMID: 37047237 Free PMC article. Review.
-
Cryo-EM structure of the human cardiac myosin filament.Nature. 2023 Nov;623(7988):853-862. doi: 10.1038/s41586-023-06691-4. Epub 2023 Nov 1. Nature. 2023. PMID: 37914935 Free PMC article.
References
-
- Liu J., Wendt T., et al. Taylor K. Refined model of the 10S conformation of smooth muscle myosin by cryo-electron microscopy 3D image reconstruction. J. Mol. Biol. 2003;329:963–972. http://www.ncbi.nlm.nih.gov/pubmed/12798686 - PubMed
-
- Woodhead J.L., Zhao F.Q., et al. Padron R. Atomic model of a myosin filament in the relaxed state. Nature. 2005;436:1195–1199. - PubMed
Publication types
MeSH terms
Substances
Grants and funding
LinkOut - more resources
Full Text Sources
