. 2022 May 4;42(18):3868-3877.
doi: 10.1523/JNEUROSCI.2061-21.2022. Epub 2022 Mar 22.

Divergent Histopathological Networks of Frontotemporal Degeneration Proteinopathy Subytpes

Affiliations

Divergent Histopathological Networks of Frontotemporal Degeneration Proteinopathy Subytpes

Min Chen et al. J Neurosci. .

Abstract

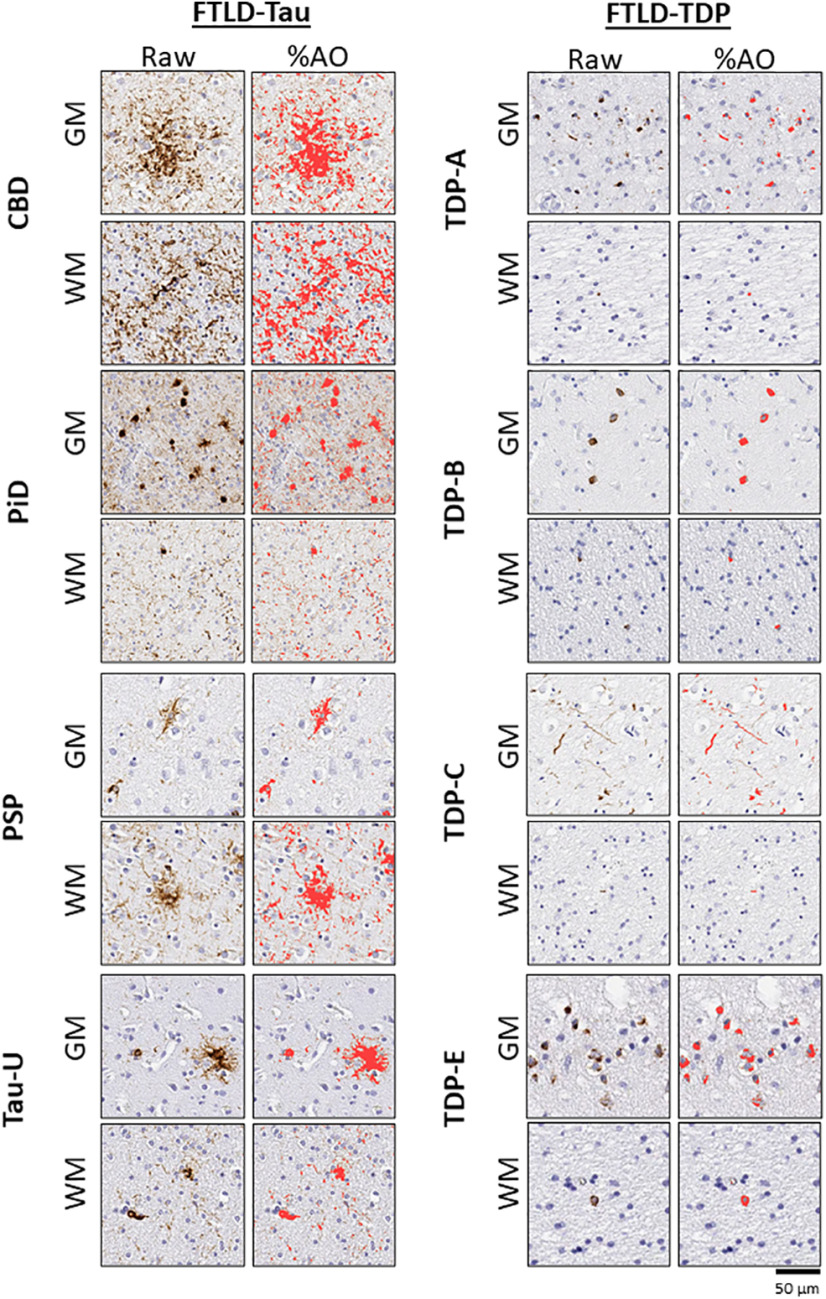
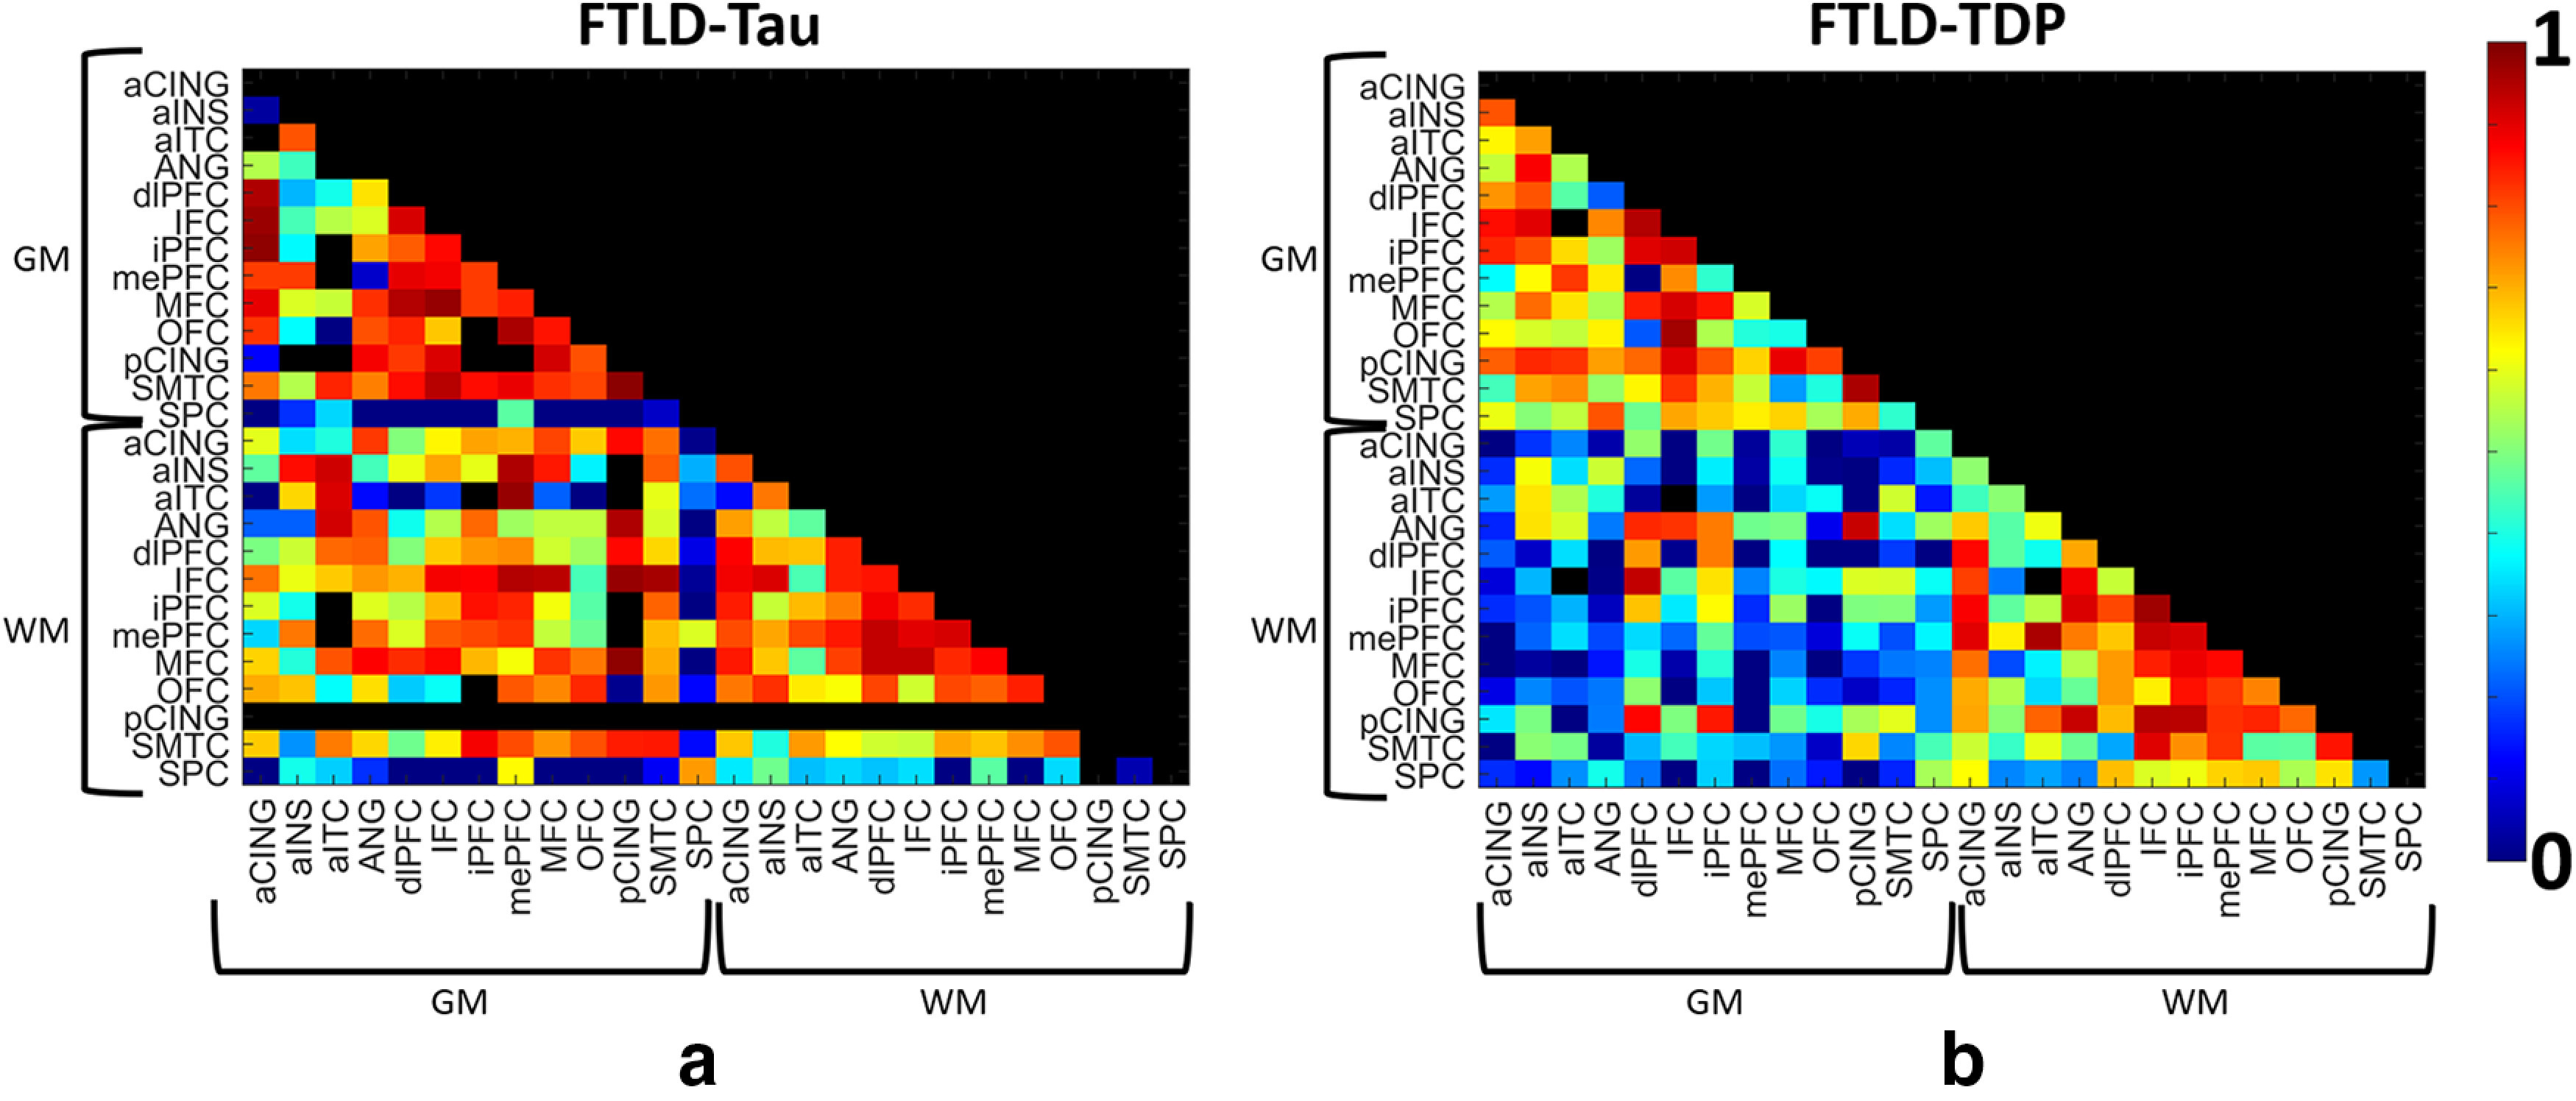
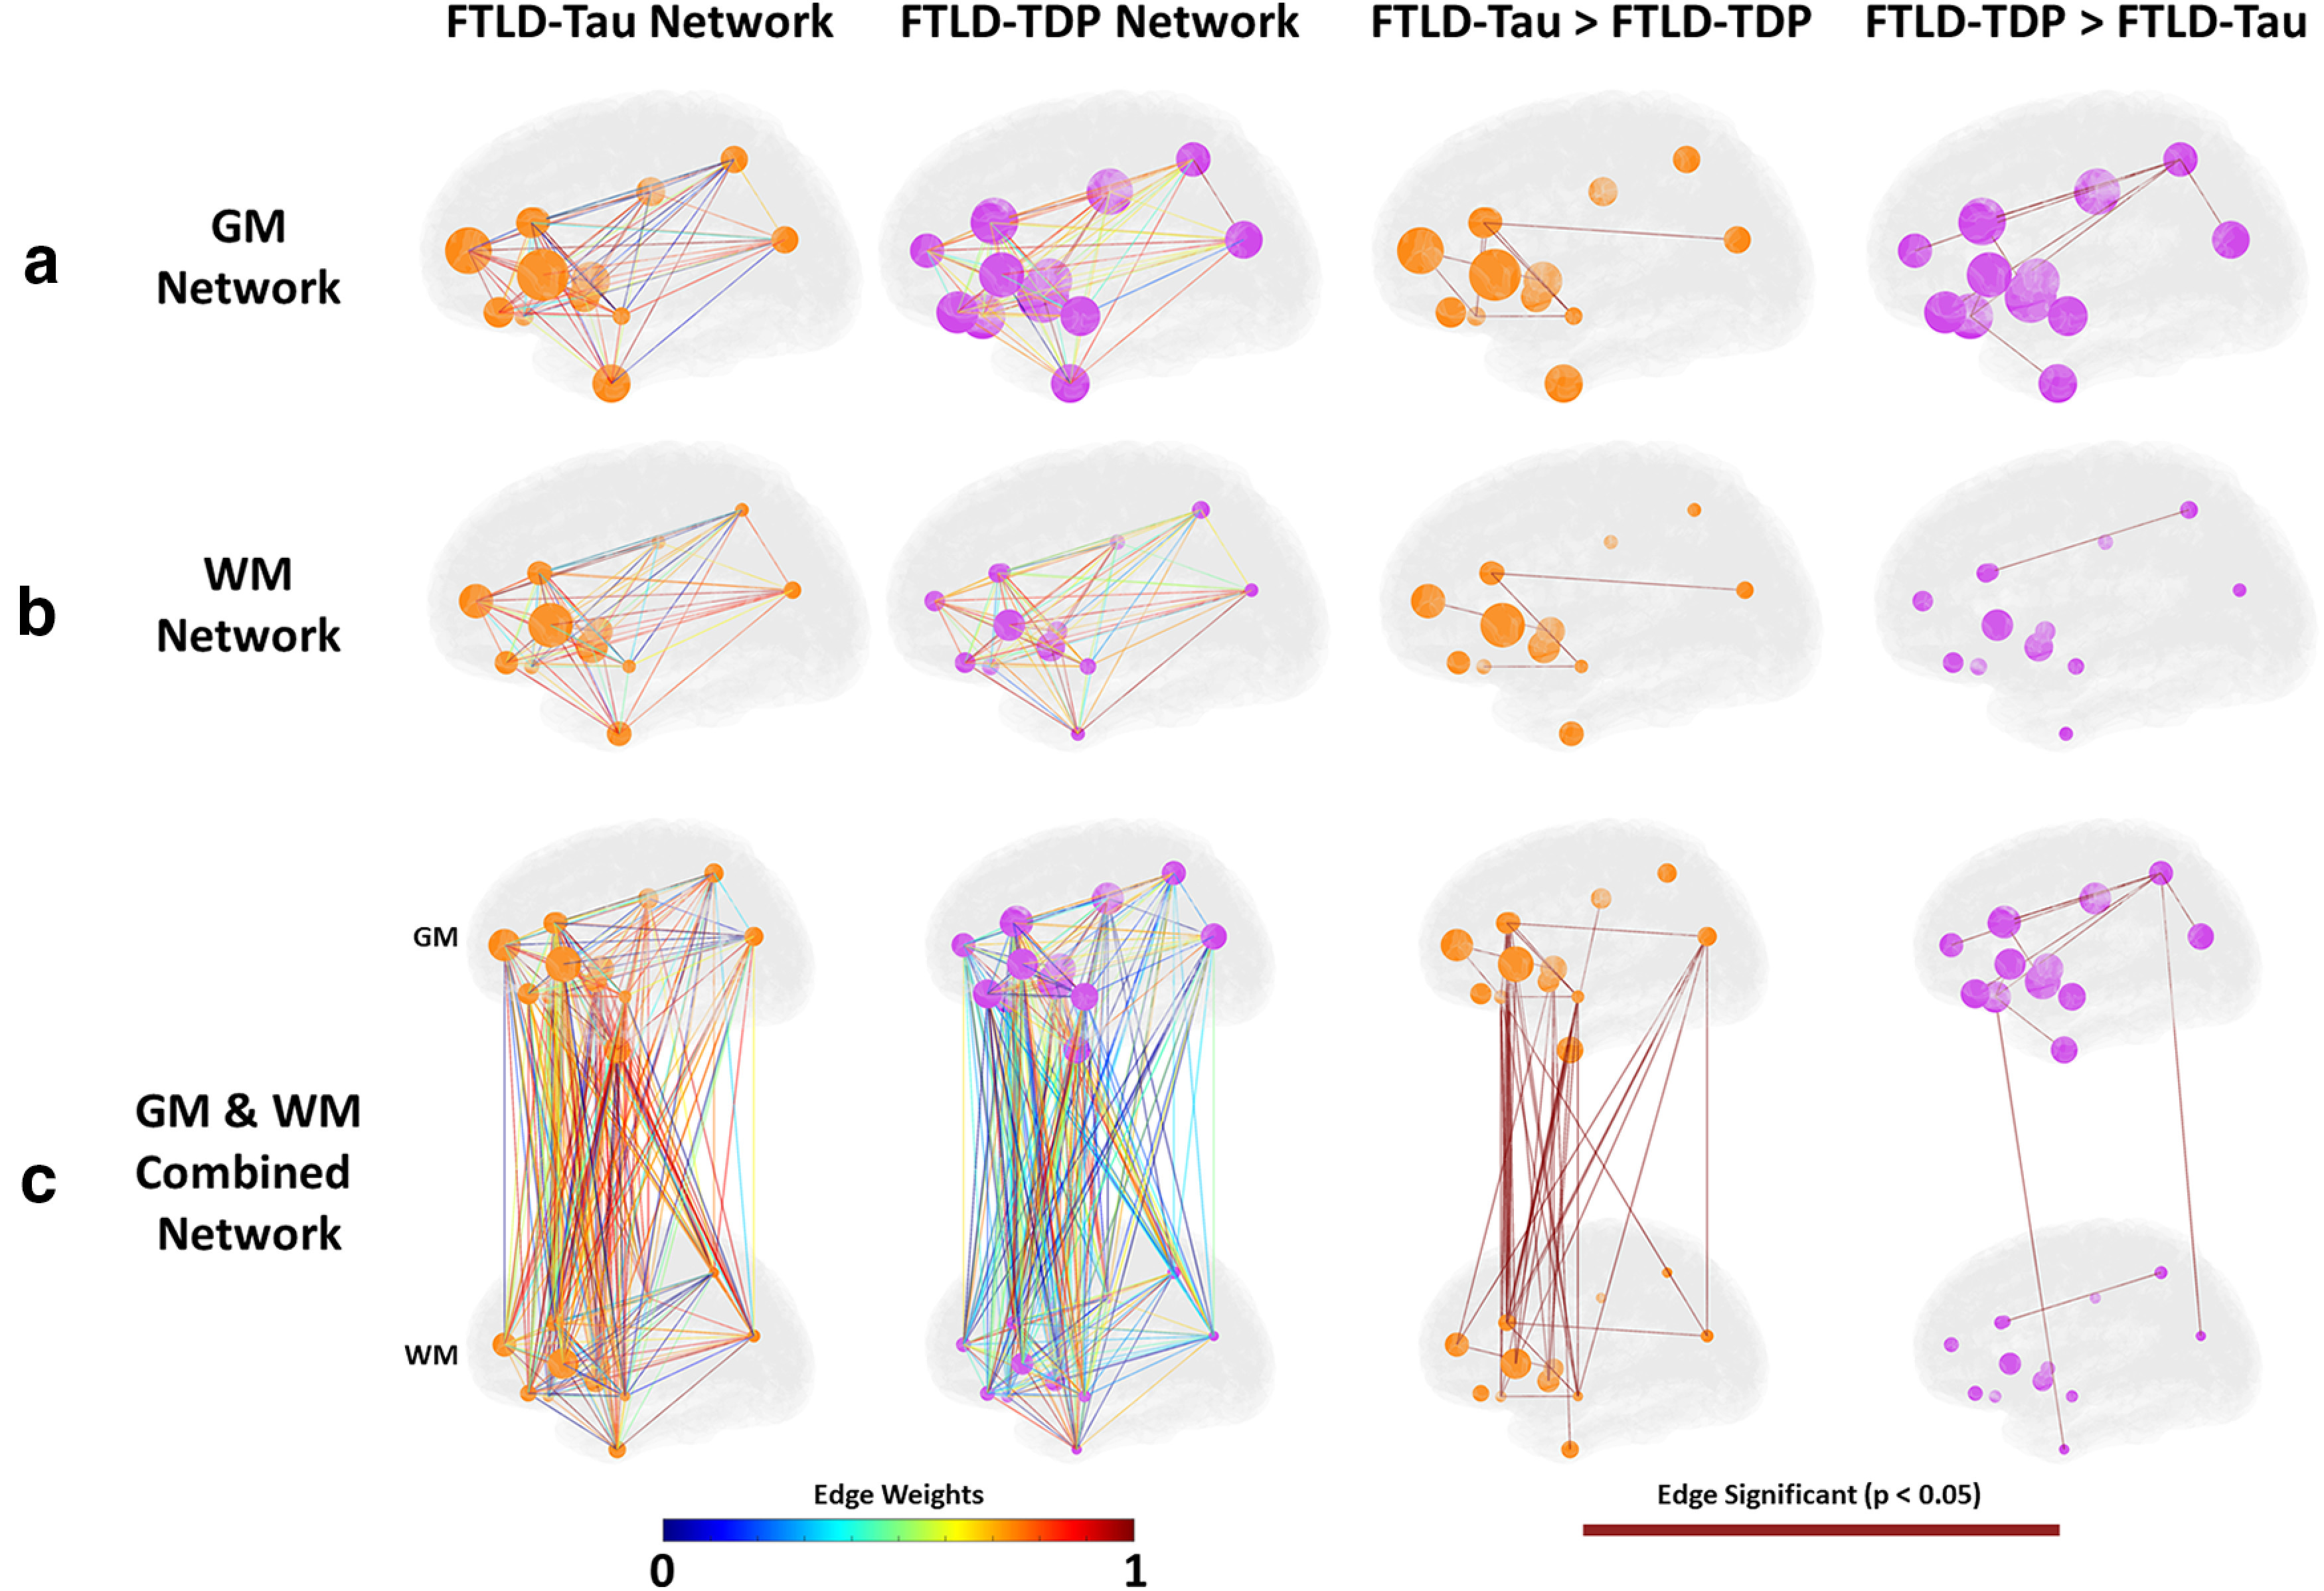
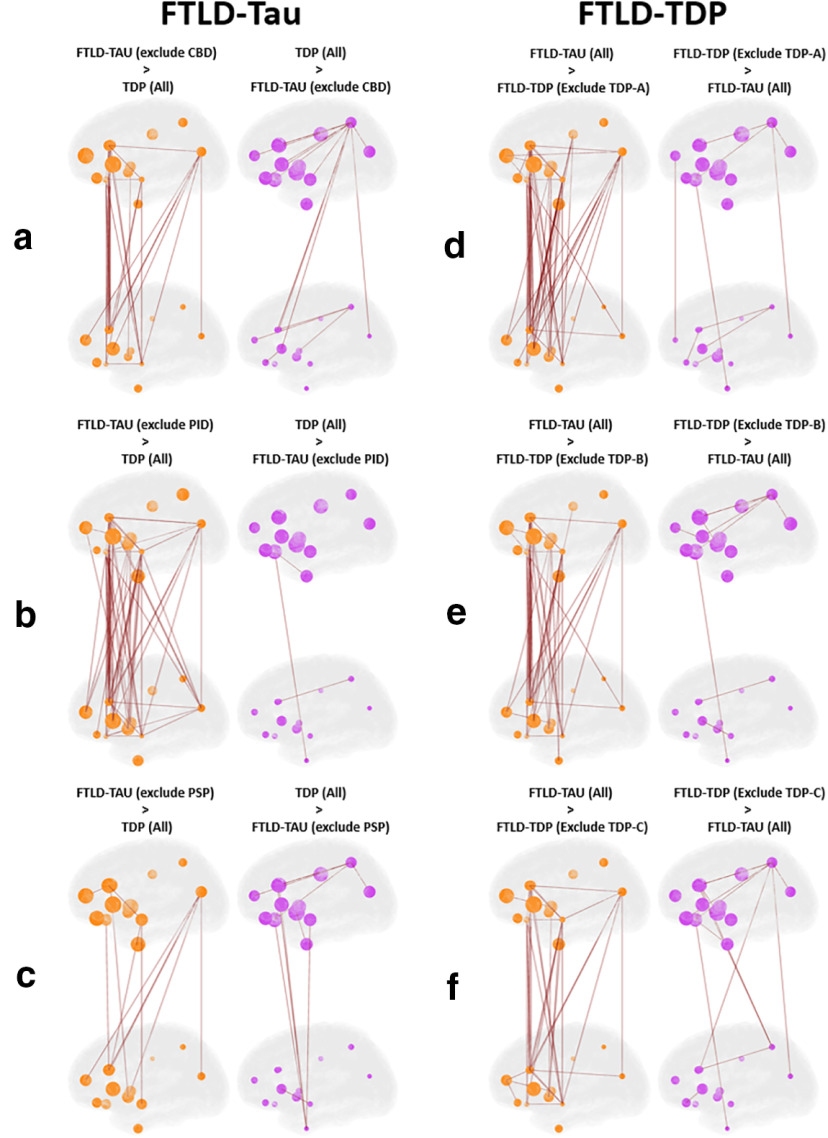
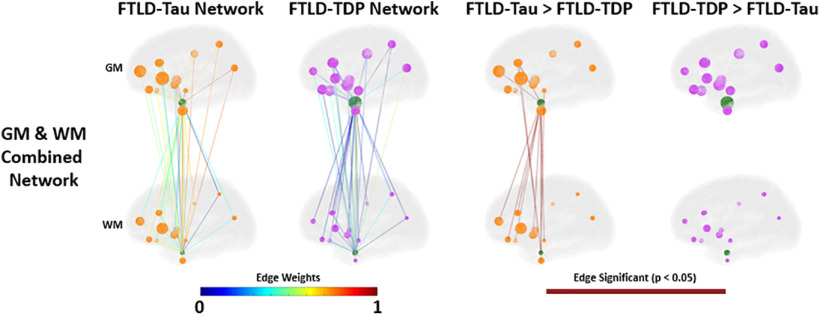
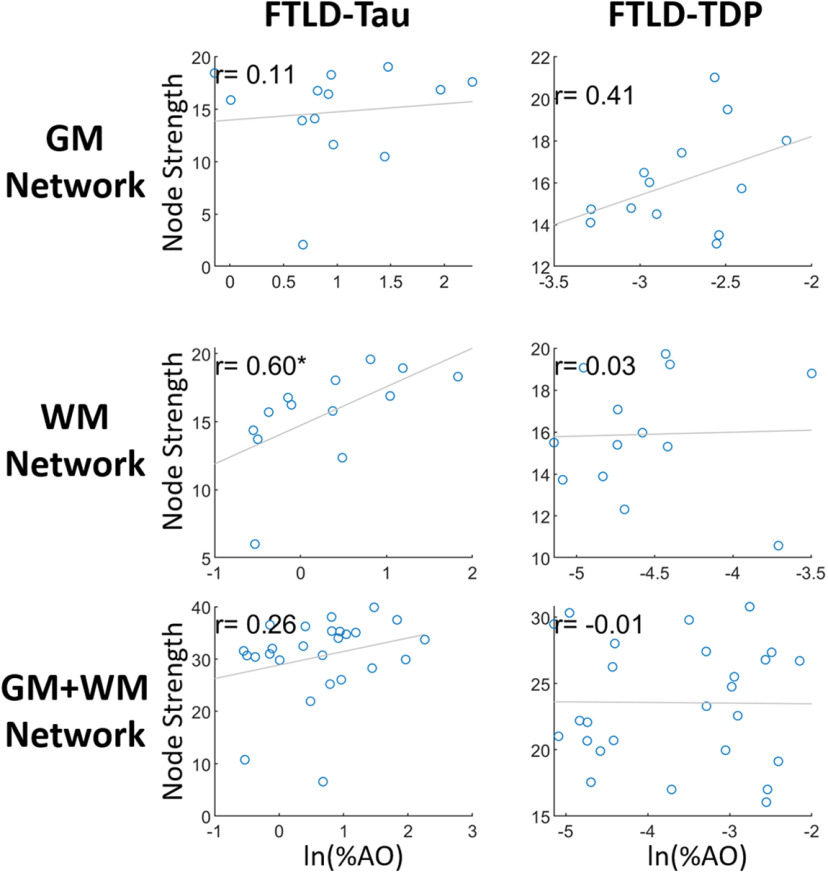
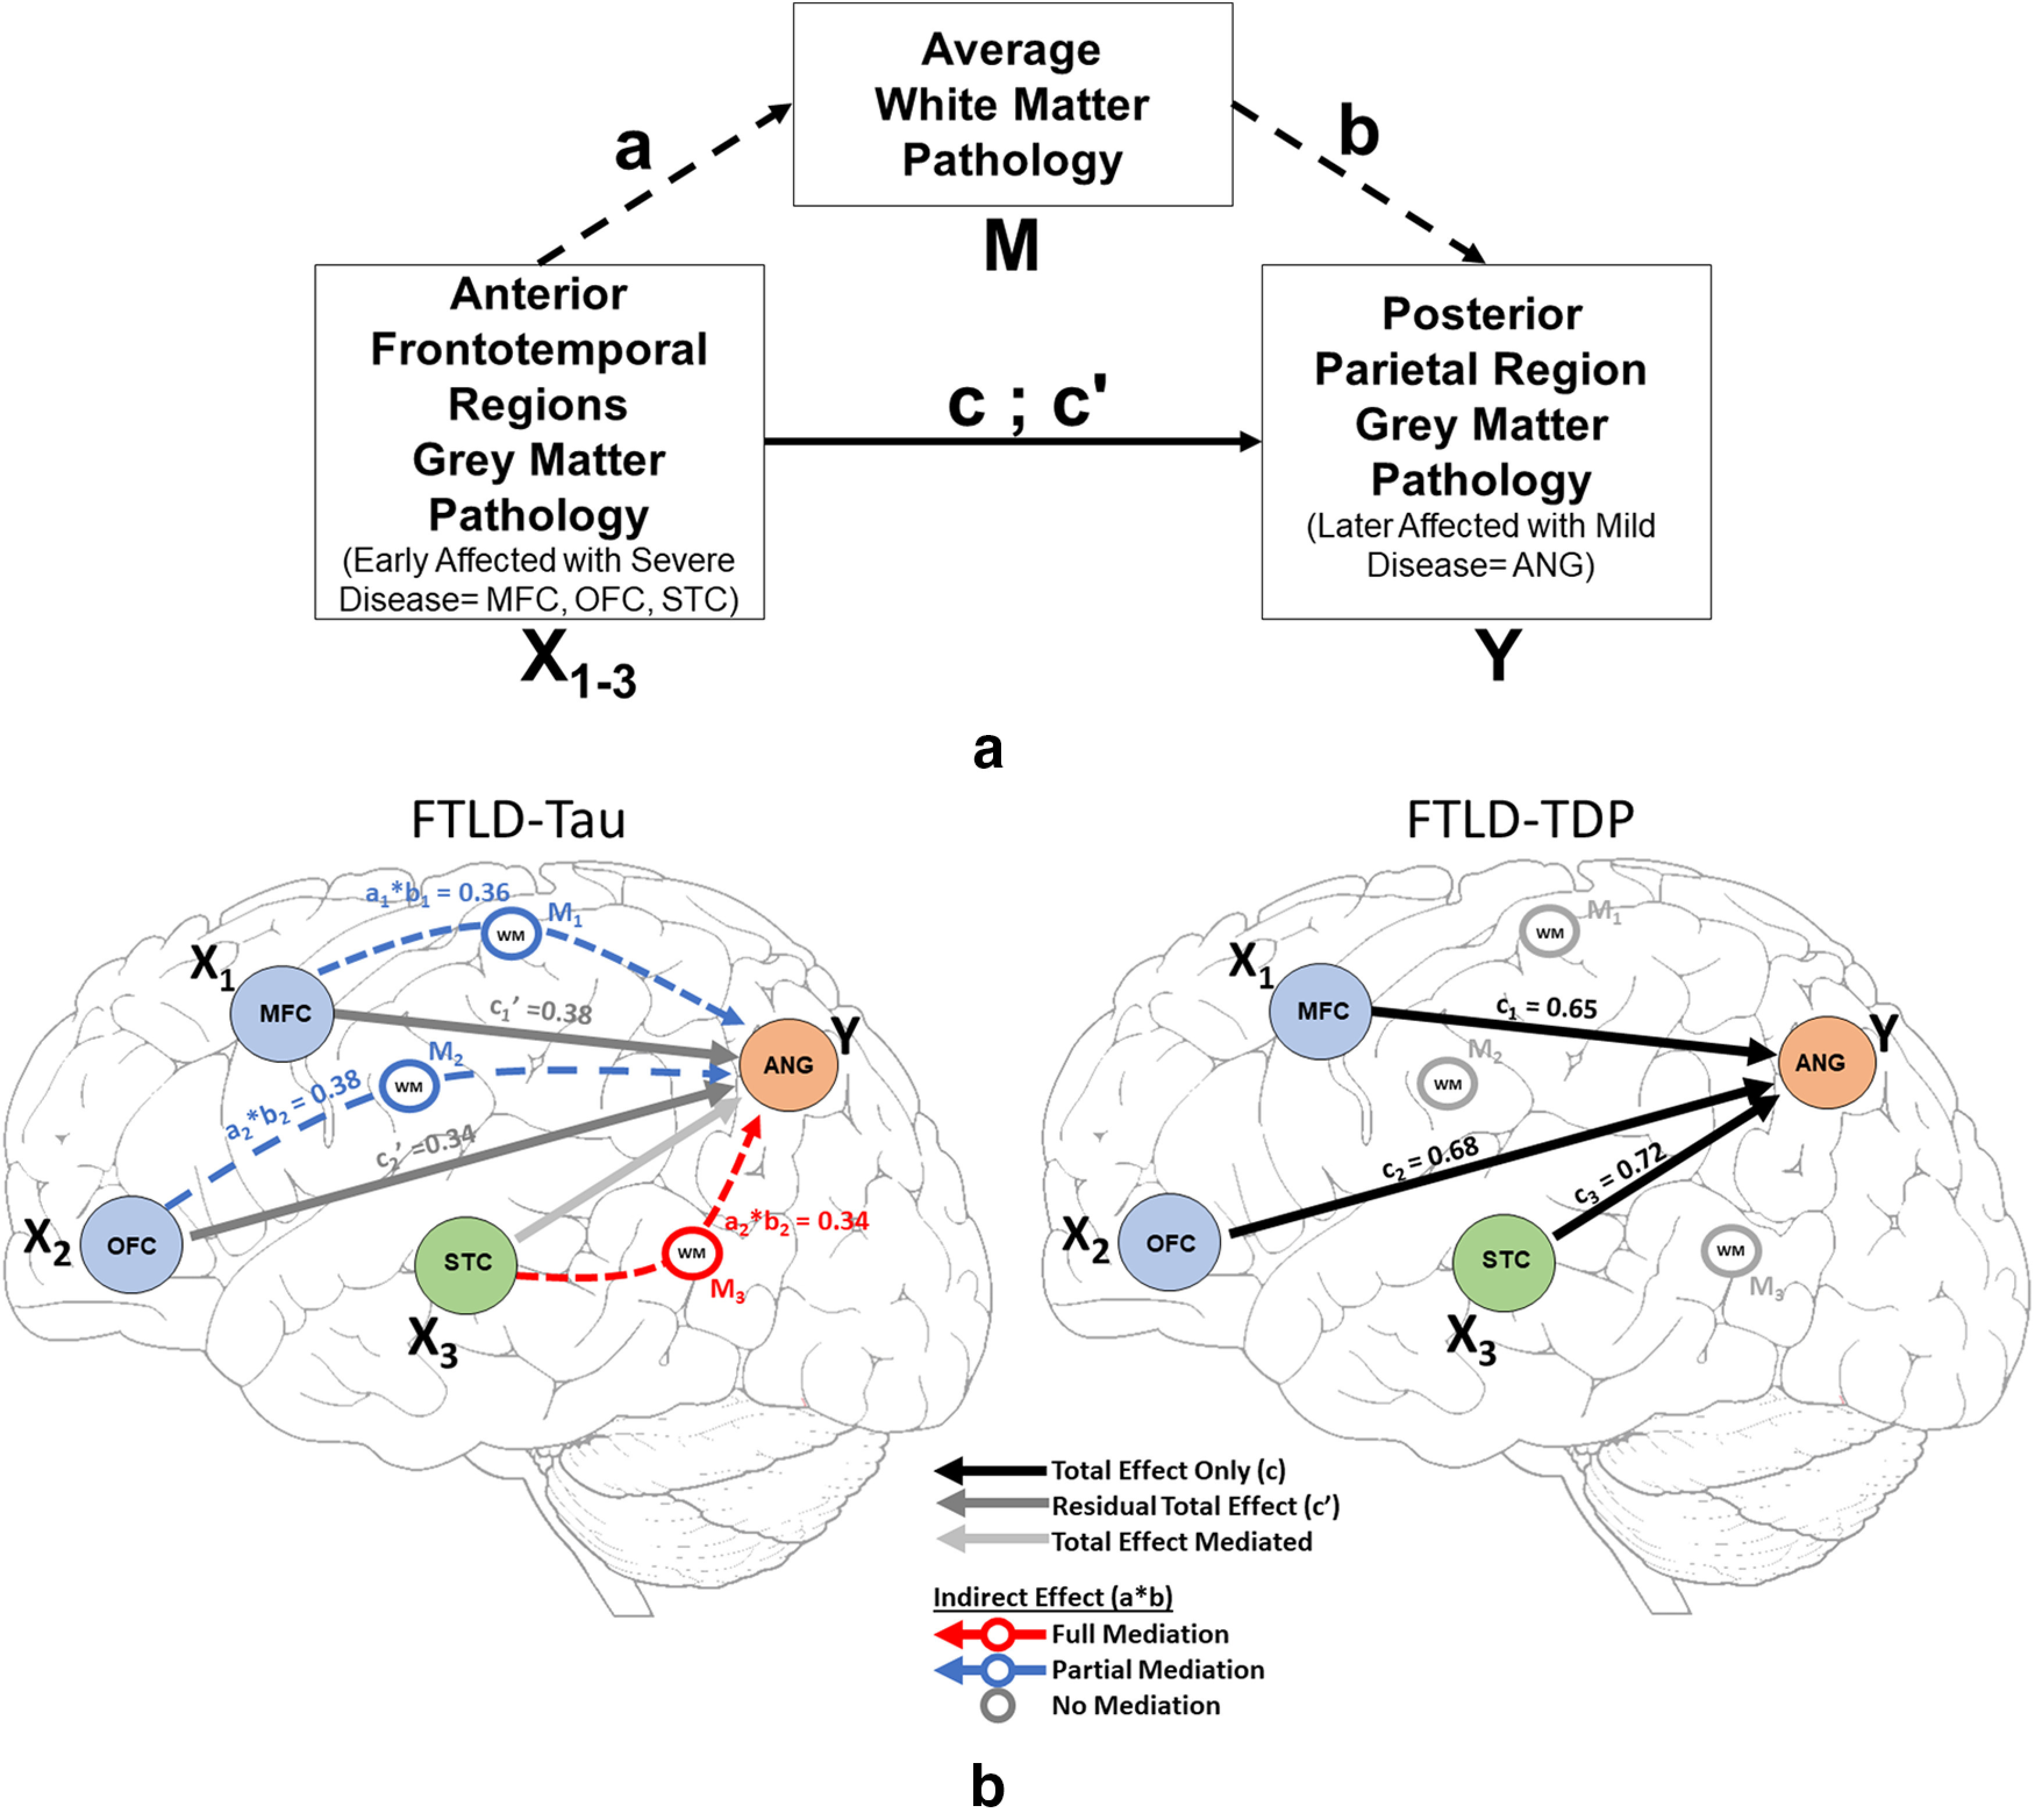
Network analyses inform complex systems such as human brain connectivity, but this approach is seldom applied to gold-standard histopathology. Here, we use two complimentary computational approaches to model microscopic progression of the main subtypes of tauopathy versus TDP-43 proteinopathy in the human brain. Digital histopathology measures were obtained in up to 13 gray matter (GM) and adjacent white matter (WM) cortical brain regions sampled from 53 tauopathy and 66 TDP-43 proteinopathy autopsy patients. First, we constructed a weighted non-directed graph for each group, where nodes are defined as GM and WM regions sampled and edges in the graph are weighted using the group-level Pearson's correlation coefficient for each pairwise node comparison. Additionally, we performed mediation analyses to test mediation effects of WM pathology between anterior frontotemporal and posterior parietal GM nodes. We find greater correlation (i.e., edges) between GM and WM node pairs in tauopathies compared with TDP-43 proteinopathies. Moreover, WM pathology strongly correlated with a graph metric of pathology spread (i.e., node-strength) in tauopathies (r = 0.60, p < 0.03) but not in TDP-43 proteinopathies (r = 0.03, p = 0.9). Finally, we found mediation effects for WM pathology on the association between anterior and posterior GM pathology in FTLD-Tau but not in FTLD-TDP. These data suggest distinct tau and TDP-43 proteinopathies may have divergent patterns of cellular propagation in GM and WM. More specifically, axonal spread may be more influential in FTLD-Tau progression. Network analyses of digital histopathological measurements can inform models of disease progression of cellular degeneration in the human brain.SIGNIFICANCE STATEMENT In this study, we uniquely perform two complimentary computational approaches to model and contrast microscopic disease progression between common frontotemporal lobar degeneration (FTLD) proteinopathy subtypes with similar clinical syndromes during life. Our models suggest white matter (WM) pathology influences cortical spread of disease in tauopathies that is less evident in TDP-43 proteinopathies. These data support the hypothesis that there are neuropathologic signatures of cellular degeneration within neurocognitive networks for specific protienopathies. These distinctive patterns of cellular pathology can guide future efforts to develop tissue-sensitive imaging and biological markers with diagnostic and prognostic utility for FTLD. Moreover, our novel computational approach can be used in future work to model various neurodegenerative disorders with mixed proteinopathy within the human brain connectome.

Keywords: TDP-43 proteinopathy; frontotemporal lobar degeneration; histopathology; mediation analysis; network science; tauopathy.


Figures

Figure 1.
Figure 1.
Digital histopathological analysis. Photomicrographs depict representative raw image and %AO of positive pixel digital quantification (%AO, red overlay) from MFC (BA46) grey (GM) and white matter (WM) in FTLD-Tau subtypes (CBD; PiD; PSP; Tau-U) and FTLD-TDP subtypes (TDP A, B, C, E). Scale bar: 50 µm.
Figure 2.
Figure 2.
Correlation matrices of digital histopathological measurements across grey matter (GM) and white matter (WM) nodes in FTLD-Tau and FTLD-TDP. Heat map depicts the Pearson's correlation coefficient between nodes according to sidebar scale in (a) FTLD-Tau and (b) FTLD-TDP proteinopathy groups. We depict the lower half of the map only to avoid redundancy. Node pairs with insufficient sample sizes to evaluate a correlation coefficient are excluded from the analysis and shown as black.
Figure 3.
Figure 3.
Digital histopathology graphs for FTLD-Tau and FTLD-TDP. Graphs depict (a) grey matter (GM), (b) white matter (WM), and (c) GM+WM nodes in each proteinopathy group. Node size is depicted as total amount of relative pathology measured at each node (larger node = higher percentage of area occupied (%AO) positive pixels of pathology). Edges between nodes are represented by the strength of the Pearson correlation between nodes according to the edge weight heat map. Differences between groups are depicted as edges surviving 0.05 statistical threshold in a one-tailed comparison between the correlations.
Figure 4.
Figure 4.
Sensitivity analysis of pathologic subtypes in FTLD-Tau compared with subtypes of FTLD-TDP. Graphs depict GM+WM nodes for cross-validations where we repeated the FTLD-Tau and FTLD-TDP GM+WM histopathology network comparisons while excluding a different subgroup from each analysis: (a) FTLD-Tau group excluding CBD subtype versus FTLD-TDP total group; (b) FTLD-Tau group excluding PiD subtype versus FTLD-TDP total group; (c) FTLD-Tau group excluding PSP subtype versus FTLD-TDP total group; (d) FTLD-Tau total group versus FTLD-TDP group excluding TDP subtype A; (e) FTLD-Tau total group versus FTLD-TDP group excluding TDP subtype B; (f) FTLD-Tau total group versus FTLD-TDP group excluding TDP subtype C. Node size is depicted as total amount of relative pathology measured at each node (larger node = higher percentage of positive pixels of pathology, %AO). Differences between groups are depicted as edges surviving 0.05 statistical threshold in a one-tailed comparison between the correlations.
Figure 5.
Figure 5.
Exploratory analysis of hippocampal connectivity. Graphs depict GM+WM associations of hippocampus entorhinal cortex (BA28; green node) with the cortical regions sampled. Node size is depicted as total amount of relative pathology measured at each node (larger node = higher percentage of positive pixels of pathology, %AO). Edges between nodes are represented by the strength of the Pearson correlation between nodes according to the edge weight scale. Differences between groups are depicted as edges surviving 0.05 statistical threshold in a one-tailed comparison between the correlations.
Figure 6.
Figure 6.
Comparison of node strength with grey matter (GM) and white matter (WM) node pathologic burden in FTLD-Tau and FTLD-TDP. Scatterplots depict group level average digital pathology measurement (i.e. natural log of positive percentage of pixels for pathology, ln(%AO)) plotted by average node strength for GM and WM cortical nodes. Node strength graphically correlates with GM disease burden in FTLD-TDP > FTLD-Tau but does not reach statistical significance, while FTLD-Tau WM pathologic burden has positive correlate with node strength. These data suggest differential contributions of GM and WM pathology to distribution of pathology in the brain for FTLD proteinopathies.
Figure 7.
Figure 7.
Mediation analysis of WM pathology on associations between anterior frontotemporal and posterior parietal cortex in FTLD-Tau and FTLD-TDP. Schematic in a depicts the mediation analysis for testing the association of anterior frontotemporal GM nodes (orbitofrontal cortex = OFC, midfrontal cortex = MFC, superior temporal cortex = STC) and posterior parietal grey matter (GM) node (ANG = angular gyrus). The mediation analysis tests the mediation of average white matter (WM) measurement (designated as M) between anterior frontotemporal GM regions (designated as X) compared with distal parietal GM (designated as Y). Diagrams in b show the mediation effect (or lack of) for each of these tests in FTLD-Tau (left) and FTLD-TDP (right).

Similar articles

Cited by

References

    1. Alexander-Bloch A, Giedd JN, Bullmore E (2013) Imaging structural co-variance between human brain regions. Nat Rev Neurosci 14:322–336. 10.1038/nrn3465 - DOI - PMC - PubMed
    1. Baron RM, Kenny DA (1986) The moderator-mediator variable distinction in social psychological research: conceptual, strategic, and statistical considerations. J Pers Soc Psychol 51:1173–1182. 10.1037//0022-3514.51.6.1173 - DOI - PubMed
    1. Boluda S, Iba M, Zhang B, Raible KM, Lee VM, Trojanowski JQ (2015) Differential induction and spread of tau pathology in young PS19 tau transgenic mice following intracerebral injections of pathological tau from Alzheimer's disease or corticobasal degeneration brains. Acta Neuropathol 129:221–237. 10.1007/s00401-014-1373-0 - DOI - PMC - PubMed
    1. Braak H, Brettschneider J, Ludolph AC, Lee VM, Trojanowski JQ, Del Tredici K (2013) Amyotrophic lateral sclerosis–a model of corticofugal axonal spread. Nat Rev Neurol 9:708–714. 10.1038/nrneurol.2013.221 - DOI - PMC - PubMed
    1. Brettschneider J, Del Tredici K, Irwin DJ, Grossman M, Robinson JL, Toledo JB, Fang L, Van Deerlin VM, Ludolph AC, Lee VM, Braak H, Trojanowski JQ (2014) Sequential distribution of pTDP-43 pathology in behavioral variant frontotemporal dementia (bvFTD). Acta Neuropathol 127:423–439. 10.1007/s00401-013-1238-y - DOI - PMC - PubMed

Publication types

LinkOut - more resources