

Analysis of Genes Associated with Both Neural Tube Defects and Neuroectodermal Tumors
- PMID: 35318299
- PMCID: PMC8958863
- DOI: 10.12659/MSM.936079
Analysis of Genes Associated with Both Neural Tube Defects and Neuroectodermal Tumors
Abstract
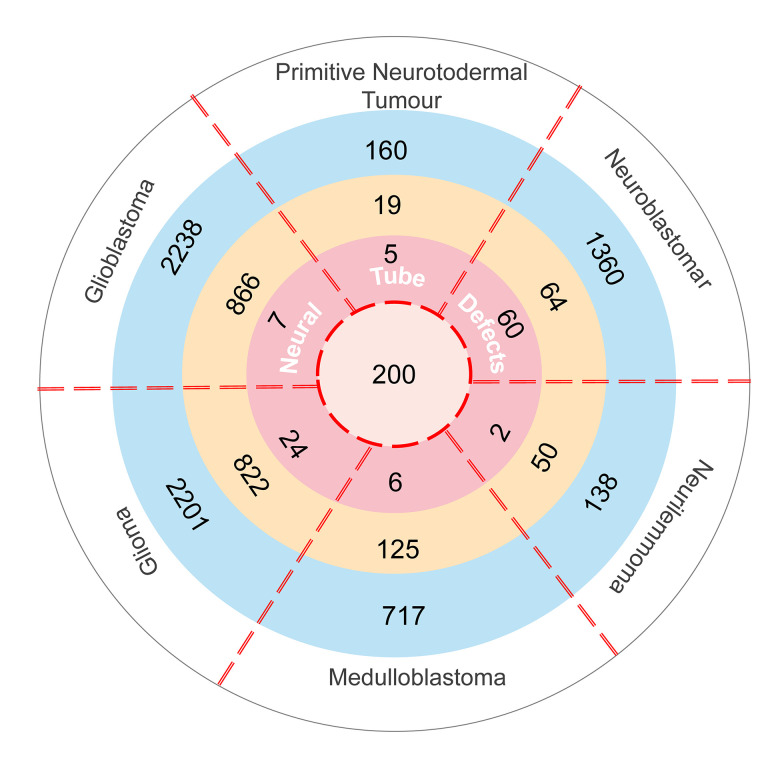
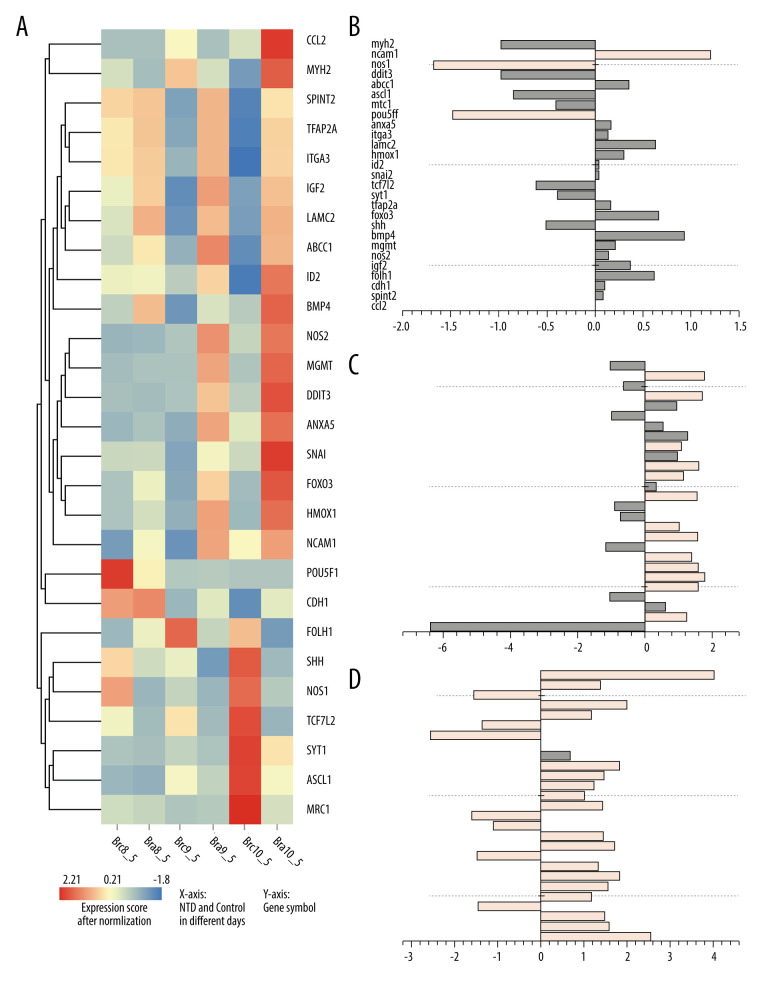
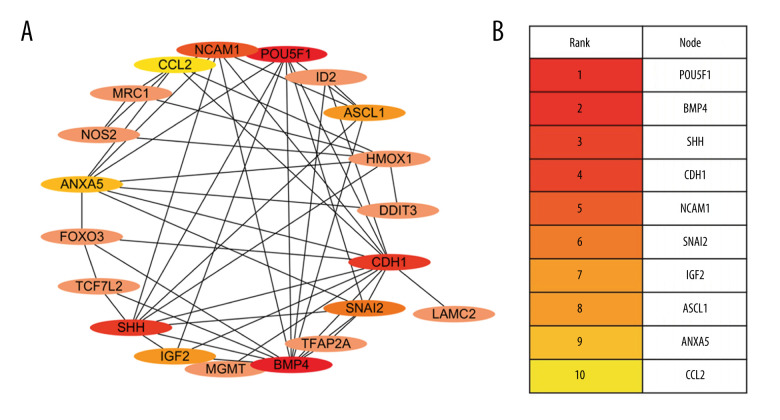
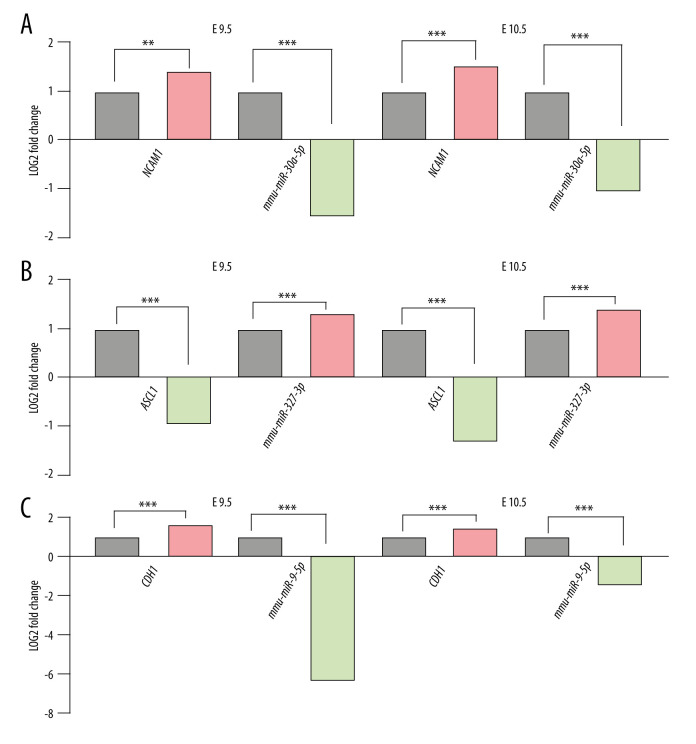
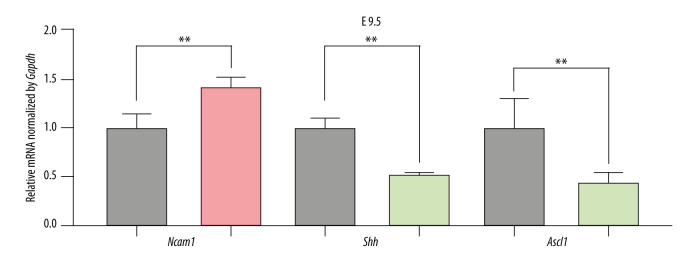
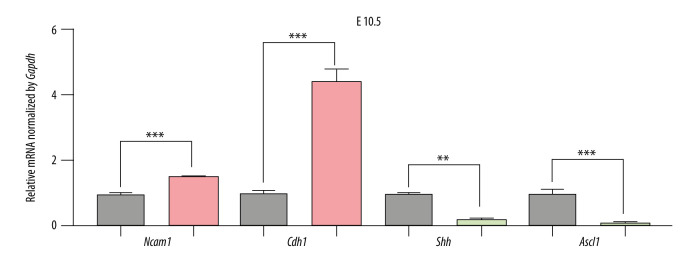
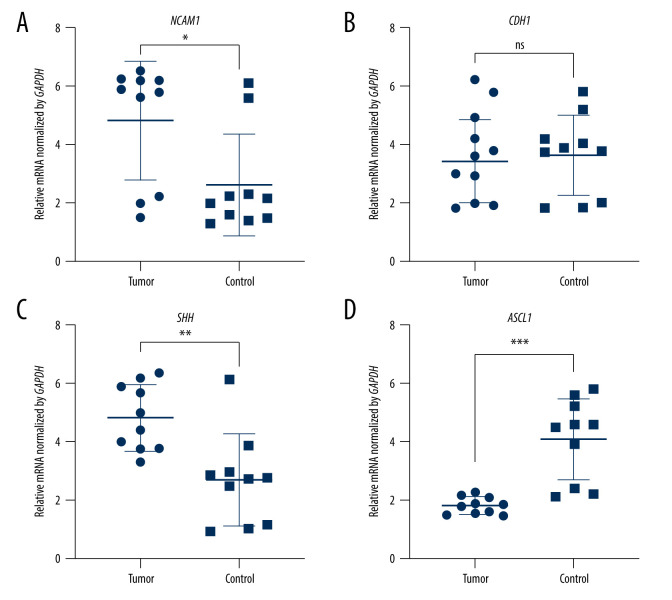
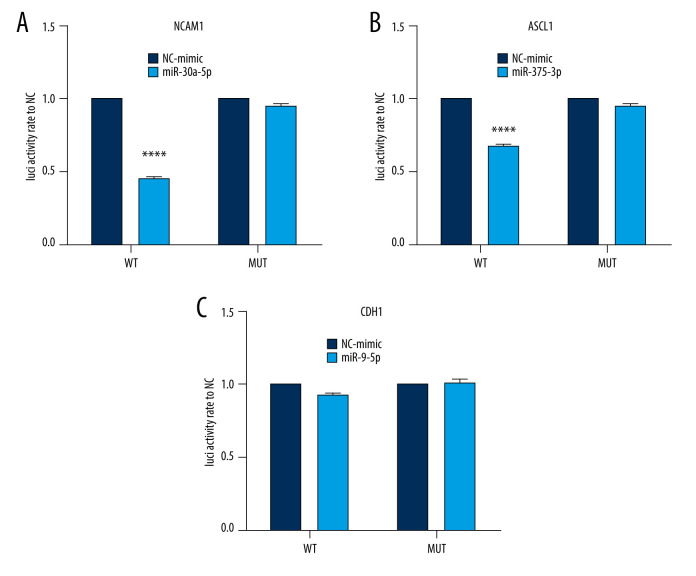
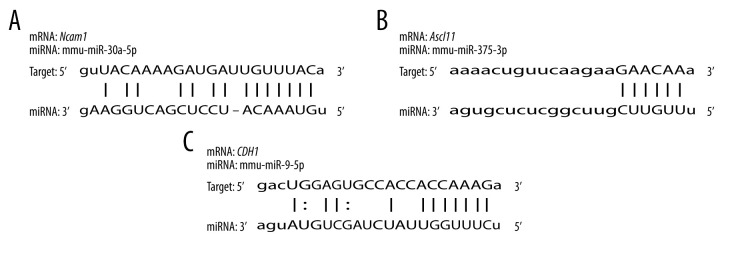
BACKGROUND Previous studies have demonstrated that embryo development and the occurrence of tumors are closely related, as key genes, pathways, miRNAs, and other biological mechanisms are involved in both processes. Extensive research has found that abnormal development of nerve ectodermal cells not only leads to neural tube defects (NTDs), but also neuroectodermal tumors. MATERIAL AND METHODS Genes associated with both NTDs and neuroectodermal tumors were obtained from the DisGeNET database. The STRING database was used to construct the protein-protein interaction (PPI) network and the hub genes were visualized using Cytoscape. Additionally, we predicted the miRNAs targeting the identified genes. Sequencing data obtained from an NTDs mouse model and human samples were used to confirm the bioinformatics results. Moreover, a dual-luciferase report assay was used to validate the targeting relationship between the miRNA-gene pairs identified. RESULTS A total of 104 intersection genes of NTDs-related and neuroectodermal tumors-related genes were obtained; 20 of these genes were differentially expressed in NTDs samples and had very close interactions. Among 10 hub genes, we identified 3 important susceptibility genes differentially expressed both in RA-induced NTDs mice and human glioblastoma samples: Ncam1, Shh, and Ascl1. Among these, we found that the Ncam1 expression level was regulated by mmu-miR-30a-5p, and the Ascl1 expression level was regulated by mmu-miR-375-3p. CONCLUSIONS In conclusion, we identified differentially expressed genes and a potential miRNA-mediated regulation mechanism shared between NTDs and neuroectodermal tumors that may guide future studies aiming to find novel therapeutic targets for NTDs or neuroectodermal tumors.
Conflict of interest statement
Figures
Similar articles
-
Identification of invasion-metastasis-associated microRNAs in hepatocellular carcinoma based on bioinformatic analysis and experimental validation.J Transl Med. 2018 Sep 29;16(1):266. doi: 10.1186/s12967-018-1639-8. J Transl Med. 2018. PMID: 30268144 Free PMC article.
-
Identification of key microRNAs and hub genes in non-small-cell lung cancer using integrative bioinformatics and functional analyses.J Cell Biochem. 2020 Mar;121(3):2690-2703. doi: 10.1002/jcb.29489. Epub 2019 Nov 6. J Cell Biochem. 2020. PMID: 31692035
-
Three hematologic/immune system-specific expressed genes are considered as the potential biomarkers for the diagnosis of early rheumatoid arthritis through bioinformatics analysis.J Transl Med. 2021 Jan 6;19(1):18. doi: 10.1186/s12967-020-02689-y. J Transl Med. 2021. PMID: 33407587 Free PMC article.
-
Identification of novel genes associated with a poor prognosis in pancreatic ductal adenocarcinoma via a bioinformatics analysis.Biosci Rep. 2019 Aug 2;39(8):BSR20190625. doi: 10.1042/BSR20190625. Print 2019 Aug 30. Biosci Rep. 2019. PMID: 31311829 Free PMC article.
-
MicroRNA regulation in neural tube defects: Insights into pathogenesis and potential therapeutic targets.Gene. 2025 Apr 15;945:149311. doi: 10.1016/j.gene.2025.149311. Epub 2025 Feb 4. Gene. 2025. PMID: 39914791 Review.
Cited by
-
Genes related to neural tube defects and glioblastoma.Sci Rep. 2025 Jan 30;15(1):3777. doi: 10.1038/s41598-025-86891-2. Sci Rep. 2025. PMID: 39885289 Free PMC article.
-
Adult-onset medulloblastoma presenting in the setting of untreated spina bifida: illustrative case.J Neurosurg Case Lessons. 2025 Mar 31;9(13):CASE24897. doi: 10.3171/CASE24897. Print 2025 Mar 31. J Neurosurg Case Lessons. 2025. PMID: 40164005 Free PMC article.
References
-
- Murray MJ, Lessey BA. Embryo implantation and tumor metastasis: Common pathways of invasion and angiogenesis. Semin Reprod Endocrinol. 1999;17(3):275–90. - PubMed
-
- Mishra PR, Barik M, Mahapatra AK. Molecular genetics involved in neural tube defects: Recent advances and future prospective for molecular medicine. Neurol India. 2020;68(5):1144–50. - PubMed
MeSH terms
Substances
LinkOut - more resources
Full Text Sources
Medical
Research Materials
Miscellaneous
