

High-dose-androgen-induced autophagic cell death to suppress the Enzalutamide-resistant prostate cancer growth via altering the circRNA-BCL2/miRNA-198/AMBRA1 signaling
- PMID: 35318303
- PMCID: PMC8941094
- DOI: 10.1038/s41420-022-00898-6
High-dose-androgen-induced autophagic cell death to suppress the Enzalutamide-resistant prostate cancer growth via altering the circRNA-BCL2/miRNA-198/AMBRA1 signaling
Abstract
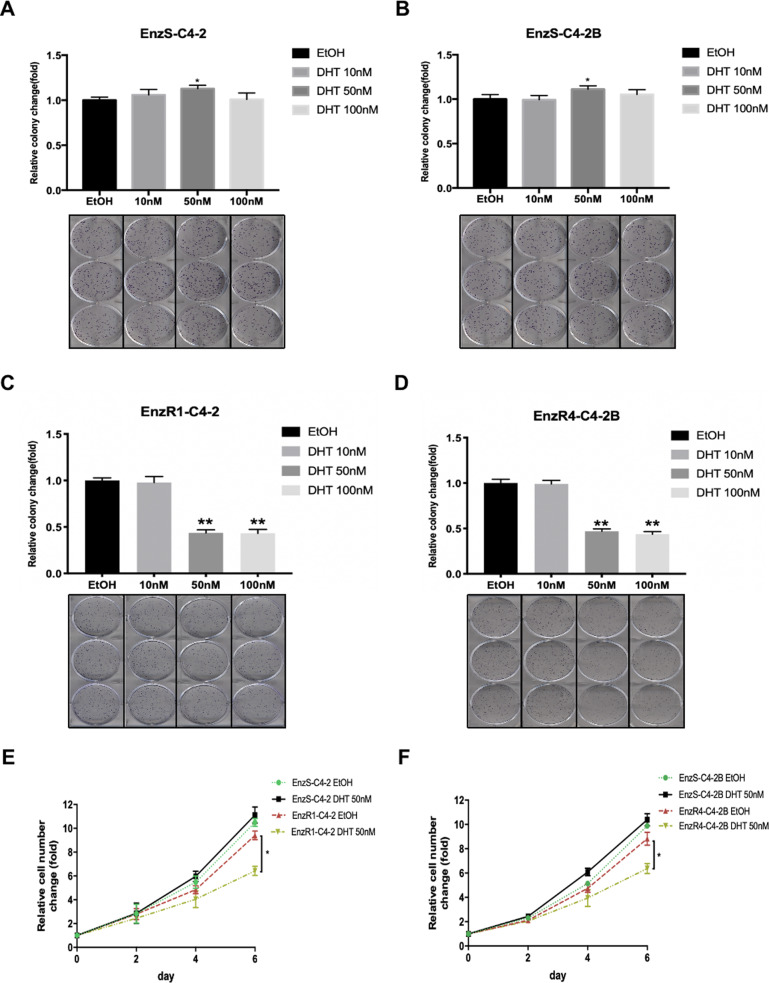
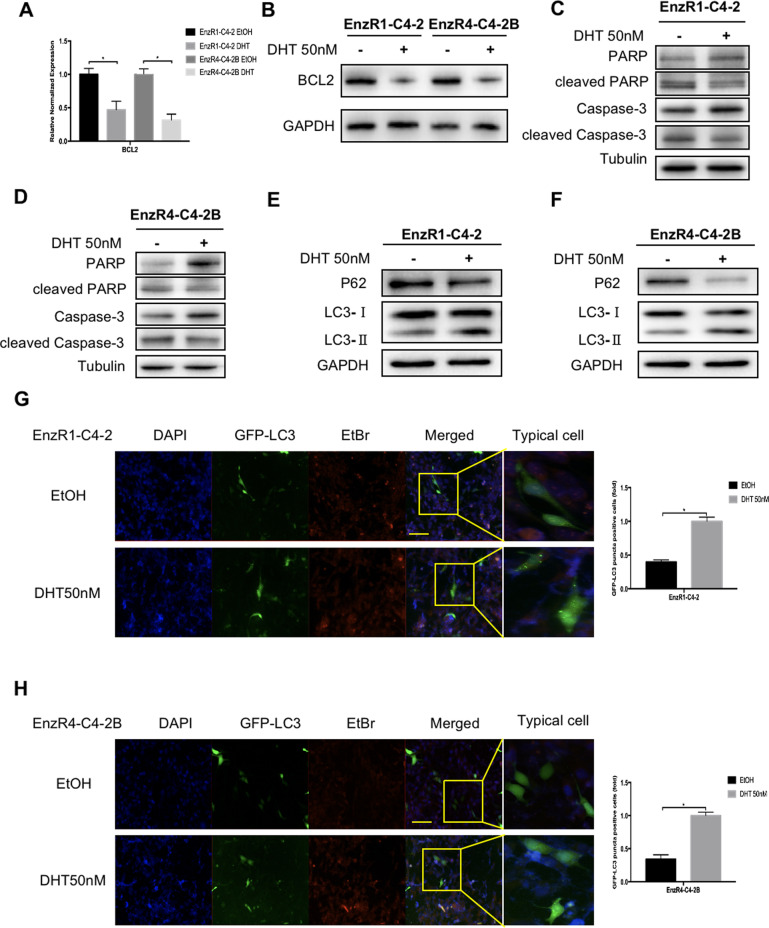
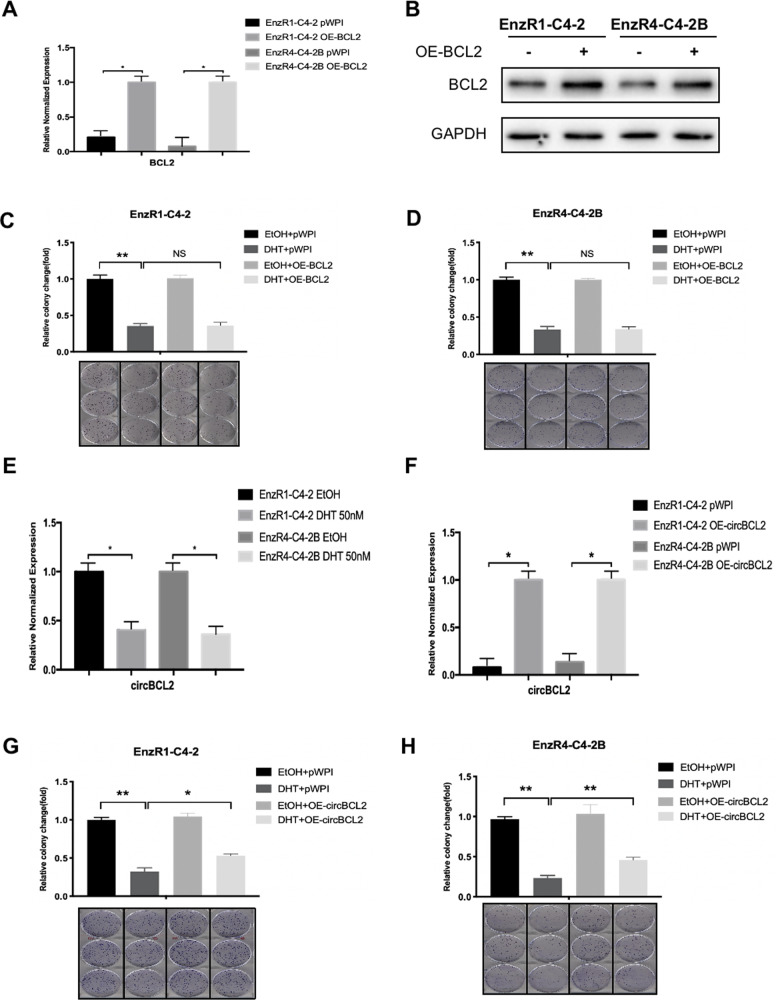
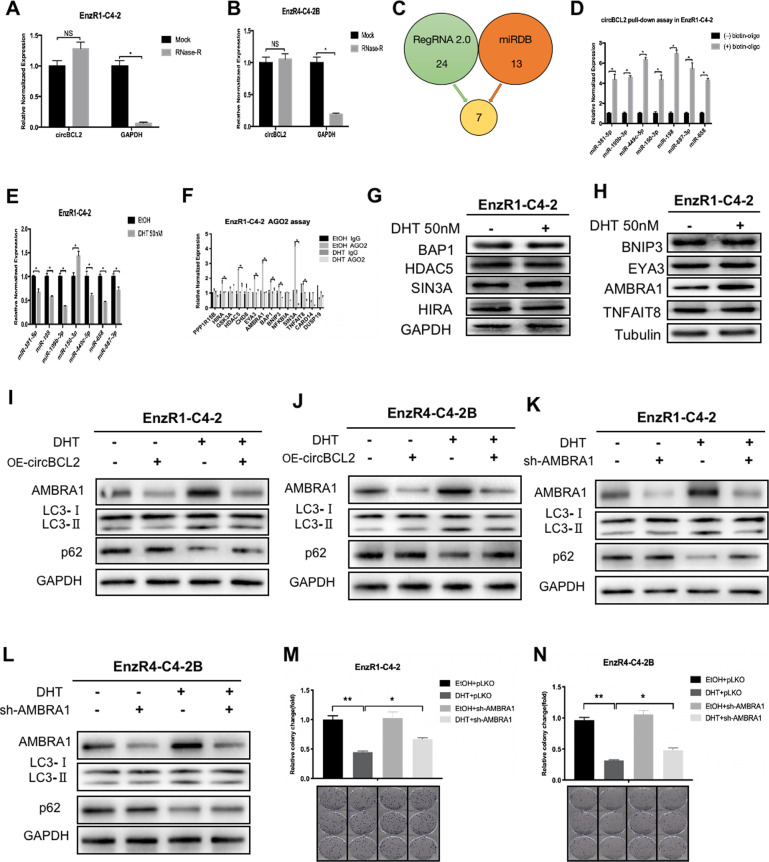
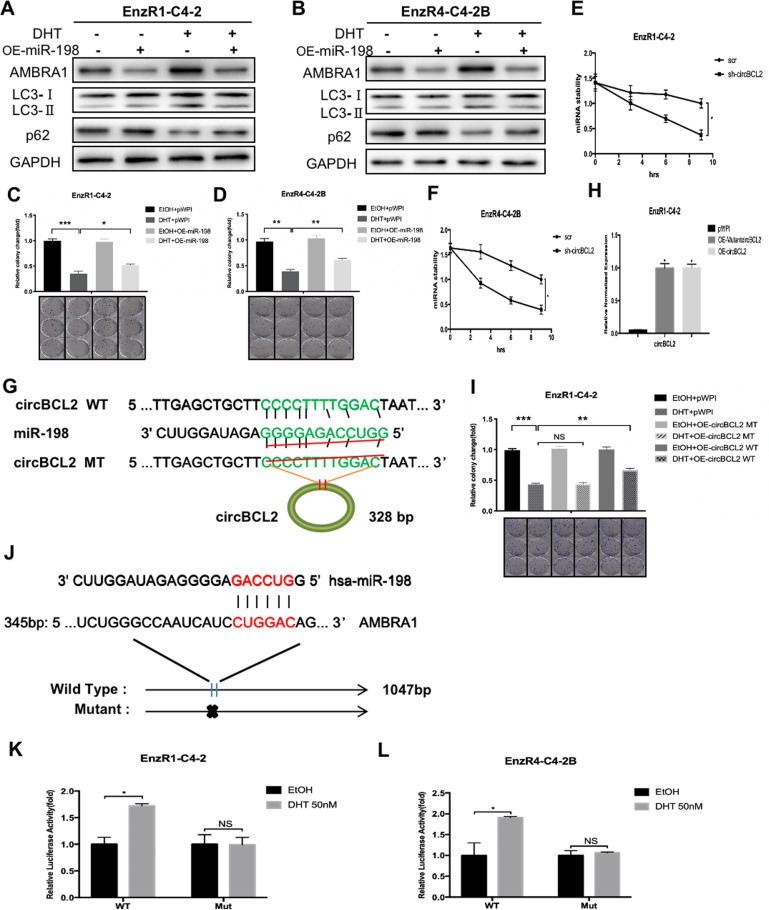
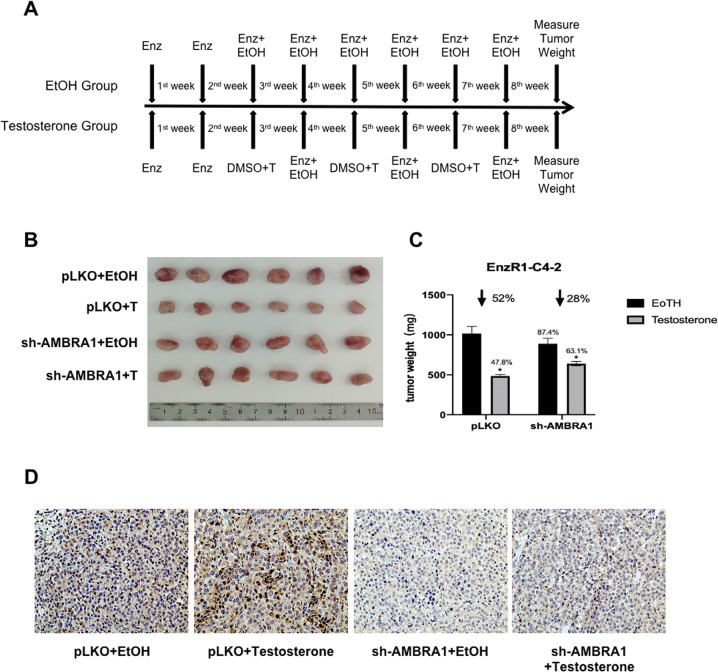
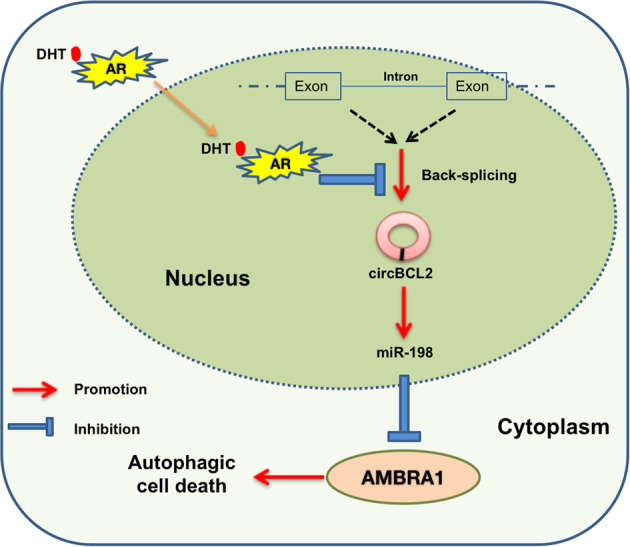
Androgen deprivation therapy (ADT) is a gold standard treatment for advanced PCa. However, most patients eventually develop the castration-resistant prostate cancer (CRPC) that progresses rapidly despite ongoing systemic androgen deprivation. While early studies indicated that high physiological doses of androgens might suppress rather than promote PCa cell growth in some selective CRPC patients, the exact mechanism of this opposite effect remains unclear. Here we found that Enzalutamide-resistant (EnzR) CRPC cells can be suppressed by the high-dose-androgen (dihydrotestosterone, DHT). Mechanism dissection suggested that a high-dose-DHT can suppress the circular RNA-BCL2 (circRNA-BCL2) expression via transcriptional regulation of its host gene BCL2. The suppressed circRNA-BCL2 can then alter the expression of miRNA-198 to modulate the AMBRA1 expression via direct binding to the 3'UTR of AMBRA1 mRNA. The consequences of high-dose-DHT suppressed circRNA-BCL2/miRNA-198/AMBRA1 signaling likely result in induction of the autophagic cell death to suppress the EnzR CRPC cell growth. Preclinical studies using in vivo xenograft mouse models also demonstrated that AMBRA1-shRNA to suppress the autophagic cell death can weaken the effect of high-dose-DHT on EnzR CRPC tumors. Together, these in vitro and in vivo data provide new insights for understanding the mechanisms underlying high-dose-DHT suppression of the EnzR CRPC cell growth, supporting a potential therapy using high-dose-androgens to suppress CRPC progression in the future.
© 2022. The Author(s).
Conflict of interest statement
The authors declare no competing interests.
Figures
Similar articles
-
Preclinical study using circular RNA 17 and micro RNA 181c-5p to suppress the enzalutamide-resistant prostate cancer progression.Cell Death Dis. 2019 Jan 15;10(2):37. doi: 10.1038/s41419-018-1048-1. Cell Death Dis. 2019. PMID: 30674872 Free PMC article.
-
Suppressing BCL-XL increased the high dose androgens therapeutic effect to better induce the Enzalutamide-resistant prostate cancer autophagic cell death.Cell Death Dis. 2021 Jan 11;12(1):68. doi: 10.1038/s41419-020-03321-z. Cell Death Dis. 2021. PMID: 33431795 Free PMC article.
-
CDK6 is upregulated and may be a potential therapeutic target in enzalutamide-resistant castration-resistant prostate cancer.Eur J Med Res. 2022 Jul 2;27(1):105. doi: 10.1186/s40001-022-00730-y. Eur J Med Res. 2022. PMID: 35780240 Free PMC article.
-
Androgen receptors in hormone-dependent and castration-resistant prostate cancer.Pharmacol Ther. 2013 Dec;140(3):223-38. doi: 10.1016/j.pharmthera.2013.07.003. Epub 2013 Jul 13. Pharmacol Ther. 2013. PMID: 23859952 Review.
-
The Crucial Role of AR-V7 in Enzalutamide-Resistance of Castration-Resistant Prostate Cancer.Cancers (Basel). 2022 Oct 5;14(19):4877. doi: 10.3390/cancers14194877. Cancers (Basel). 2022. PMID: 36230800 Free PMC article. Review.
Cited by
-
AMBRA1 and its role as a target for anticancer therapy.Front Oncol. 2022 Sep 27;12:946086. doi: 10.3389/fonc.2022.946086. eCollection 2022. Front Oncol. 2022. PMID: 36237336 Free PMC article. Review.
-
Role of Circular RNAs in Prostate Cancer.Curr Med Chem. 2024;31(29):4640-4656. doi: 10.2174/0929867330666230531095850. Curr Med Chem. 2024. PMID: 37259936 Review.
-
Strategies to Re-Sensitize Castration-Resistant Prostate Cancer to Antiandrogen Therapy.Biomedicines. 2023 Apr 6;11(4):1105. doi: 10.3390/biomedicines11041105. Biomedicines. 2023. PMID: 37189723 Free PMC article. Review.
-
Therapeutic importance and diagnostic function of circRNAs in urological cancers: from metastasis to drug resistance.Cancer Metastasis Rev. 2024 Sep;43(3):867-888. doi: 10.1007/s10555-023-10152-9. Epub 2024 Jan 22. Cancer Metastasis Rev. 2024. PMID: 38252399 Review.
-
Ambra1 modulates the sensitivity of mantle cell lymphoma to palbociclib by regulating cyclin D1.Sci Rep. 2023 May 24;13(1):8389. doi: 10.1038/s41598-023-35096-6. Sci Rep. 2023. PMID: 37225761 Free PMC article.
References
-
- Siegel RL, Miller KD, Jemal A. Cancer statistics, 2019. CA Cancer J Clin. 2019;69:7–34. - PubMed
-
- Miller KD, Nogueira L, Mariotto AB, Rowland JH, Yabroff KR, Alfano CM, et al. Cancer treatment and survivorship statistics, 2019. CA Cancer J Clin. 2019;69:363–85. - PubMed
-
- Carroll PH, Mohler JL. NCCN Guidelines updates: prostate cancer and prostate cancer early detection. J Natl Compr Canc Netw. 2018;16:620–3. - PubMed
LinkOut - more resources
Full Text Sources
