. 2022 Mar 22;13(3):257.
doi: 10.1038/s41419-022-04707-x.

UPF1 contributes to the maintenance of endometrial cancer stem cell phenotype by stabilizing LINC00963

Affiliations

UPF1 contributes to the maintenance of endometrial cancer stem cell phenotype by stabilizing LINC00963

Hao Chen et al. Cell Death Dis. .

Abstract

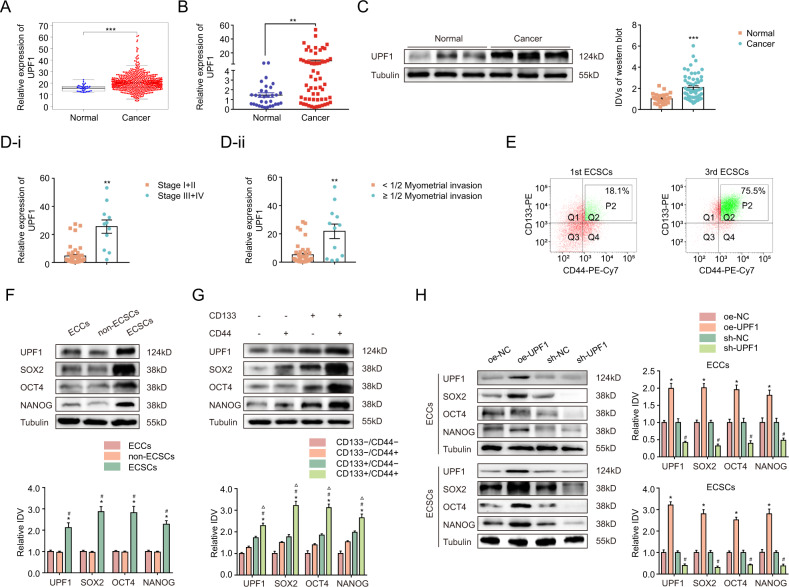
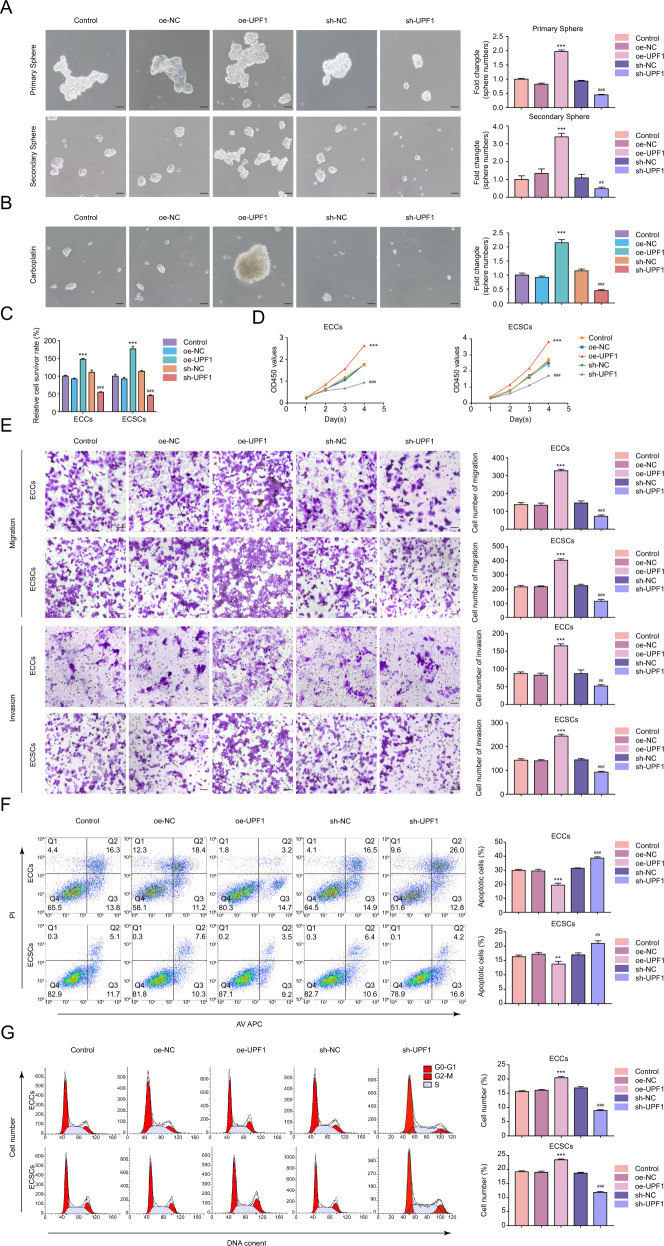
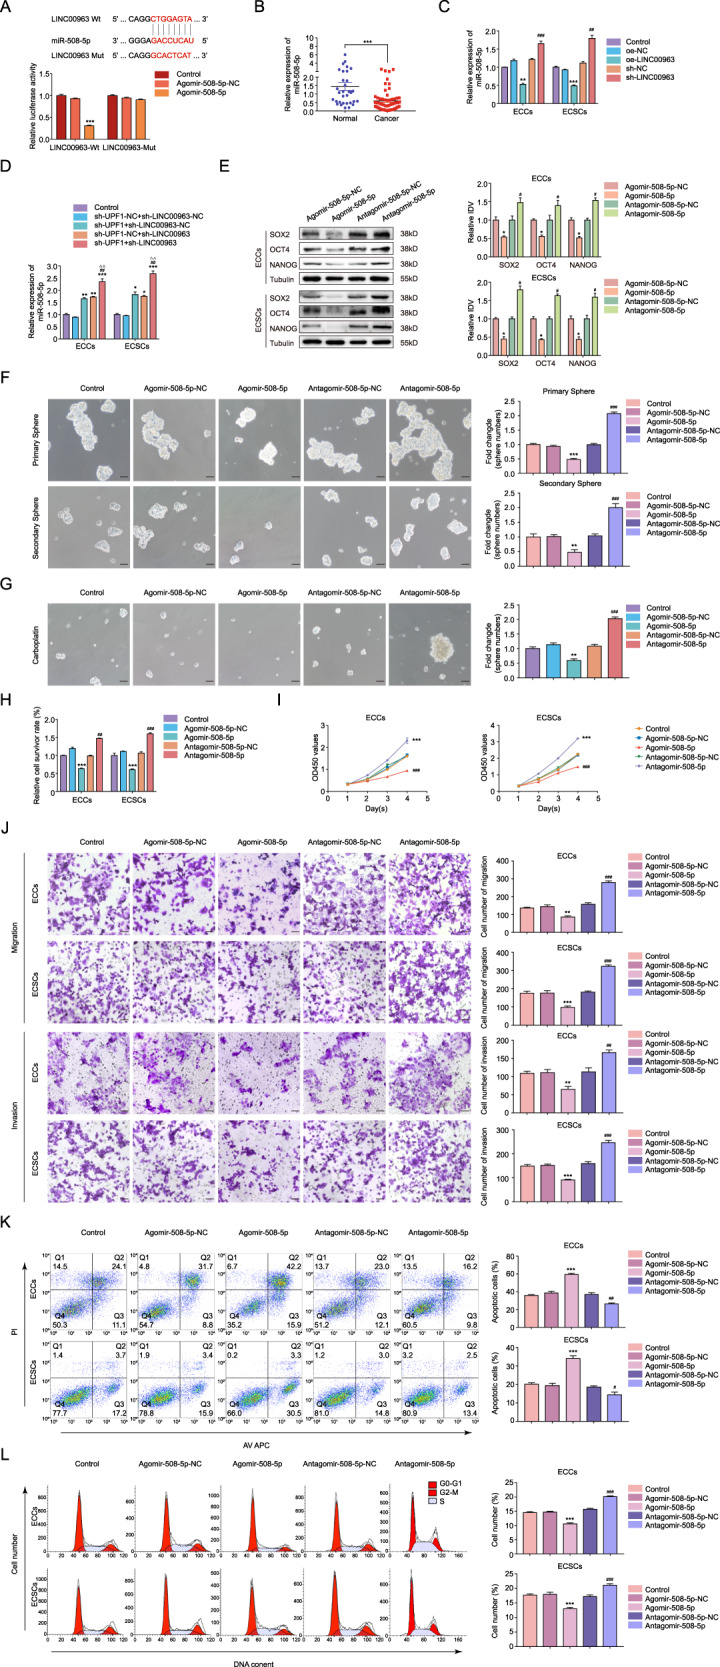
Endometrial cancer stem cells (ECSCs) play a vital role in endometrial cancer (EC) metastasis, relapse, and chemoresistance. However, the molecular mechanisms that sustain ECSCs remain elusive. Here, we showed that the expression of UPF1 was upregulated in EC tissues and ECSCs and correlated with poor clinicopathological characteristics. UPF1 silencing suppressed ECSC hallmarks, such as sphere formation ability, carboplatin resistance, migration and invasion, and cell cycle progression. UPF1 regulated the behavior and fate of ECSCs by stabilizing LINC00963. LINC00963 further shares the same miRNA response element with the core transcription factor SOX2 and relieved the suppression of SOX2 by miR-508-5p in self-renewing ECSCs. Notably, inhibition of UPF1 and LINC00963 in combination severely impaired the in vivo tumorigenic potential of ECSCs. We demonstrate that the UPF1/LINC00963/miR-508-5p/SOX2 axis has potential value in modulating ECSC maintenance, chemoresistance, and tumorigenesis in EC, which highlights a novel promising target for EC treatment.


Conflict of interest statement

The authors declare no competing interests.

Figures

Fig. 1
Fig. 1. UPF1 is upregulated in EC tissues and functioned as a signature gene of ECSCs.
A UPF1 expression levels in EC tissues (N = 546) and normal tissues (n = 33) in the TCGA cohort. B UPF1 expression levels in EC tissues (n = 58) compared to normal tissues (n = 32) detected using qRT-PCR. Data are presented as the means ± SEM, **P < 0.01. C UPF1 expression levels in EC tissues (n = 58) compared to normal tissues (n = 32) detected using western blotting. Data are presented as the means ± SEM, ***P < 0.001. D UPF1 expression levels in patients with different (D-i) tumor stages and (D-ii) myometrial invasion in EC tissues (n = 58) compared to normal tissues (n = 32). Data are presented as the means ± SEM, **P < 0.01. E Flow cytometry analysis of CD133+/CD44+ cells sorted from the 1st and 3rd ECSCs. F The expression of UPF1, SOX2, OCT4, and NANOG in ECCs, non-ECSCs, and ECSCs detected using western blotting. The results are presented as the ratio of the integrated density values of UPF1, SOX2, OCT4, and NANOG versus Tubulin. The graphs represent the alteration in relation to ECCs (protein of interest/Tubulin equal to 1). Data are presented as the means ± SEM (n = 3, each group), *P < 0.05 vs. ECCs group, #P < 0.05 vs. non-ECSCs group. G The expression of UPF1, SOX2, OCT4, and NANOG in CD133/CD44, CD133/CD44+, CD133+/CD44, and CD133+/CD44+ cells detected using western blotting. The results are presented as the ratio of the integrated density values of UPF1, SOX2, OCT4, and NANOG versus Tubulin and the graphs represent the alteration in relation to the CD44−/CD133− cells (protein of interest/Tubulin equal to 1). Data are presented as the means ± SEM (n = 3, each group), *P < 0.05 vs. CD133/CD44 group, #P < 0.05 vs. CD133/CD44+ group, △P < 0.05 vs. CD133+/CD44 group. H Effect of UPF1 overexpression or knockdown on SOX2, OCT4, and NANOG expression assessed using western blotting. The results are presented as the ratio of the integrated density values of UPF1, SOX2, OCT4, and NANOG versus Tubulin. The graphs represent the alteration in the oe-UPF1 group and the sh-UPF1 group relative to their respective control groups (protein of interest/Tubulin equal to 1). Data are presented as the means ± SEM, *P < 0.05 vs. oe-NC group, #P < 0.05 vs. sh-NC group.
Fig. 2
Fig. 2. UPF1 is required to maintain the ECSC phenotype.
A Effects of UPF1 on self-renewal capacity assessed using serial sphere formation assay. B Effects of UPF1 on carboplatin resistance assessed using the sphere formation assay. C Effects of UPF1 on carboplatin resistance assessed by the CCK8 assay. D Effects of UPF1 on proliferation assessed by the CCK8 assay. E Effects of UPF1 on migration and invasion assessed using the Transwell assay. F Effects of UPF1 on apoptosis assessed using flow cytometry analysis. G Effects of UPF1 on cell cycle progression assessed using flow cytometry analysis. Data are presented as the means ± SEM (n = 3, each group), **P < 0.01, ***P < 0.001 vs. oe-NC group, ##P < 0.01, ###P < 0.001 vs. sh-NC group. Scale bars, 50 μm.
Fig. 3
Fig. 3. UPF1 binds and positively regulates LINC00963.
A Western blotting of UPF1 immunoprecipitation. B Top 20 upregulated GO and C Top 20 upregulated KEGG metabolic pathways of peak-associated genes. D Binding sites and enrichment of UPF1 and LINC00963. E Binding of UPF1 and LINC00963 determined using the RIP assay. F Co-localization of UPF1 and LINC00963 determined using RNA-FISH and IF. Data are presented as the means ± SEM, ***P < 0.001. G Effect of UPF1 overexpression or knockdown on LINC00963 expression assessed using qRT-PCR. Data are presented as the means ± SEM (n = 3, each group), **P < 0.01, ***P < 0.001 vs. oe-NC group, ###P < 0.001 vs. sh-NC group. Scale bars, 50 μm.
Fig. 4
Fig. 4. LIN00963 enhances the tumorigenicity of ECSCs.
A LIN00963 expression levels in EC tissues (n = 58) compared to normal tissues (n = 32) detected using qRT-PCR. Data are presented as the means ± SEM, **P < 0.01. B Effects of LIN00963 overexpression or knockdown on SOX2, OCT4, and NANOG expression assessed using western blotting. The results are presented as the ratio of the integrated density values of SOX2, OCT4, and NANOG versus Tubulin. The graphs represent the alteration in the oe-LIN00963 group and the sh-LIN00963 group relative to their respective control groups (protein of interest/Tubulin equal to 1). C Effects of LIN00963 on self-renewal capacity assessed using serial sphere formation assay. D Effects of LIN00963 on carboplatin resistance assessed using the sphere formation assay. E Effects of LIN00963 on carboplatin resistance assessed using the CCK-8 assay. F Effects of LIN00963 on proliferation assessed using the CCK-8 assay. G Effects of LIN00963 on migration and invasion assessed using the Transwell assay. H Effects of LIN00963 on apoptosis assessed using flow cytometry analysis. I Effects of LIN00963 on cell cycle progression assessed using flow cytometry analysis. Data are presented as the means ± SEM (n = 3, each group), *P < 0.05, **P < 0.01, ***P < 0.001 vs. oe-NC group, #P < 0.05, ##P < 0.01, ###P < 0.001 vs. sh-NC group. Scale bars, 50 μm.
Fig. 5
Fig. 5. UPF1 regulates the biological behavior of ECSCs by stabilizing LINC00963.
A LIN00963 RNA half-life measured using qRT-PCR after actinomycin D treatment. B Effects of UPF1 and LIN00963 inhibition on SOX2, OCT4, and NANOG expression assessed using western blotting. The results are presented as the ratio of the integrated density values of SOX2, OCT4, and NANOG versus Tubulin. The graphs represent the alteration in relation to the sh-UPF1-NC + sh-LINC00963-NC group (protein of interest/Tubulin equal to 1). C Effects of UPF1 and LIN00963 inhibition on self-renewal capacity assessed using serial sphere formation assay. D Effects of UPF1 and LIN00963 inhibition on carboplatin resistance assessed using the sphere formation assay. E Effects of UPF1 and LIN00963 inhibition on carboplatin resistance assessed using the CCK8 assay. F Effects of UPF1 and LIN00963 inhibition on proliferation assessed using the CCK8 assay. G Effects of UPF1 and LIN00963 inhibition on migration and invasion assessed using the Transwell assay. H Effects of UPF1 and LIN00963 inhibition on apoptosis assessed using flow cytometry analysis. I Effects of UPF1 and LIN00963 inhibition on cell cycle progression assessed using flow cytometry analysis. Data are presented as the means ± SEM (n = 3, each group), *P < 0.05, **P < 0.01, ***P < 0.001 vs. sh-UPF1-NC + sh-LINC00963-NC group, #P < 0.05, ##P < 0.01, ###P < 0.001 vs. sh-UPF1 + sh-LINC00963-NC group, △P < 0.05, △△P < 0.01, △△△P < 0.001 vs. sh-UPF1-NC + sh-LINC00963 group. Scale bars, 50 μm.
Fig. 6
Fig. 6. MiR-508-5p is a target of LINC00963 and functions as a tumor suppressor in ECSCs.
A The predicted miR-508-5p binding sites in the 3′UTR region of LINC00963 (LINC00963-Wt) and the designed mutant sequence (LINC00963-Mut) are indicated. Relative luciferase activity was conducted after cells were transfected with LINC00963-Wt or LINC00963-Mut, ***P < 0.001 vs. LINC00963-Wt+Agomir-508-5p-NC group. B MiR-508-5p expression levels in EC tissues (n = 58) compared to normal tissues (n = 32) detected using qRT-PCR, ***P < 0.001. C Effects of LIN00963 overexpression or knockdown on miR-508-5p expression assessed using qRT-PCR, **P < 0.01, ***P < 0.001 vs. oe-NC group, ##P < 0.01, ###P < 0.001 vs. sh-NC group. D Effects of UPF1 and LIN00963 inhibition on miR-508-5p expression assessed using qRT-PCR, *P < 0.05, **P < 0.01, ***P < 0.001 vs. sh-UPF1-NC + sh-LINC00963-NC group, ##P < 0.01 vs. sh-UPF1 + sh-LINC00963-NC group, △△P < 0.01 vs. sh-UPF1-NC + sh-LINC00963 group. E Effect of miR-508-5p overexpression or knockdown on SOX2, OCT4, and NANOG expression assessed using western blotting. The results are presented as the ratio of the integrated density values of SOX2, OCT4, and NANOG versus Tubulin. The graphs represent the alteration in the agomir-508-5p group and the antagomir-508-5p group relative to their respective control groups (protein of interest/Tubulin equal to 1). F Effects of miR-508-5p on self-renewal capacity assessed using serial sphere formation assay. G Effects of miR-508-5p on carboplatin resistance assessed using the sphere formation assay. H Effects of miR-508-5p on carboplatin resistance assessed using the CCK8 assay. I Effect of miR-508-5p on proliferation assessed using the CCK8 assay. J Effect of miR-508-5p on migration and invasion assessed using the Transwell assay. K Effects of miR-508-5p on apoptosis assessed using flow cytometry analysis. L Effects of miR-508-5p on cell cycle progression assessed using flow cytometry analysis. Data are presented as the means ± SEM (n = 3, each group), *P < 0.05, **P < 0.01, ***P < 0.001 vs. Agomir-508-5p-NC group, #P < 0.05, ##P < 0.01, ###P < 0.001 vs. Antagomir-508-5p-NC group. Scale bars, 50 μm.
Fig. 7
Fig. 7. MiR-508-5p/SOX2 axis is responsible for the stemness-promoting effects of LINC00963.
A The predicted miR-508-5p binding sites in the 3′UTR region of SOX2 (SOX2-Wt) and the designed mutant sequence (SOX2-Mut) are indicated. Relative luciferase activity was conducted after cells were transfected with SOX2-Wt or SOX2-Mut, ***P < 0.001 vs. SOX2-Wt+Agomir-508-5p-NC group. B Effects of LIN00963 and miR-508-5p on SOX2, OCT4, and NANOG expression assessed using western blotting. The results are presented as the ratio of the integrated density values of SOX2, OCT4, and NANOG versus Tubulin. The graphs represent the alteration in relation to the sh-NC + agomir-508-5p-NC group (protein of interest/Tubulin equal to 1). C Effects of LIN00963 and miR-508-5p on self-renewal capacity assessed using serial sphere formation assay. D Effects of LIN00963 and miR-508-5p on carboplatin resistance assessed using the sphere formation assay. E Effects of LIN00963 and miR-508-5p on carboplatin resistance assessed using the CCK8 assay. F Effects of LIN00963 and miR-508-5p on proliferation assessed using the CCK8 assay. G Effects of LIN00963 and miR-508-5p on migration and invasion assessed using the Transwell assay. H Effects of LIN00963 and miR-508-5p on apoptosis assessed using flow cytometry analysis. I Effects of LIN00963 and miR-508-5p on cell cycle progression assessed using flow cytometry analysis. Data were presented as the means ± SEM (n = 3, each group), *P < 0.05, **P < 0.01, ***P < 0.001 vs. sh-NC + agomir-508-5p-NC group.
Fig. 8
Fig. 8. UPF1 regulates ECSC initiation via the LINC00963/miR-508-5p axis in vivo.
Tumorigenicity assessed by the A morphology, B volumes, and C weights of xenografts formed from ECSCs transfected with sh-NC and sh-UPF1 (n = 3, each group). D Tumorigenicity initiating capacity of the minimum number of ECSCs transfected with sh-NC and sh-UPF1 (n = 6, each group). E The nude mice carrying tumors from the respective groups are shown. The sample tumors from the respective groups are shown (n = 3, each group). F Tumor growth curves are shown (n = 3, each group). G Expression of SOX2, OCT4, and NANOG from the respective groups assessed using western blotting (n = 3, each group). The results are presented as the ratio of the integrated density values of SOX2, OCT4, and NANOG versus Tubulin. The graphs represent the alteration in relation to the control group (protein of interest/Tubulin equal to 1). H Apoptosis of tumors from the respective groups detected using TUNEL assays (n = 3, each group). I The primary and secondary spheres numbers of xenograft-derived cells detected by serial sphere formation assay (n = 3, each group). J The proposed mechanism underlying the UPF1/LINC00963/miR-508-5p/SOX2 axis in ECSCs. Data are presented as the means ± SEM (n = 3, each group), *P < 0.05, **P < 0.01, ***P < 0.001 vs. Control group, #P < 0.05, ##P < 0.01 vs. sh-UPF1 group, △△P < 0.01 vs. sh-LINC00963 group, ▲P < 0.05, ▲▲P < 0.01 vs. Agomir-508-5p group. Scale bars, 50 μm.

Similar articles

Cited by

References

    1. Xu Q, Ge Q, Zhou Y, Yang B, Yang Q, Jiang S, et al. MELK promotes Endometrial carcinoma progression via activating mTOR signaling pathway. EBioMedicine. 2020;51:102609. - PMC - PubMed
    1. Lu H, Ju DD, Yang GD, Zhu LY, Yang XM, Li J, et al. Targeting cancer stem cell signature gene SMOC-2 Overcomes chemoresistance and inhibits cell proliferation of endometrial carcinoma. EBioMedicine. 2019;40:276–89. - PMC - PubMed
    1. Wortman BG, Bosse T, Nout RA, Lutgens L, van der Steen-Banasik EM, Westerveld H, et al. Molecular-integrated risk profile to determine adjuvant radiotherapy in endometrial cancer: Evaluation of the pilot phase of the PORTEC-4a trial. Gynecol Oncol. 2018;151:69–75. - PubMed
    1. Urick ME, Bell DW. Clinical actionability of molecular targets in endometrial cancer. Nat Rev Cancer. 2019;19:510–21. - PMC - PubMed
    1. Emons G, Kim JW, Weide K, de Gregorio N, Wimberger P, Trillsch F, et al. Endometrial Cancer Lymphadenectomy Trial (ECLAT) (pelvic and para-aortic lymphadenectomy in patients with stage I or II endometrial cancer with high risk of recurrence; AGO-OP.6) Int J Gynecol Cancer. 2021;31:1075–9. - PubMed

Publication types