. 2022 Mar 22;13(1):1532.
doi: 10.1038/s41467-022-29155-1.

Midbrain projection to the basolateral amygdala encodes anxiety-like but not depression-like behaviors

Affiliations

Midbrain projection to the basolateral amygdala encodes anxiety-like but not depression-like behaviors

Carole Morel et al. Nat Commun. .

Abstract

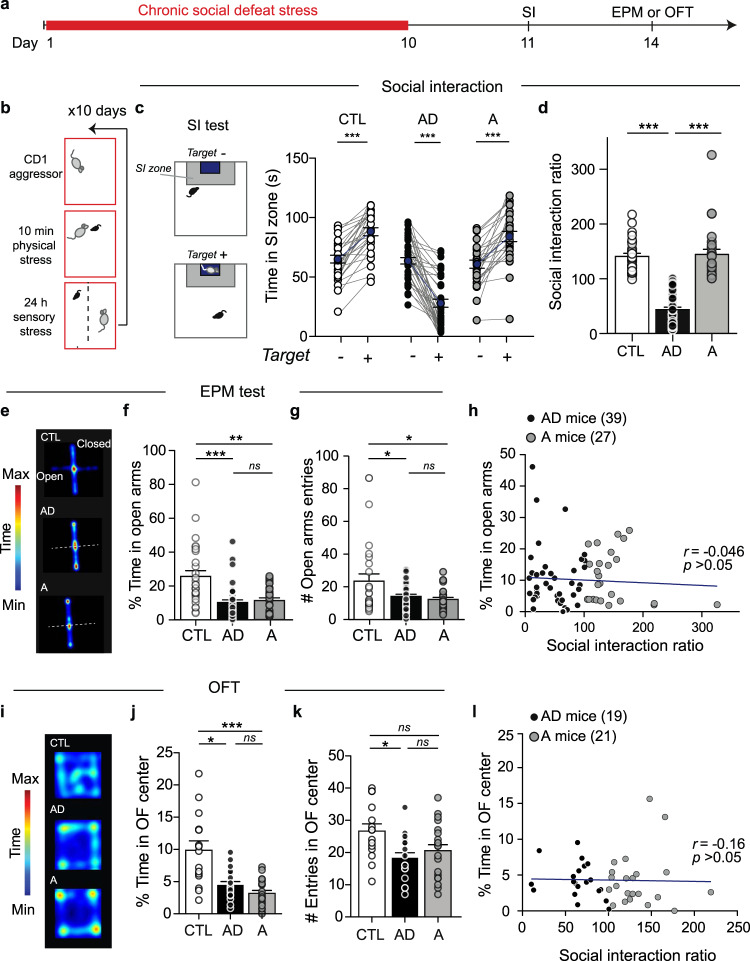
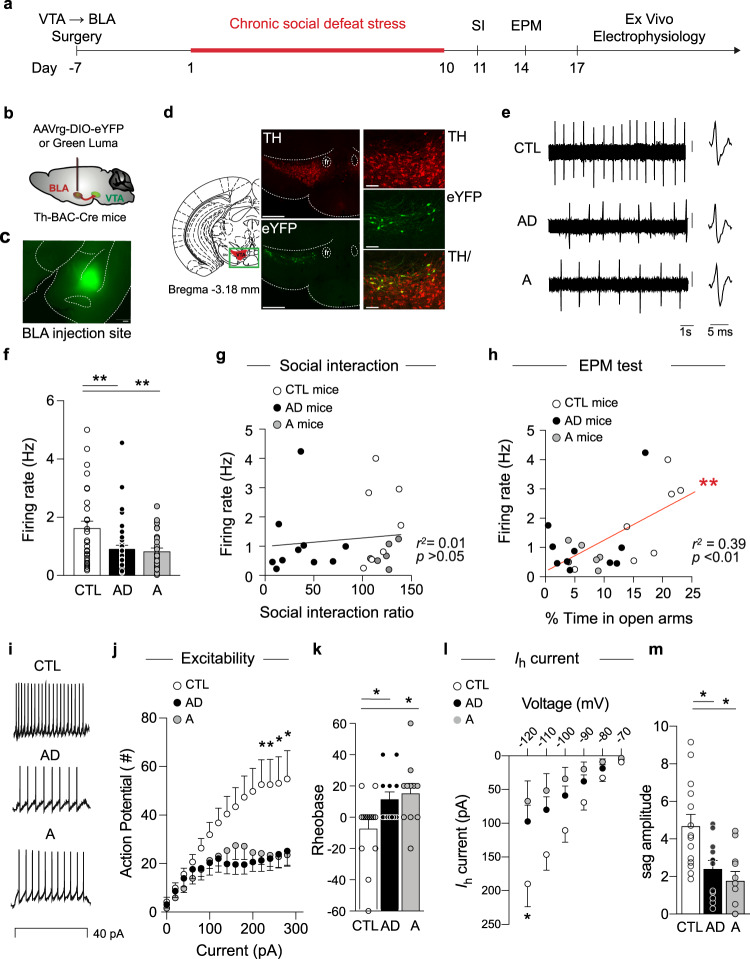
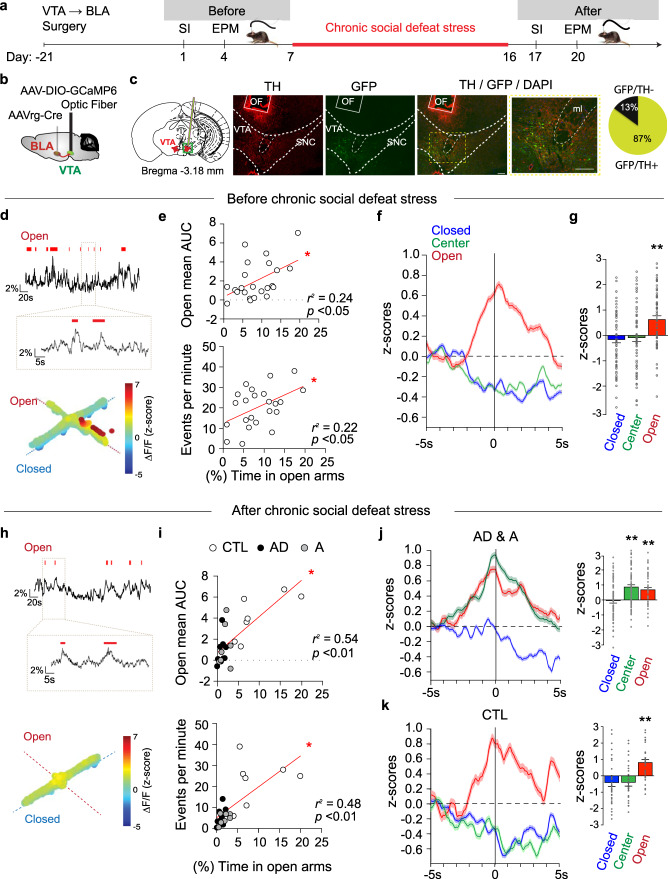
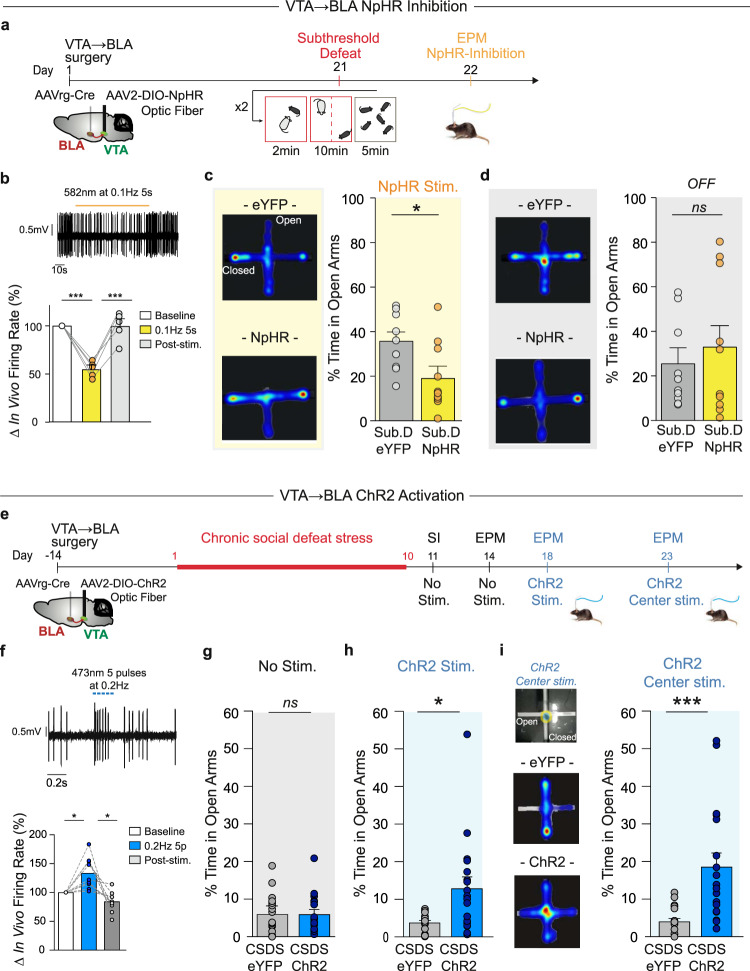
Anxiety disorders are complex diseases, and often co-occur with depression. It is as yet unclear if a common neural circuit controls anxiety-related behaviors in both anxiety-alone and comorbid conditions. Here, utilizing the chronic social defeat stress (CSDS) paradigm that induces singular or combined anxiety- and depressive-like phenotypes in mice, we show that a ventral tegmental area (VTA) dopamine circuit projecting to the basolateral amygdala (BLA) selectively controls anxiety- but not depression-like behaviors. Using circuit-dissecting ex vivo electrophysiology and in vivo fiber photometry approaches, we establish that expression of anxiety-like, but not depressive-like, phenotypes are negatively correlated with VTA → BLA dopamine neuron activity. Further, our optogenetic studies demonstrate a causal link between such neuronal activity and anxiety-like behaviors. Overall, these data establish a functional role for VTA → BLA dopamine neurons in bi-directionally controlling anxiety-related behaviors not only in anxiety-alone, but also in anxiety-depressive comorbid conditions in mice.


Conflict of interest statement

The authors declare no competing interests.

Figures

Fig. 1
Fig. 1. CSDS induces anxiety-related behaviors independently of social avoidance behavior.
a Experimental timeline for social interaction (SI) and elevated plus maze (EPM) or open field (OFT) tests. b Schematic of CSDS paradigm. c SI behavior in stress-naïve control (CTL) and socially defeated mice: AD mice display depressive-like social avoidance behavior and anxiety-like phenotype, and A mice exhibit only anxiety-like behavior (see data panels below), blue circles represent mean ± s.e.m. (Paired t-tests, n = 28 CTL t = 9.02 p = 1.22e−09, n = 39 AD t = 10.38 p = 1.27e−12, and n = 27 A mice t = 6.78 p = 3.38e−07, examined over 3 independent replicated experiments). d Resulting social interaction ratio, another way to analyze SI behavior that measures stable, relative time spent in SI zone (mean ± s.e.m., Kruskal–Wallis test, H2/91 = 67.37; Z = 6.997 p < 0.001; Z = 6.80 p < 0.001; Z = 0.114 p = 0.99). e Heatmap representation of the time spent in EPM compartments in CTL, AD, and A mice. f Time in EPM open arms (Kruskal–Wallis test, H2/91 = 22.36; Z = 4.585 p < 0.001; Z = 3.432 p = 0.002; Z = 0.8381 p = 0.99) and g EPM open arm entries in AD and A mice compared to control mice (ANOVA, F(2, 91) = 5.258 p = 0.007; t = 2.763 p = 0.01, t = 2.912 p = 0.09; t = 0.403 p = 0.69; n = 28 CTL, n = 39 AD and n = 27 A mice, examined over 3 independent replicated experiments, bars represent mean ± s.e.m.). h Pearson correlation analyses of the time in open arms with the social interaction behaviors of socially stressed mice (n = 66, p = 0.74). i Heatmap representation of the time spent in the open field arena in CTL, AD, and A mice. j Time (%) in open field center (Kruskal–Wallis test, H2/52 = 17.55, p = 0.0001; Z = 2.728 p = 0.02; Z = 4.168 p = 0.0001; Z = 1.474 p = 0.42) and k number of open field center entries (ANOVA, F2/52 = 4.831 p = 0.01; t = 3.032 p = 0.01; t = 2.293 p = 0.05; t = 0.859 p = 0.39; n = 15 CTL, n = 19 AD and n = 21 A mice, bars represent mean ± s.e.m.). l Pearson correlation analyses of the time in open field center with the social interaction behaviors of socially stressed mice (n = 40, p = 0.017). In all panels, two-sided statistical analyses and post hoc tests were performed, *p < 0.05, **p < 0.01, ***p < 0.001, ns p > 0.05, for n number of C57BL6/J mice. See also Supplementary Figs. 1 and 2.
Fig. 2
Fig. 2. Anxiety-like behavior correlates with the hypoactivity of VTA → BLA dopamine neurons.
a Experimental timeline. b Schematic of the brain surgery to dissect VTA → BLA circuit. c BLA surgery injection site (scale bar=500 μm). d Morphological validation showing the targeted VTA → BLA dopamine neurons in TH-BAC-Cre mice injected with AAVrg-DIO-eYFP (scale bar = 500 and 100 μm, representative images of the 23 recorded mice). e Sample traces of ex vivo cell-attached recordings from CTL, AD, and A mice (scale bar = 0.2 mV). f Spontaneous firing activity of VTA → BLA dopamine neurons in AD and A mice compared to control mice (mean ± s.e.m., ANOVA, F(2, 104) = 6.750 p = 0.0018; post hoc test, t = 3.48 p = 0.002; t = 3.50 p = 0.003, n = 30, 31, 45 neurons, n = 23 combined C57BL6/J and TH-BAC-Cre mice injected with AAVrg-DIO-eYFP and Green Luma, respectively). g Pearson correlation analyses of VTA → BLA dopamine neuron firing with the social interaction behavior after CSDS (p = 0.59, 3–7 neurons per mouse, n = 23 combined C57BL6/J and TH-BAC-Cre mice). h Pearson correlation analyses of VTA → BLA dopamine neuron firing activity with the time in EPM open arms (p = 0.0015, 3–7 neurons per mouse, n = 23 combined C57BL6/J and TH-BAC-Cre mice). i Sample traces of ex vivo whole-cell recordings from CTL, AD, and A mice at a 40 pA step current injection. j VTA → BLA dopamine neurons excitability in AD and A mice compared to CTL mice following incremental steps in currents injections (20–280 pA; mean ± s.e.m., RM two-way ANOVA: group effect: F(2, 33) = 3.818 p = 0.021; Interaction F(28, 434) = 3.164 p = 1.08e−07; post hoc tests: t = 2.41 p = 0.04; t = 2.53 p = 0.04; t = 1.95 p = 0.04; t = 2.63 p = 0.04; t = 1.64 p = 0.04; t = 2.52 p = 0.04; t = 1.72 p = 0.04; t = 2.25 p = 0.04; n = 11, 12, 14 neurons/4, 5, 6 TH-BAC-Cre mice). k VTA → BLA dopamine neurons rheobase in AD and A mice compared to CTL mice (mean ± s.e.m., ANOVA: Group effect: F(2, 33) = 4.016 p = 0.013; post hoc tests t = 2.43 p = 0.04; t = 2.85 p = 0.02; n = 11, 13, 14 neurons/4, 5, 6 TH-BAC-Cre mice). l VTA → BLA dopamine neurons hyperpolarization-activated current, i.e., Ih current in AD and A mice compared to CTL mice following incremental voltage steps (mean ± s.e.m., RM two-way ANOVA: group effect: F(2, 33) = 4.194 p = 0.017; interaction F(10, 175) = 3.393 p = 9.7e−06; post hoc tests t = 2.22 p = 0.04; t = 2.71 p = 0.025; n = 11, 13, 14 neurons/4, 5, 6 TH-BAC-Cre mice). m VTA → BLA dopamine neurons sag ratio in AD and A mice compared to CTL mice (mean ± s.e.m., ANOVA: group effect: F(2, 32) = 7.225 p = 0.001; t = 3.04 p = 0.009; t = 3.79 p = 0.002, n = 11, 13, 14 neurons/4–6 TH-BAC-Cre mice). In all panels, two-sided statistical analyses post hoc corrected tests were performed, *p < 0.05, **p < 0.01. See also Supplementary Fig. 3.
Fig. 3
Fig. 3. Anxiety-like behavior is associated with the dynamics of VTA → BLA neurons.
a Experimental timeline. b Schematic of the brain surgery targeting the VTA → BLA circuit. c Confocal image showing morphological validation of the placement of the optic fiber (OF) above the VTA and the co-expression of TH labeling with AAVrg-Cre-eYFP X AAV-DIO-GCaMP6 in the C57BL6/J mouse VTA (scale bar, 100 μm); quantification shows 87% colocalization (3–4 sections per mouse from 3 mice). d–g Before CSDS. d (Top) Sample traces of GCamp6 ΔF/F signal (bars represent the mouse in open arms). (Bottom) 3D representation of the GCamp6 ΔF/F upon the mouse position within the EPM. e Correlation analyses of the time spent in EPM open arms with (top, Pearson, p = 0.02) the mean open arms AUC VTA → BLA activity and (bottom, Pearson, p = 0.02) with the number of events per minute (n = 23 mice, examined across 3 independent replicated experiments). f Dynamics of GCamp6 signal (mean z-scores ± s.e.m.) 5 s before and 5 s after the mice enter EPM closed arms, center and open arms. g Averaged GCamp6 z-scores across stress-naïve mice within a 1-s bin (−0.5 to +0.5 s) time-locked to EPM closed arms, center or open arms entries (mean ± s.e.m., ANOVA, F2/276 = 10.94 p = 2.6e−05; t = 4.32 p = 2.4e−05; t = 3.88 p = 1.7e−04, n = 80, 98,100 epochs). hk After CSDS. h (Top) Sample traces of GCamp6 ΔF/F signal (bars represent the mouse in EPM open arms). (Bottom) 3D representation of the GCamp6 ΔF/F upon the mouse position within the EPM. i Correlation analyses of the time spent in EPM open arms with the mean open arms AUC VTA → BLA activity (top, Pearson, p = 0.001) and with the number of events per minute (bottom, Pearson, n = 23 mice, p = 0.0002). j (Left) Dynamics of GCamp6 signal (mean z-scores ± s.e.m.) 5 s before and 5 s after the socially stressed mice enter in EPM closed arms, center and open arms and (Right) related averaged GCamp6 z-scores across socially stressed mice within a 1-s bin (−0.5 to +0.5 s) time-locked to EPM closed arms, center or open arms entries in socially defeated mice (mean ± s.e.m., ANOVA, F2/188 = 11.79 1.5e−05; t = 4.71 p = 0.001; t = 3.25 p = 0.003, n = 46, 65, 79 epochs). k Same as j in stress-naïve CTL mice (mean ± s.e.m., ANOVA, F2/92 = 10.59 p = 4.4e−05, t = 4.11 p = 0.001; t = 3.9 p = 0.001; n = 30, 30, 35 epochs). In all panels, two-sided statistical analyses and corrected post hoc tests were performed, *p < 0.05, **p < 0.01. See also Supplementary Figs. 4 and 5.
Fig. 4
Fig. 4. VTA → BLA neuronal activity controls anxiety-like behavior.
a Experimental timeline and schematic of subthreshold social defeat stress (Sub.D) experiment. b (Top) sample trace of in vivo photo-tagged recordings and (bottom) the mean ± s.e.m. averaged decreased firing activity of VTA → BLA dopamine neurons upon NpHR-optogenetic manipulation (0.1 Hz, 5 s pulse width, i.e., alternating 5 s ON and 5 s OFF during the 5 min EPM test period, ANOVA F(2, 8) = 48.44 p = 3.4e−05; t = 8.35 p = .001; t = 8.68 p = 0.001). c Heatmap representation and time spent in EPM open arms of Sub.D experienced mice expressing eYFP (Sub.D-eYFP) or NpHR (Sub.D-NpHR) during the NpHR-optogenetic manipulation (t-tests, t = 2.419, p = 0.027, n = 9,10 C57BL6/J mice). d Heatmap representation and time spent in EPM open arms of the same mice while laser stimulation is not applied (t-test, t = 0.554, p = 0.58, n = 9,10 mice). e Experimental timeline and schematic of brain surgery to dissect the VTA → BLA circuit. f Sample trace of in vivo photo-tagging recordings and (bottom) the mean ± s.e.m. averaged increased firing activity of VTA → BLA dopamine neurons upon ChR2-optogenetic stimulation (RM ANOVA F(2, 8) = 12.11 p = 0.006; t = 3.67 p = 0.01; t = 3.54 p = 0.01). g Time spent in open arms of mice exposed to CSDS expressing eYFP (CSDS-eYFP) or ChR2 (CSDS-ChR2) in VTA → BLA neurons while light stimulation is not applied (t-test, t = 0.029, p = 0.97, n = 17,19 C57BL6/J mice). h ChR2-optogenetic stimulation is applied during the 5 min EPM test (Mann–Whitney test, U = 88, p = 0.01, n = 17,19 mice). i ChR2-optogenetic stimulation is applied selectively to the EPM center. (Left) Schematic of the selective ChR2-optogenetic stimulation to the EPM center and heatmap representation of time spent in EPM compartments in CSDS-eYFP and CSDS-ChR2 mice. (Right) Resulting time spent in open arms of CSDS-ChR2 mice compared to the CSDS-eYFP mice (Mann–Whitney test, U = 41, p = 0.001, n = 17,19 mice). In all panels, data are represented as mean ± s.e.m.; two-sided statistical analyses and post hoc corrected tests were performed, *p < 0.05, **p < 0.01, ***p < 0.001. See also Supplementary Figs. 6–11.

Similar articles

Cited by

References

    1. Kessler RC, et al. Lifetime and 12-month prevalence of DSM-III-R psychiatric disorders in the United States. Arch. Gen. Psychiatry. 1994;51:8–19. - PubMed
    1. Kessler RC, et al. Lifetime prevalence and age-of-onset distributions of DSM-IV disorders in the National Comorbidity Survey Replication. Arch. Gen. Psychiatry. 2005;62:593–602. - PubMed
    1. Whiteford HA, et al. Global burden of disease attributable to mental and substance use disorders: findings from the Global Burden of Disease Study 2010. Lancet. 2013;382:1575–1586. - PubMed
    1. Tolu S, et al. Co-activation of VTA DA and GABA neurons mediates nicotine reinforcement. Mol. Psychiatry. 2013;18:382–393. - PubMed
    1. King-Kallimanis B, Gum AM, Kohn R. Comorbidity of depressive and anxiety disorders for older Americans in the national comorbidity survey-replication. Am. J. Geriatr. Psychiatry. 2009;17:782–792. - PubMed

Publication types