. 2022 Mar 22;13(1):1531.
doi: 10.1038/s41467-022-29229-0.

Brain-wide projection reconstruction of single functionally defined neurons

Affiliations

Brain-wide projection reconstruction of single functionally defined neurons

Meng Wang et al. Nat Commun. .

Abstract

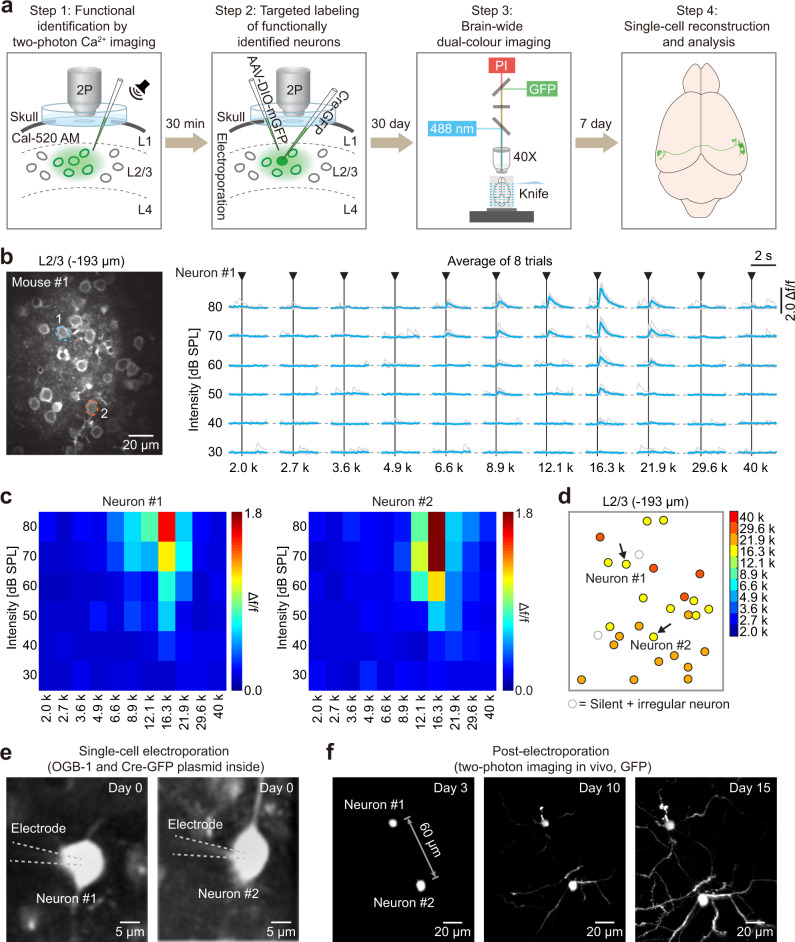
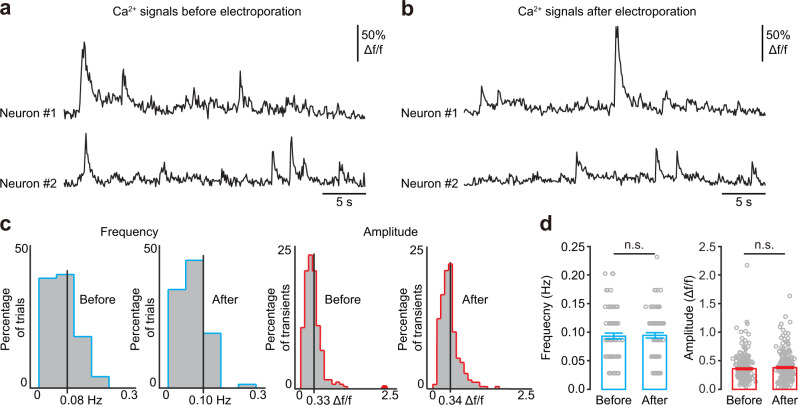
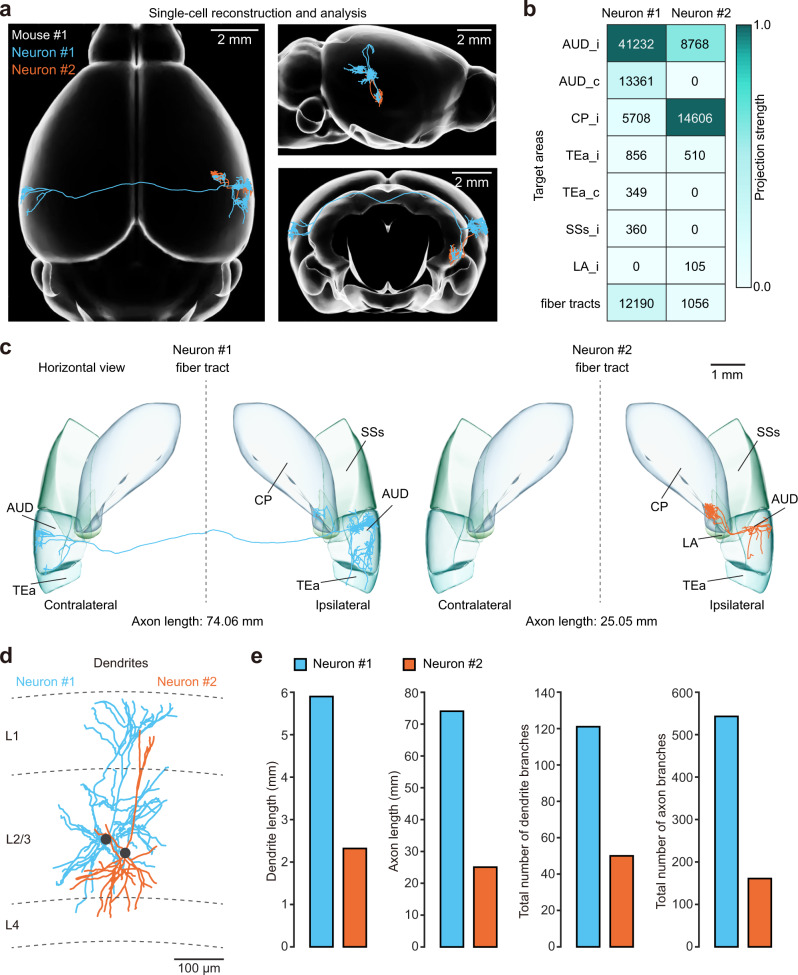
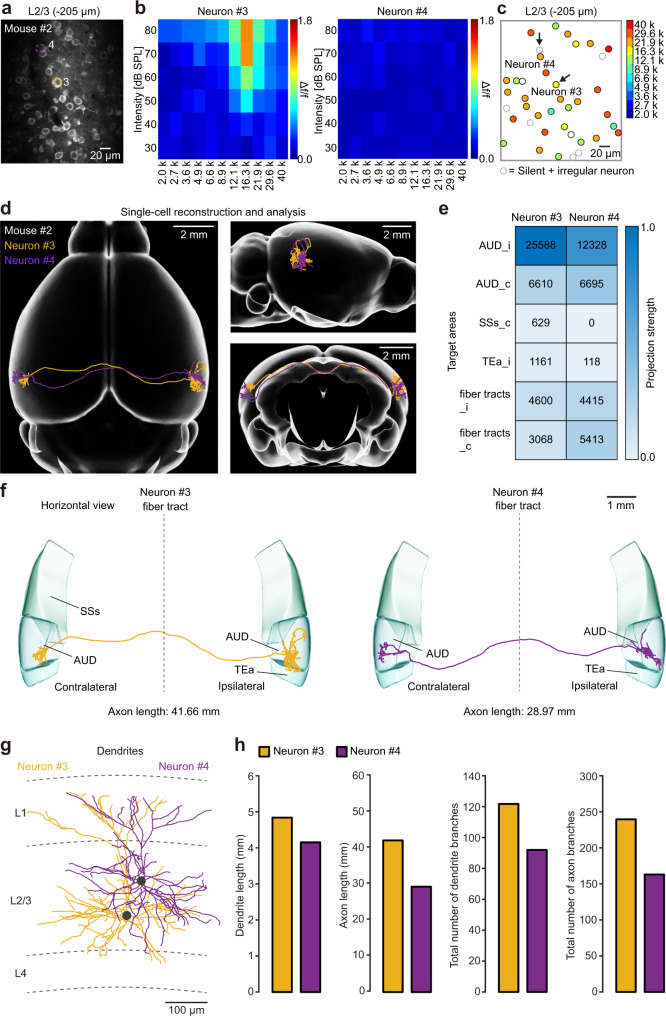
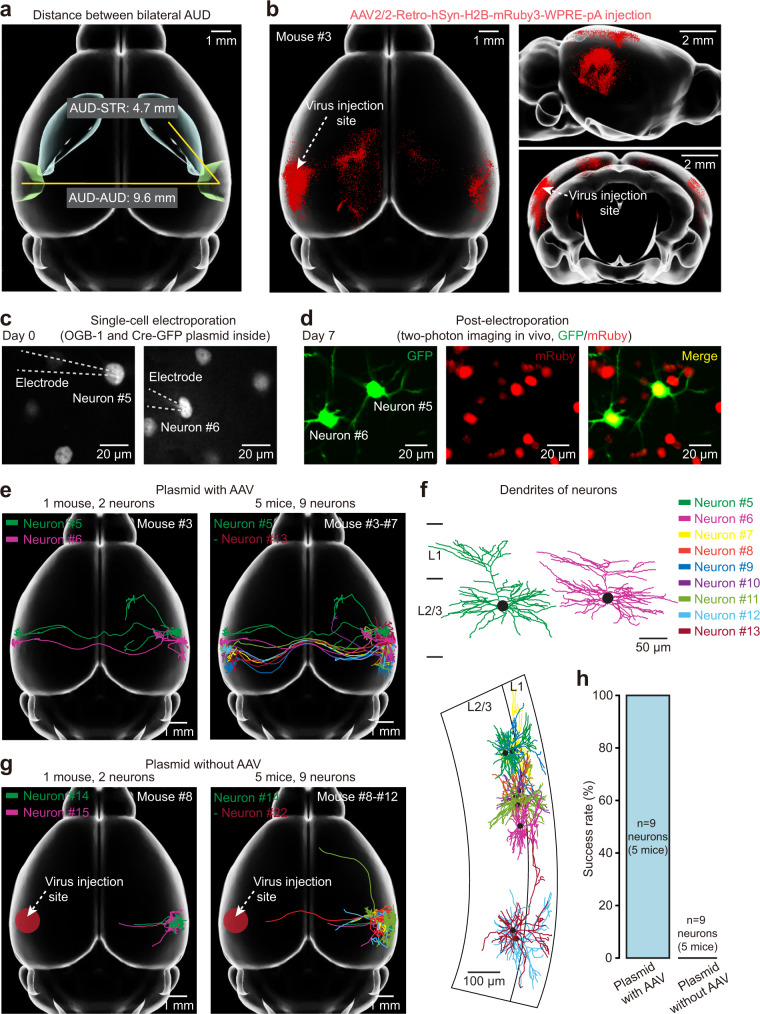
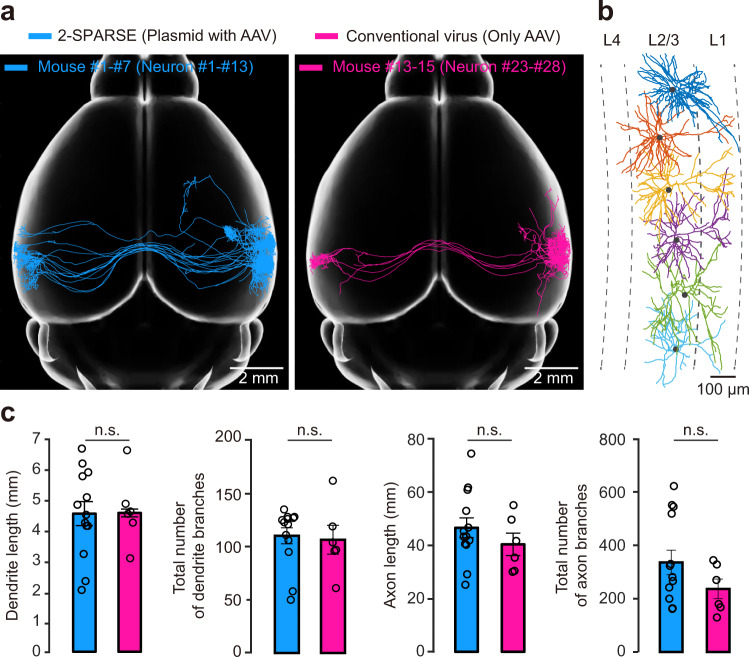
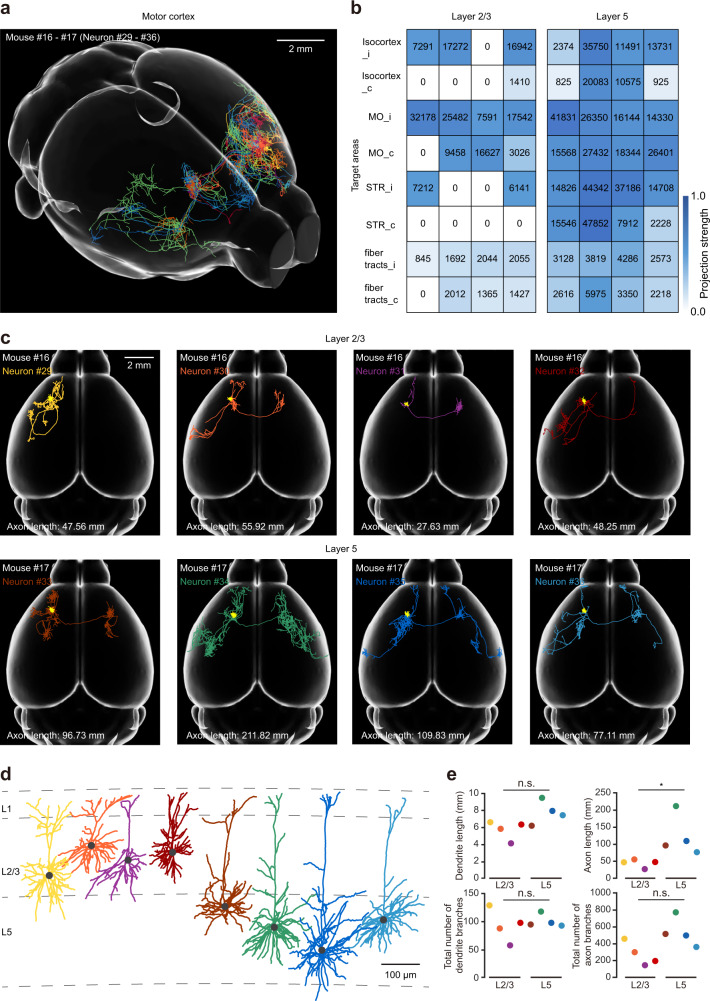
Reconstructing axonal projections of single neurons at the whole-brain level is currently a converging goal of the neuroscience community that is fundamental for understanding the logic of information flow in the brain. Thousands of single neurons from different brain regions have recently been morphologically reconstructed, but the corresponding physiological functional features of these reconstructed neurons are unclear. By combining two-photon Ca2+ imaging with targeted single-cell plasmid electroporation, we reconstruct the brain-wide morphologies of single neurons that are defined by a sound-evoked response map in the auditory cortices (AUDs) of awake mice. Long-range interhemispheric projections can be reliably labelled via co-injection with an adeno-associated virus, which enables enhanced expression of indicator protein in the targeted neurons. Here we show that this method avoids the randomness and ambiguity of conventional methods of neuronal morphological reconstruction, offering an avenue for developing a precise one-to-one map of neuronal projection patterns and physiological functional features.


Conflict of interest statement

The authors declare no competing interests.

Figures

Fig. 1
Fig. 1. Online targeted labelling of single functionally defined neurons.
a Four key steps for data collection and processing. b Left: Representative two-photon image in L2/3 of the AUD of an awake mouse. Two neurons were chosen and are marked with dashed coloured lines. Right: Ca2+ transients (neuron #1) responding to pure-tone stimulation (average of 8 trials for each of 6 intensities and 11 frequencies). Single-trial (grey) and trial-averaged (blue) Ca2+ transients are shown. c Colour-coded FRAs of the two neurons marked in (b). d Best frequency map of all the neurons in the imaging plane shown in (b). The colour code is on the right side. e Demonstration of single-cell electroporation. Briefly, pipettes containing OGB-1 and Cre-GFP plasmid were advanced towards the somata of neuron #1 and neuron #2. Then, the dye and DNA plasmids were electroporated into the neurons by applying trains of voltage pulses. f Monitoring of the fluorescence intensities of the two electroporated neurons by two-photon imaging on different days (day 3, day 10, and day 15) after electroporation.
Fig. 2
Fig. 2. Single-cell electroporation did not alter spontaneous neuronal activity.
a, b Spontaneous Ca2+ signals of two neurons before (a) and one hour after (b) electroporation (the same neurons as in Fig. 1b). c Distribution of the frequency (left) and amplitude (right) of spontaneous Ca2+ transients before and after electroporation. d Bar graphs summarizing the frequency (n = 78 trials for both cases, 39 neurons, 16 mice; P = 0.7228, two-sided Wilcoxon signed-rank test) and amplitude (before: n = 252 transients; after: n = 260 transients, 39 neurons, 16 mice; P = 0.2844, two-sided Wilcoxon rank-sum test, n.s., P > 0.05). The data with error bars represent mean ± SEM.
Fig. 3
Fig. 3. Whole-brain reconstruction of individual functionally similar neurons.
a Two reconstructed neurons (neurons #1 and #2) registered to the standard Allen Brain Atlas are shown in horizontal (left), sagittal (upper right) and coronal (lower right) views. b Projection strengths of the two neurons. The projection strength of each neuron was calculated as the axon length per target area normalized by the length of the axon receiving the densest innervation. The colour code reflecting the projection strength is shown on the right. c The two reconstructed neurons are displayed separately. The target areas are coloured as indicated. d The complete dendrites of the two brain-wide reconstructed neurons are displayed in different colours (neuron #1: cyan; neuron #2: orange). The grey dashed lines indicate laminar borders. The two neuronal somata are located in L2/3. e Comparisons of dendrite and axon lengths and total numbers of axonal and dendritic branches between neuron #1 and neuron #2. AUD auditory areas; CP caudatoputamen; LA lateral amygdalar nucleus; SSs supplemental somatosensory area; TEa temporal association areas; c contralateral; i ipsilateral.
Fig. 4
Fig. 4. Whole-brain reconstruction of single functionally distinct neurons.
a A representative two-photon image showing L2/3 neurons of the AUD of a head-fixed awake mouse. b Colour-coded FRAs of the two neurons marked in (a). c Best frequency map of all the neurons in the imaging plane shown in (a). The colour code is on the right. d Two reconstructed neurons (neurons #3 and #4) registered to the standard Allen Brain Atlas are shown in horizontal (left), sagittal (upper right), and coronal (lower right) views. e Projection strengths of the two neurons. The colour code reflecting the projection strength is on the right. f The two reconstructed neurons are displayed separately. The target areas are coloured as indicated. g The dendrites of the two brain-wide reconstructed neurons are displayed in different colours. The grey dashed lines indicate laminar borders. The two neuronal somata are located in L2/3. h Comparisons of the dendritic and axonal lengths and total numbers of axonal and dendritic branches between neuron #3 and neuron #4. AUD auditory areas; SSs supplemental somatosensory area; TEa temporal association areas.
Fig. 5
Fig. 5. Axons projecting to the contralateral AUD can be reliably labelled and reconstructed.
a The distance between the ipsilateral and contralateral AUDs is twice as long as that between the ipsilateral AUD and striatum. b Brain-wide distributions of AUD-projecting neurons achieved by a retrograde labelling strategy (AAV2/2-Retro-mRuby3). The detected somata were registered to the standard Allen Brain Atlas, as denoted by red dots. The white dashed arrow indicates the injection site. Three different views are shown (left: horizontal; upper right: sagittal; lower right: coronal). c Demonstration of single-cell electroporation. d Representative example showing two-photon imaging of two dual-colour labelled neurons (neurons #5 and #6) on day 7 after electroporation. e Left, reconstruction of two representative neurons (neurons #5–6; obtained from one mouse) labelled with a plasmid together with local AAV injection. Right, reconstruction of nine neurons (neurons #5–13; obtained from five mice) labelled with a plasmid with local AAV injection. f Reconstructed dendrites of the two representative neurons (top) in (e) (left) and all nine neurons (bottom) in (e) (right). g Left, reconstruction of two representative neurons (neurons #14–15; obtained from one mouse) labelled with a plasmid without nearby AAV injection. Right panel, reconstruction of nine neurons (neurons #14–22; obtained from five brains) labelled with a plasmid without nearby AAV injection. h Comparison of the success rates of axonal terminal filling in the contralateral AUD with a plasmid with AAV injection and without AAV injection (n = 9 neurons from 5 mice for each group).
Fig. 6
Fig. 6. Comparisons of efficacy between 2-SPARSE and a conventional virus expression system in the AUD.
a All reconstructed neurons labelled by 2-SPARSE (neurons #1–13; cyan) or a conventional virus expression system (neurons #23–28; pink). The neurons were registered to the standard Allen Brain Atlas and are shown with horizontal view. b Dendritic morphologies of five reconstructed neurons (corresponding to the pink neurons in (a) labelled with a conventional virus. All neurons are located in the L2/3 and displayed in different colours. The grey dashed lines indicate the laminar borders. c Comparisons of dendritic and axonal lengths and total numbers of axonal and dendritic branches between the neurons labelled by 2-SPARSE (n = 13 neurons) and the conventional virus expression system (n = 6 neurons). The data with error bars represent the mean ± SEM. P = 0.8314, P = 0.3556, P = 0.4155, and P = 0.4524 for the dendritic length, dendrite branch number, axon length, and axon branch number comparisons, respectively; two-sided Wilcoxon rank-sum test, n.s., P > 0.05.
Fig. 7
Fig. 7. Labelling and reconstruction of IT neurons in the motor cortex by 2-SPARSE.
a Three-dimensional visualization of IT neurons in the motor cortex. b Projection patterns of all the reconstructed IT neurons. The columns represent individual IT neurons. The colour code is shown on the right side. c Horizontal view of the complete morphology of individual IT neurons with different colour coding. Dendrites are shown in yellow. d Dendrite morphologies of the reconstructed neurons in (c). The grey dashed lines indicate laminar borders. e Comparisons of dendritic (P = 0.1143) and axonal lengths (P = 0.0286) and the total numbers of dendritic (P = 0.7429) and axonal branches (P = 0.0571) between the reconstructed L2/3 neurons and L5 neurons in the motor cortex. n = 4 neurons for both cases, two-sided Wilcoxon rank-sum test, n.s. P > 0.05, *P < 0.05.

Similar articles

Cited by

References

    1. Rancz EA, et al. Transfection via whole-cell recording in vivo: Bridging single-cell physiology, genetics, and connectomics. Nat. Neurosci. 2011;14:527–532. - PMC - PubMed
    1. Pollak Dorocic I, et al. A whole-brain atlas of inputs to serotonergic neurons of the dorsal and median raphe nuclei. Neuron. 2014;83:663–678. - PubMed
    1. Zingg B, et al. Neural networks of the mouse neocortex. Cell. 2014;156:1096–1111. - PMC - PubMed
    1. Osten P, Margrie TW. Mapping brain circuitry with a light microscope. Nat. Methods. 2013;10:515–523. - PMC - PubMed
    1. Parekh R, Ascoli GA. Neuronal morphology goes digital: A research hub for cellular and system neuroscience. Neuron. 2013;77:1017–1038. - PMC - PubMed

Publication types