

Transplantation of MITO cells, mitochondria activated cardiac progenitor cells, to the ischemic myocardium of mouse enhances the therapeutic effect
- PMID: 35318358
- PMCID: PMC8941106
- DOI: 10.1038/s41598-022-08583-5
Transplantation of MITO cells, mitochondria activated cardiac progenitor cells, to the ischemic myocardium of mouse enhances the therapeutic effect
Abstract
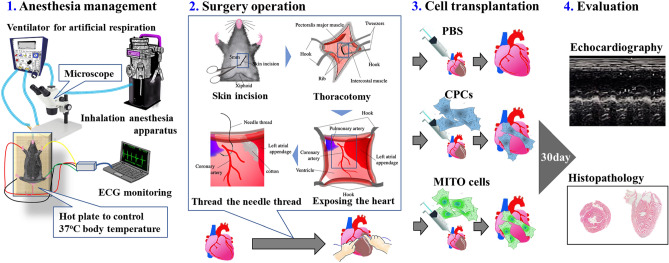
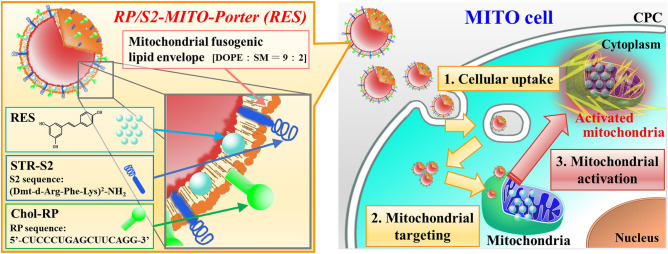
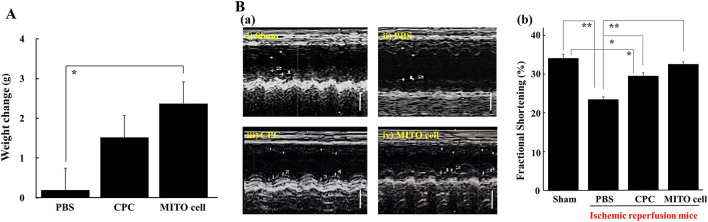
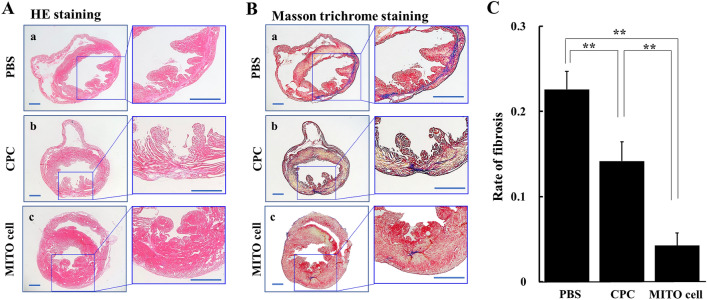
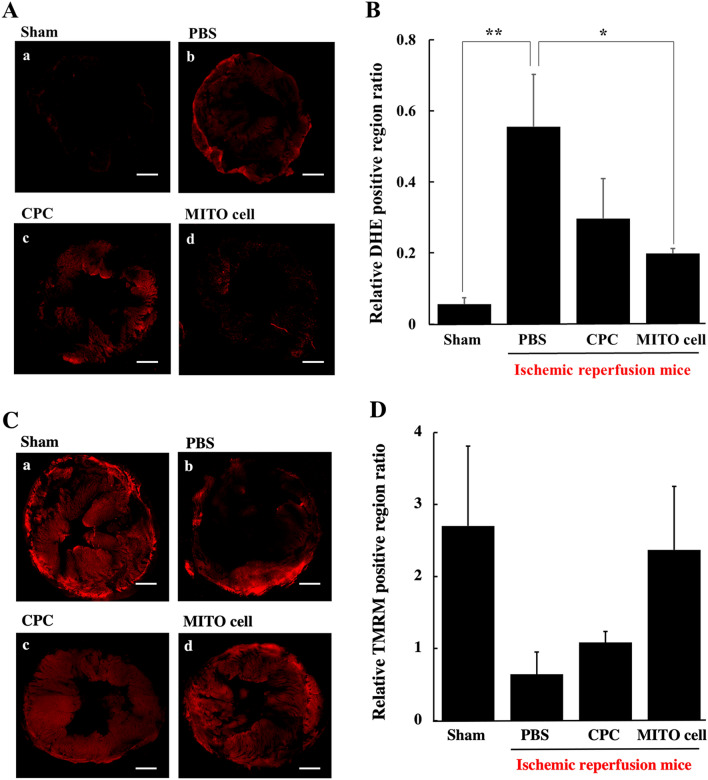
Given the potential for myocardial stem cell transplantation as a promising treatment for heart failure, numerous clinical trials have been conducted and its usefulness has been clearly confirmed. However, the low rate of engraftment of transplanted cells has become a clinical problem, and this needs to be improved in the case of transplanting cells to the heart. To address this issue, we report on attempts to prepare mitochondria-activated stem cells (MITO cells) for use in transplantation. MITO cells, which is cardiac progenitor cells (CPCs) activated by the mitochondrial delivery of resveratrol with an anti-oxidant and mitochondrial activation effects were successfully prepared using a mitochondrial targeting nanocarrier (MITO-Porter). The purpose of this study was to validate the therapeutic effect of cell transplantation by the MITO cells using a mouse model of myocardial ischemia-reperfusion. Mouse CPCs were used as transplanted cells. The transplantation of CPCs and MITO cells were conducted after myocardial ischemia-reperfusion, and the therapeutic effect was determined. The MITO cells transplanted group showed increase in postoperative weight gain, improve cardiac function and inhibition of fibrosis compared to the non-transplanted group and the CPC group. The transplantation of MITO cells to the ischemic myocardium showed a stronger transplantation effect compared to conventional CPC transplantation.
© 2022. The Author(s).
Conflict of interest statement
The authors declare no competing interests.
Figures
Similar articles
-
Cardiac progenitor cells activated by mitochondrial delivery of resveratrol enhance the survival of a doxorubicin-induced cardiomyopathy mouse model via the mitochondrial activation of a damaged myocardium.J Control Release. 2018 Jan 10;269:177-188. doi: 10.1016/j.jconrel.2017.11.024. Epub 2017 Nov 14. J Control Release. 2018. PMID: 29146241
-
Human cardiosphere-derived cells with activated mitochondria for better myocardial regenerative therapy.J Control Release. 2024 Mar;367:486-499. doi: 10.1016/j.jconrel.2024.01.058. Epub 2024 Feb 3. J Control Release. 2024. PMID: 38295995
-
Apoptosis-Resistant Cardiac Progenitor Cells Modified With Apurinic/Apyrimidinic Endonuclease/Redox Factor 1 Gene Overexpression Regulate Cardiac Repair After Myocardial Infarction.Stem Cells Transl Med. 2016 Aug;5(8):1067-78. doi: 10.5966/sctm.2015-0281. Epub 2016 Jun 22. Stem Cells Transl Med. 2016. PMID: 27334489 Free PMC article.
-
What can we do to optimize mitochondrial transplantation therapy for myocardial ischemia-reperfusion injury?Mitochondrion. 2023 Sep;72:72-83. doi: 10.1016/j.mito.2023.08.001. Epub 2023 Aug 6. Mitochondrion. 2023. PMID: 37549815 Review.
-
Mitochondria as a therapeutic target for cardiac ischemia‑reperfusion injury (Review).Int J Mol Med. 2021 Feb;47(2):485-499. doi: 10.3892/ijmm.2020.4823. Epub 2020 Dec 16. Int J Mol Med. 2021. PMID: 33416090 Free PMC article. Review.
Cited by
-
Mitochondrial Quantity and Quality in Age-Related Sarcopenia.Int J Mol Sci. 2024 Feb 8;25(4):2052. doi: 10.3390/ijms25042052. Int J Mol Sci. 2024. PMID: 38396729 Free PMC article. Review.
-
Mitochondrial transplantation for cardioprotection and induction of angiogenesis in ischemic heart disease.Stem Cell Res Ther. 2025 Feb 7;16(1):54. doi: 10.1186/s13287-025-04193-w. Stem Cell Res Ther. 2025. PMID: 39920826 Free PMC article. Review.
-
Monocarboxylate transporter 4 involves in energy metabolism and drug sensitivity in hypoxia.Sci Rep. 2023 Jan 27;13(1):1501. doi: 10.1038/s41598-023-28558-4. Sci Rep. 2023. PMID: 36707650 Free PMC article.
-
Novel Insights into Psychosis and Antipsychotic Interventions: From Managing Symptoms to Improving Outcomes.Int J Mol Sci. 2024 May 28;25(11):5904. doi: 10.3390/ijms25115904. Int J Mol Sci. 2024. PMID: 38892092 Free PMC article. Review.
-
RNA Delivery to Mitochondria.Handb Exp Pharmacol. 2024;284:329-339. doi: 10.1007/164_2023_650. Handb Exp Pharmacol. 2024. PMID: 37017791
References
-
- Schachinger V, et al. Intracoronary infusion of bone marrow-derived mononuclear cells abrogates adverse left ventricular remodelling post-acute myocardial infarction: Insights from the reinfusion of enriched progenitor cells and infarct remodelling in acute myocardial infarction (REPAIR-AMI) trial. Eur. J. Heart Fail. 2009;11:973–979. doi: 10.1093/eurjhf/hfp113. - DOI - PubMed
Publication types
MeSH terms
LinkOut - more resources
Full Text Sources
Other Literature Sources
