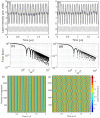
Time crystal dynamics in a weakly modulated stochastic time delayed system
- PMID: 35318359
- PMCID: PMC8940923
- DOI: 10.1038/s41598-022-08776-y
Time crystal dynamics in a weakly modulated stochastic time delayed system
Abstract
Time crystal oscillations in interacting, periodically driven many-particle systems are highly regular oscillations that persist for long periods of time, are robust to perturbations, and whose frequency differs from the frequency of the driving signal. Making use of underlying similarities of spatially-extended systems and time-delayed systems (TDSs), we present an experimental demonstration of time-crystal-like behavior in a stochastic, weakly modulated TDS. We consider a semiconductor laser near threshold with delayed feedback, whose output intensity shows abrupt spikes at irregular times. When the laser current is driven with a small-amplitude periodic signal we show that the interaction of delayed feedback and modulation can generate long-range regularity in the timing of the spikes, which lock to the modulation and, despite the presence of noise, remain in phase over thousands of modulation cycles. With pulsed modulation we find harmonic and subharmonic locking, while with sinusoidal modulation, we find only subharmonic locking, which is a characteristic feature of time-crystal behavior.
© 2022. The Author(s).
Conflict of interest statement
The authors declare no competing interests.
Figures


Similar articles
-
Dynamics of a semiconductor laser with feedback and modulation: experiments and model comparison.Opt Express. 2022 Mar 14;30(6):9441-9449. doi: 10.1364/OE.451983. Opt Express. 2022. PMID: 35299371
-
Subharmonic oscillations in stochastic systems under periodic driving.Phys Rev E. 2019 Jul;100(1-1):012135. doi: 10.1103/PhysRevE.100.012135. Phys Rev E. 2019. PMID: 31499923
-
Quantifying the degree of locking in weakly forced stochastic systems.Phys Rev E. 2019 Feb;99(2-1):022207. doi: 10.1103/PhysRevE.99.022207. Phys Rev E. 2019. PMID: 30934356
-
Experimental study of modulation waveforms for entraining the spikes emitted by a semiconductor laser with optical feedback.Opt Express. 2018 Apr 2;26(7):9298-9309. doi: 10.1364/OE.26.009298. Opt Express. 2018. PMID: 29715883
-
Exploring nonlinear dynamics in periodically driven time crystal from synchronization to chaotic motion.Nat Commun. 2025 Mar 26;16(1):2936. doi: 10.1038/s41467-025-58400-6. Nat Commun. 2025. PMID: 40133320 Free PMC article.
References
-
- Yao NY, Nayak C. Time crystals in periodically driven systems. Phys. Today. 2018;71(9):40.
-
- Sacha K, Zakrzewski J. Time crystals: A review. Rep. Prog. Phys. 2018;81:016401. - PubMed
-
- Wilczek F. Quantum time crystals. Phys. Rev. Lett. 2012;109:160401. - PubMed
-
- Bruno P. Impossibility of spontaneously rotating time crystals: A no-go theorem. Phys. Rev. Lett. 2013;111:070402. - PubMed
-
- Watanabe H, Oshikawa M. Absence of quantum time crystals. Phys. Rev. Lett. 2015;114:251603. - PubMed
Grants and funding
LinkOut - more resources
Full Text Sources

