. 2022 Mar 22;12(1):4899.
doi: 10.1038/s41598-022-08540-2.

Integrative interactomics applied to bovine fescue toxicosis

Affiliations

Integrative interactomics applied to bovine fescue toxicosis

Ryan S Mote et al. Sci Rep. .

Abstract

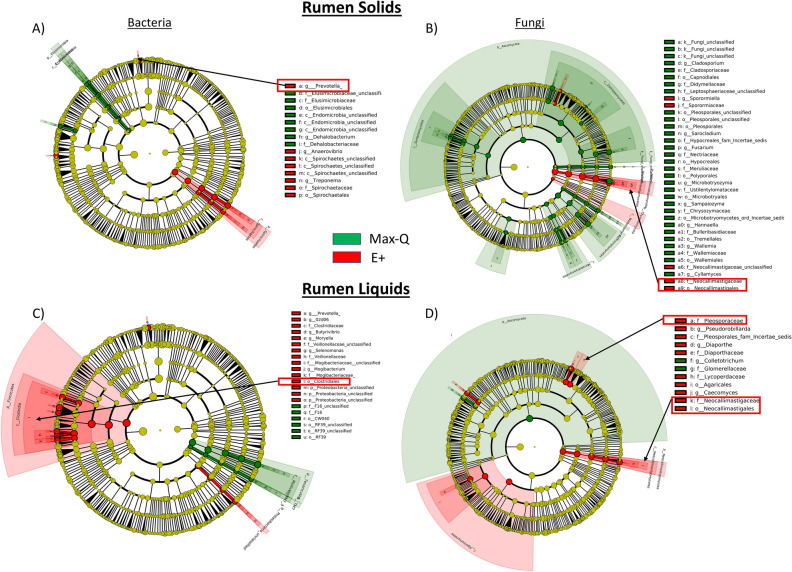
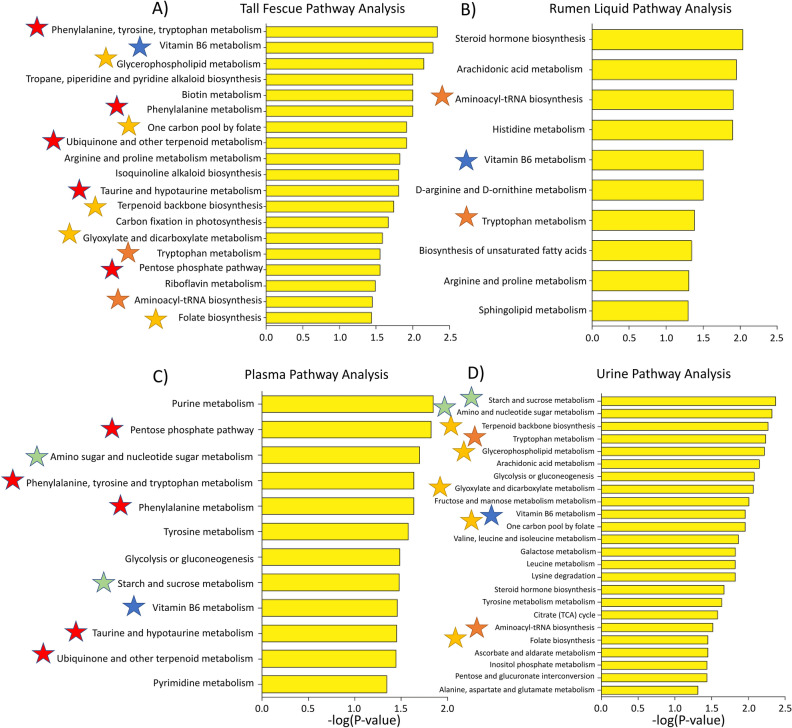
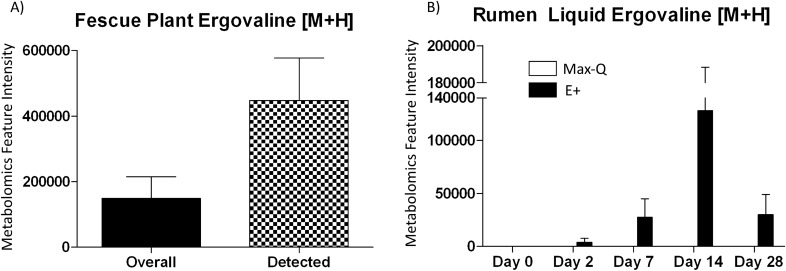
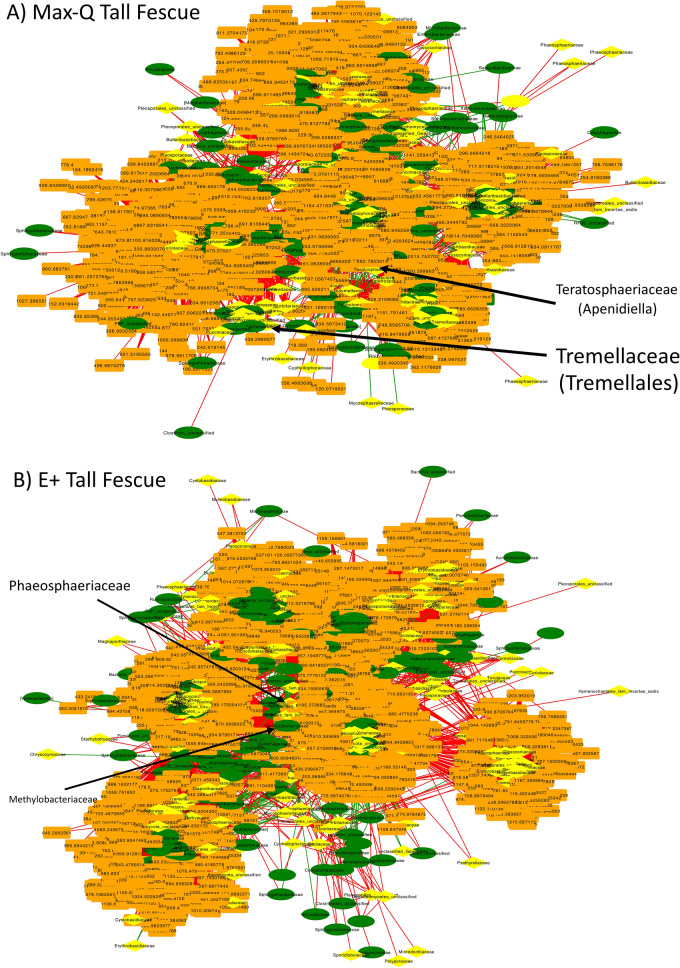
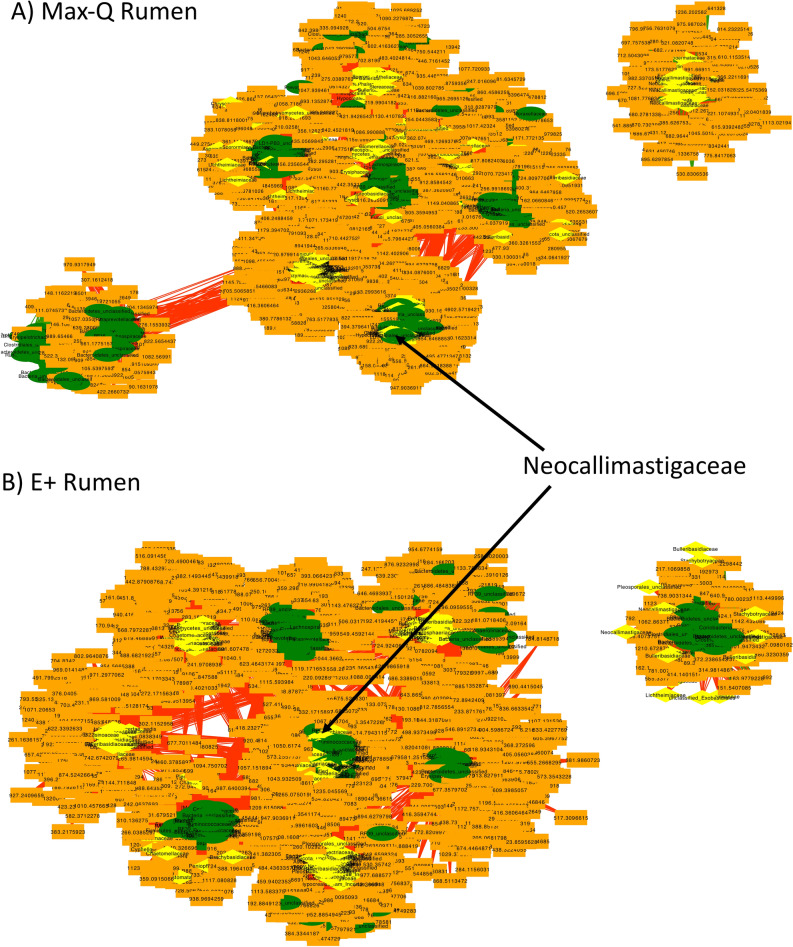
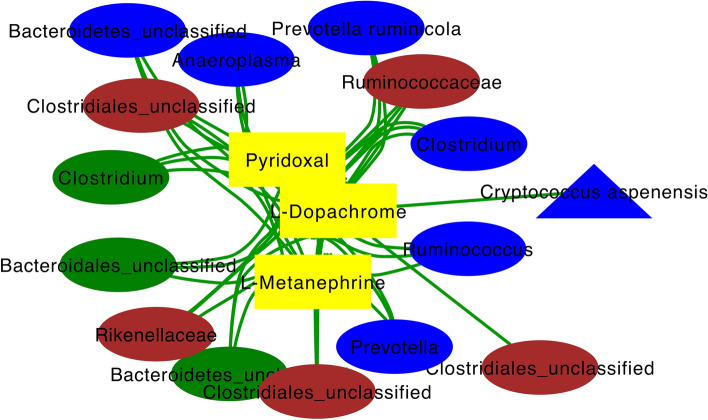
Bovine fescue toxicosis (FT) is caused by grazing ergot alkaloid-producing endophyte (Epichloë coenophiala)-infected tall fescue. Endophyte's effects on the animal's microbiota and metabolism were investigated recently, but its effects in planta or on the plant-animal interactions have not been considered. We examined multi-compartment microbiota-metabolome perturbations using multi-'omics (16S and ITS2 sequencing, plus untargeted metabolomics) in Angus steers grazing non-toxic (Max-Q) or toxic (E+) tall fescue for 28 days and in E+ plants. E+ altered the plant/animal microbiota, decreasing most ruminal fungi, with mixed effects on rumen bacteria and fecal microbiota. Metabolic perturbations occurred in all matrices, with some plant-animal overlap (e.g., Vitamin B6 metabolism). Integrative interactomics revealed unique E+ network constituents. Only E+ had ruminal solids OTUs within the network and fecal fungal OTUs in E+ had unique taxa (e.g., Anaeromyces). Three E+-unique urinary metabolites that could be potential biomarkers of FT and targeted therapeutically were identified.


Conflict of interest statement

The authors declare no competing interests.

Figures

Figure 1
Figure 1
Linear discriminant analysis (LDA) effect size (LEfSe; Kruskal–Wallis [P < 0.05]; Pairwise Wilcoxon [P < 0.05]; logarithmic LDA score > 2.0) of the rumen solid (A) bacterial and (B) fungal and rumen liquid (C) bacterial and (D) fungal microbiota of Angus steers across a 28-day grazing trial after placement on either a non-toxic (Max-Q; n = 6) or toxic (E+; n = 6) endophyte-infected tall fescue. Green and red shading indicates greater abundance in Max-Q or E+ steers, respectively. Taxonomic rank labels are provided before microbe names: “p_; c_; o_; f_; g_” indicate phylum, class, order, family, and genus, respectively. Letters and numbers within the cladograms refer to respective bacterial or fungal names located in the keys to the right of each cladogram. Select taxa of interest are highlighted by boxes and arrows point to their position within a cladogram.
Figure 2
Figure 2
Metabolic pathway analysis performed on the (A) tall fescue plant, (B) rumen, (C) plasma and (D) urine high-resolution metabolomics features using mummichog. Putative metabolic pathways significantly (P < 0.05) affected by toxic tall fescue (E+) in the plant and animal throughout the 28-day grazing trial are presented. The negative log of the FDR- corrected P value for each metabolic pathway indicated on the y-axis is on the x-axis. Blue star signifies overlapping pathways between all biological matrices; orange is fescue grass, rumen liquid, and urine overlap; red is fescue grass and plasma overlap; yellow is fescue grass and urine overlap.
Figure 3
Figure 3
Average putative ergovaline [M + H] feature intensity in (A) toxic (E+; n = 18) tall fescue plant for all samples (black) and only in samples where ergovaline was detected (checkered) and (B) the rumen liquids of Angus steers grazing either a non-toxic (Max-Q; n = 6) or toxic (E+; n = 6) tall fescue over the course of the 28-day grazing trial. Feature intensity data are presented as mean ± SEM.
Figure 4
Figure 4
Top, Middle: Venn diagrams representing specific bacterial (16S; A, B) and fungal (ITS2; C, D) OTUs that overlapped between biological matrices in steers grazing a novel, non-toxic (Max-Q; n = 6; left) or a toxic (E+; n = 6; right) tall fescue over the course of a 28 day grazing trial. Only OTUs with sequence counts (nseq > 10) were included in the analysis. Red arrows indicate specific microbes of interest with overlapping OTUs. Bottom: Venn diagrams representing specific metabolic features with exact mass-to-charge ratios (m/z’s) that overlapped between biological matrices in steers grazing (E) a non-toxic (Max-Q; n = 6) or (G) a toxic (E+; n = 6) tall fescue over the course of a 28 day grazing trial. (F) Represents shared or distinct features between Max-Q and E+ that overlapped between all four biological matrices in each respective cultivar. Only metabolic features present in > 80% of samples within a treatment and matrix were included in the analysis.
Figure 5
Figure 5
Targeted correlation-based network analysis of significantly correlated features with (A, B) fescue plant Epichloë (coenophiala) OTU, (C, D) rumen liquid E.(coenophiala) OTU, and (E, F) ergovaline. (A) Network of toxic tall fescue plant (E+; P < 0.05) bacterial and fungal OTUs (B) respective centrality measurements with E. (coenophiala) marked in red; (C) network of toxic tall fescue grazing steers (E+; P < 0.05) ruminal bacterial and fungal OTUs with (D) respective centrality measurements with Epichloë marked in red; (E) focused network of toxic tall fescue grazing steers (E+; |r| > 0.6; P < 0.05) ruminal metabolic features significantly correlated with ruminal ergovaline and (F) respective centrality measurements with (ergovaline) marked in red. Blue and red nodes in (A, B, C, D) represent fungal and bacterial nodes, respectively. Yellow, green, blue, and white nodes in (E, F) indicate, respectively, ergovaline, metabolites involved in primary bile acid biosynthesis, metabolites involved in steroid hormone biosynthesis, and metabolites from unannotated pathways. E. (coenophiala) presence in the network is highlighted by arrows. Green and red lines indicate positive and negative correlations, respectively.
Figure 6
Figure 6
Global fescue plant integrative interactomics networks of relationships between bacterial (green, oval) and fungal (yellow, diamond) OTUs and metabolites (orange, rectangle) in the tall fescue plant within non-toxic (A; Max-Q; n = 6) or toxic (B; E+; n = 6) endophyte-infected plants. Green and red edges indicate positive and negative correlations, respectively. Select nodes of interest are highlighted by arrows and text.
Figure 7
Figure 7
Global rumen integrative interactomics networks demonstrating relationships between bacterial (green, oval) and fungal (yellow, diamond) OTUs and metabolites (orange, rectangle) of non-toxic (A; Max-Q; n = 6) or toxic (B; E+; n = 6) grazing beef steers. Green and red edges indicate positive and negative correlations, respectively. Select nodes of interest are highlighted by arrows and text.
Figure 8
Figure 8
Global whole animal integrative interactomics networks of the relationships between bacterial (oval) and fungal (diamond) OTUs and metabolites (rectangle) in the rumen solid (green), rumen liquid (blue), plasma (orange), urine (yellow), and feces (brown) of either (A) non-toxic (Max-Q; n = 6) or (B) toxic (E+; n = 6) endophyte-infected tall fescue grazing beef steers. Green and red edges indicate positive and negative correlations, respectively.
Figure 9
Figure 9
Targeted whole animal integrative interactomics networks of the relationships between bacterial (oval) and fungal (triangle) OTUs and metabolites (rectangle) in the rumen solid (green), rumen liquid (blue), urine (yellow), and feces (brown) of steers on toxic (E+; n = 6) endophyte-infected tall fescue. Metabolic pathways targeted in this analysis include tryptophan, tyrosine, Vitamin B6, steroid hormone, and bile acid metabolism. Green edges indicate positive correlations.

References

    1. Paterson J, Forcherio C, Larson B, Samford M, Kerley M. The effects of fescue toxicosis on beef cattle productivity. J. Anim. Sci. 1995;73:889–898. doi: 10.2527/1995.733889x. - DOI - PubMed
    1. Leuchtmann A, Bacon CW, Schardl CL, White JF, Jr, Tadych M. Nomenclatural realignment of Neotyphodium species with genus Epichole. Mycologia. 2014;106:202–215. doi: 10.3852/13-251. - DOI - PubMed
    1. Clay K, Schardl C. Evolutionary origins and ecological consequences of endophyte symbiosis with grasses. Am. Nat. 2002;160(Suppl 4):S99–S127. doi: 10.1086/342161. - DOI - PubMed
    1. Thompson FN, Stuedemann JA. Pathophysiology of fescue toxicosis. Agr. Ecosyst. Environ. 1993;44:263–281. doi: 10.1016/0167-8809(93)90050-y. - DOI
    1. Foote AP, Harmon DL, Strickland JR, Bush LP, Klotz JL. Effect of ergot alkaloids on contractility of bovine right ruminal artery and vein. J. Anim. Sci. 2011;89:2944–2949. doi: 10.2527/jas.2010-3626. - DOI - PubMed

Publication types

Substances