. 2022 Mar 22;12(1):4834.
doi: 10.1038/s41598-022-08547-9.

Clr-f expression regulates kidney immune and metabolic homeostasis

Affiliations

Clr-f expression regulates kidney immune and metabolic homeostasis

Haggag S Zein et al. Sci Rep. .

Abstract

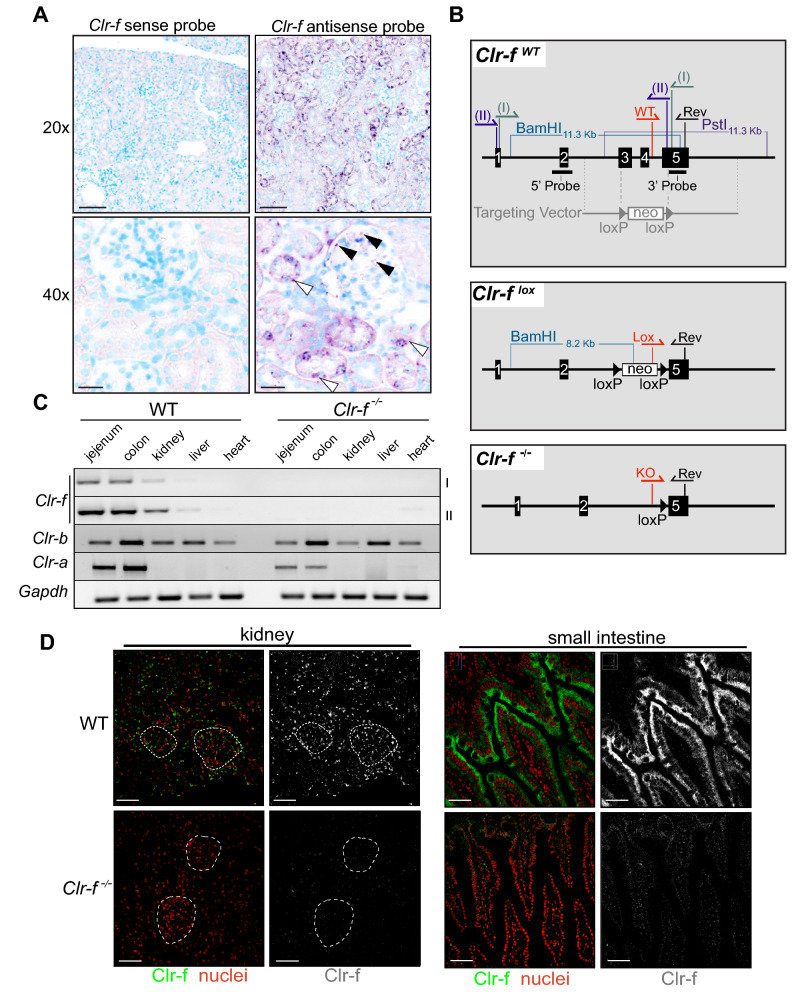
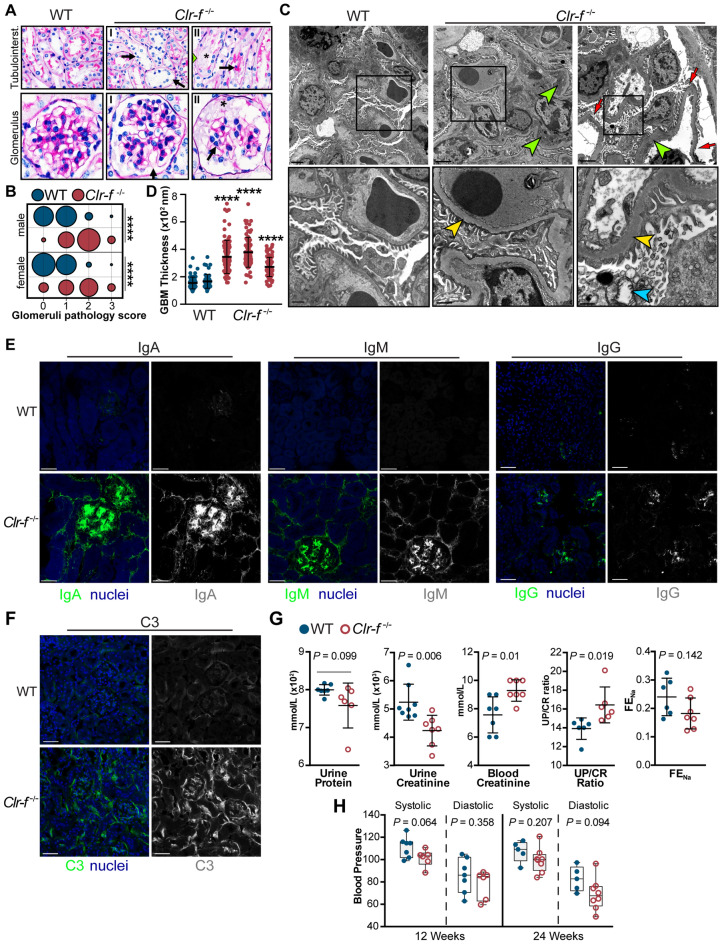
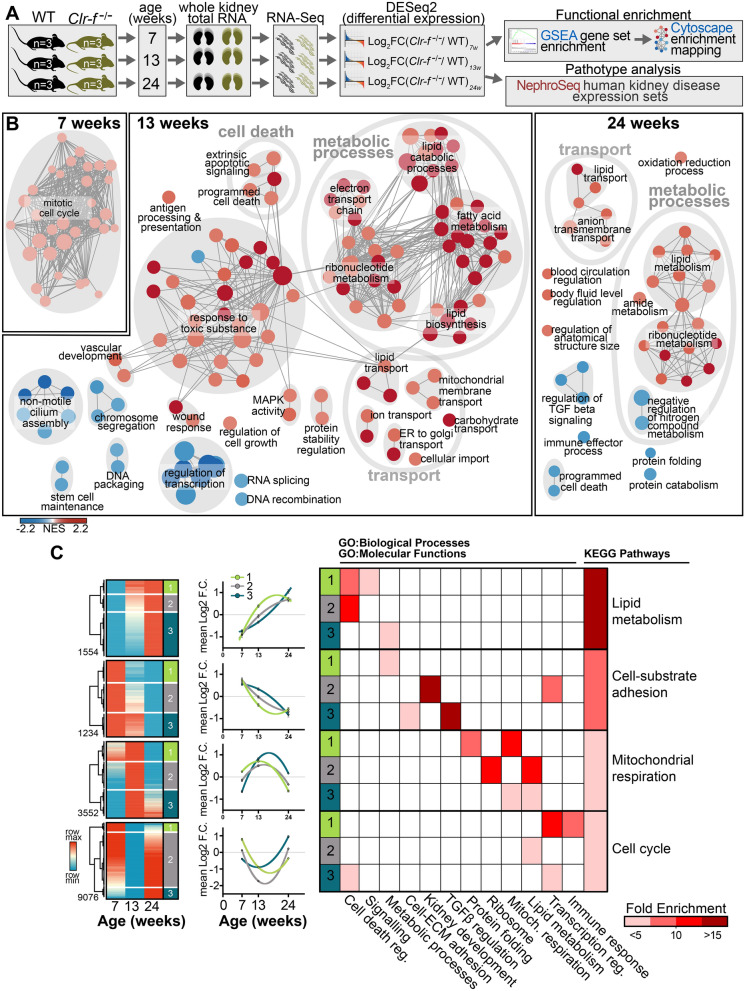
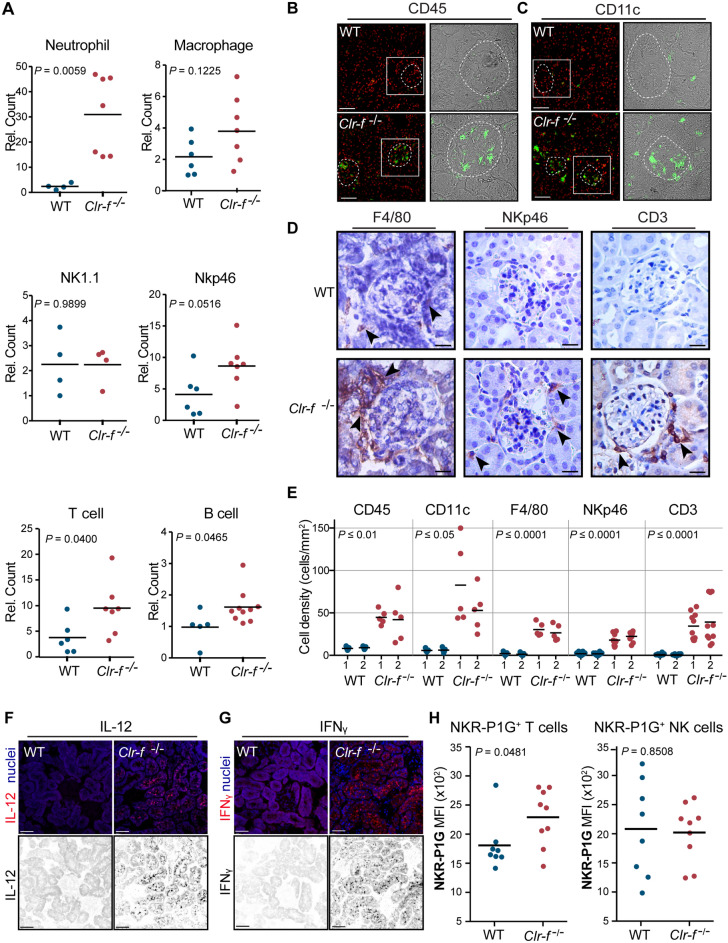
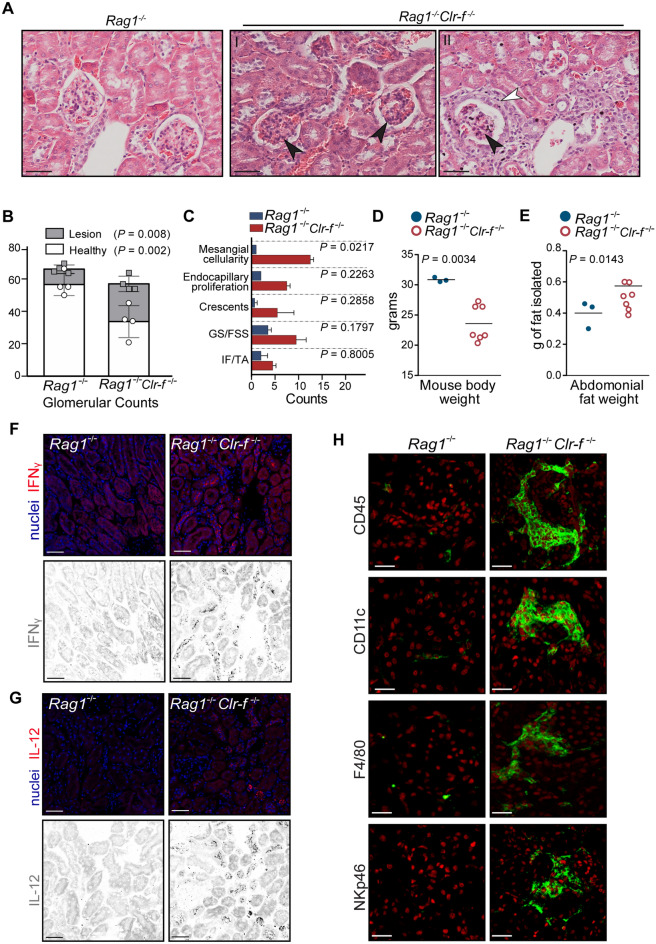
The C-type lectin-related protein, Clr-f, encoded by Clec2h in the mouse NK gene complex (NKC), is a member of a family of immune regulatory lectins that guide immune responses at distinct tissues of the body. Clr-f is highly expressed in the kidney; however, its activity in this organ is unknown. To assess the requirement for Clr-f in kidney health and function, we generated a Clr-f-deficient mouse (Clr-f-/-) by targeted deletions in the Clec2h gene. Mice lacking Clr-f exhibited glomerular and tubular lesions, immunoglobulin and C3 complement protein renal deposits, and significant abdominal and ectopic lipid accumulation. Whole kidney transcriptional profile analysis of Clr-f-/- mice at 7, 13, and 24 weeks of age revealed a dynamic dysregulation in lipid metabolic processes, stress responses, and inflammatory mediators. Examination of the immune contribution to the pathologies of Clr-f-/- mouse kidneys identified elevated IL-12 and IFNγ in cells of the tubulointerstitium, and an infiltrating population of neutrophils and T and B lymphocytes. The presence of these insults in a Rag1-/-Clr-f-/- background reveals that Clr-f-/- mice are susceptible to a T and B lymphocyte-independent renal pathogenesis. Our data reveal a role for Clr-f in the maintenance of kidney immune and metabolic homeostasis.


Conflict of interest statement

The authors declare no competing interests.

Figures

Figure 1
Figure 1
Generation of Clr-f−/− mice by targeted Clr-f gene deletion. (A) In situ hybridization of full-length Clr-f DIG-labelled sense and antisense probes to WT kidney tissues. DIG staining of proximal tubular cells (white arrowheads), and podocytes (black arrowhead) indicated. Scale bars represent 100 μm in upper panels and 25 μm in lower panels. (B) Schematic of genetic strategy to ablate the Clr-f gene exons 3, 4, and part of 5 with targeting vector by homologous recombination. Southern blot analysis 5′ and 3′ probe targets, and BamHI and PstI restriction enzyme digestion sites, used to confirm ES cell clone targeting, are shown. Locations of PCR primer annealing sites for genotype validations performed in Fig. S1 are shown in red and black. Locations of Clr-f RT-PCR primers (I) and (II) annealing sites in exons 1 and 5 are shown. (C) RT-PCR analysis of the indicated transcript expression in various organs. Heart tissue-derived cDNA was used as a negative control for Clr-f transcript expression. Two primer sets were used to amplify the Clr-f transcript: the binding sites for PCR primers (I) or (II) are shown in the Clr-f WT panel B. Cropped gel images of separate gels are shown. Full-length gel images are shown in Fig. S3A. (D) IF of the renal cortex and small intestine of WT and Clr-f−/− mice using the 10A6 antibody. Glomeruli are indicated in kidney IF panels, Clr-f staining is shown in green, nuclei are shown in red. Scale bars represent 40 μm.
Figure 2
Figure 2
Clr-f-deficient mice exhibit kidney pathology and altered kidney function. (A) Renal tissue sections from 12-week-old WT and Clr-f−/− mice (n = 4) stained with PAS. Upper panels show the appearance of lesions in proximal and distal tubules of Clr-f−/− mice with severity ranging from minimal epithelial disturbance (not shown), (I) flattened tubular epithelium with numerous cytoplasmic vacuoles (arrows), nuclear apical displacement, and (II) moderate and aggravated lesions with the disappearance of tubular epithelium. The green arrowhead in the far right panel (II) indicates an area of cell loss where the tubular basement membrane is covered by a thin layer of cytoplasm. Arrows indicate detached cells in tubular lumina and the asterisk marks an area of accumulated necrotic debris and loss of epithelial cell brush border. Lower panels show glomerular sections from 12-week-old WT and Clr-f−/− mice (n = 4) stained with PAS. Clr-f−/− mice exhibit a varying extent of glomerular mesangiolysis with (I) primary phase and (II) fragmentation and pronounced disruption of glomeruli. Arrows indicate capillary aneurysms (arrow). An asterisk indicates necrotizing cellular debris and plasma in Bowman’s spaces. (B) Pathology scoring of the observed glomerular lesions. Scores are based on the level of disappearance of the glomerulus: 0: < 10%, 1: 10–30%, 2: 30–60%, 3: > 60%. The bubble area represents the proportion of total counts (****P ≤ 0.0001). (C) Transmission electron micrographs demonstrate severe podocyte destruction and podocyte foot process effacement in Clr-f−/− mice (red arrows). The inset boxes in the upper panels are shown in the lower panels. Yellow arrowheads indicate GBM thickening, green arrowheads indicate subendothelial electron-dense deposits, blue arrowhead indicates mitochondrial cristolysis. Upper panel scale bars represent 2 μm. The lower left and middle panel scale bars represent 800 nm and lower right panel scale bar represents 500 nm. (D) Measurements of GBM thickness from electron microscopy micrographs of WT (n = 2) mice and Clr-f−/− (n = 3) mice. Each point represents a distinct GBM measurement. (****P ≤ 0.0001). (E) IF staining of WT and Clr-f−/− glomerular sections for IgA, IgM, IgG deposition, and (F) C3 complement protein in 12-week-old mouse kidneys. Scale bars represent 40 μm. (G) Protein and creatinine measurements in urine and serum samples and urinary fractional excretion of sodium (FENa) values from 12-week-old male Clr-f−/− and WT mice. (H) Blood pressure measurement in Clr-f−/− mice compared to their WT littermates at indicated ages. Mean and standard deviation are shown.
Figure 3
Figure 3
Gene expression profile of Clr-f−/− kidneys reveals progressive dysregulation in metabolism and stress response. (A) Schematic of RNA sequencing pipeline. (B) Interaction network of gene set enrichment analysis for biological processes differentially enriched in Clr-f−/− mice compared to WT at 7, 13, and 24 weeks. Blue nodes represent gene sets enriched with downregulated transcripts (Log2 FC < 0), and red nodes represent gene sets enriched with upregulated transcripts (Log2 FC > 0), according to the Normalized Enrichment Score (NES) color scale shown. Interaction map was constructed using Cytoscape V3.7.1 (C) Heatmaps represent Clr-f−/− DEGs that belong to four dynamic patterns of expression: DEGs that increase with age, decrease with age, and DEGs that transiently increase or decrease at 13 weeks of age. Three sub-clusters of genes identified within each dynamic expression pattern represent three distinct variations in expression dynamics within the four aforementioned groups. The mean Log2FC of DEG sub-clusters within each dynamic pattern is plotted against time with lines of best fit shown (using least-squares second-order polynomial). Gene ontology categorization of GO:Biological Processes/GO:Molecular Function for genes belonging to the three sub-clusters of each dynamic pattern is indicated by red squares, with color intensity according to fold enrichment. Pathways enriched from KEGG pathways are shown for all genes belonging to each of the four dynamic patterns of expression. Heat map was constructed using Morpheus (https://software.broadinstitute.org/morpheus).
Figure 4
Figure 4
Clr-f−/− mice accumulate abdominal, perirenal and tubulointerstitial fat. (A) Heatmap comparing FPKM values of genes with roles in lipid metabolism between 13-week-old WT and Clr-f−/− mice. Heat map was constructed using Morpheus (https://software.broadinstitute.org/morpheus). (B) Exposed abdominal cavity of 24-week-old WT and Clr-f−/− mice. Abdominal fat is indicated by the black arrowhead, and perirenal fat is indicated by a white arrowhead. (C) Total bodyweight of 24-week-old WT and Clr-f−/− mice. (D) Weight measurements of total abdominal fat dissected from 24-week-old WT and Clr-f−/− mice. Horizontal bars represent mean weight. (E) ORO lipid staining of kidney tissues from 24-week-old WT and Clr-f−/− mice. White and black arrowheads indicate tubulointerstitial and luminal ORO staining, respectively, and the green arrowhead indicates glomerular ORO staining. Images are at 20 × magnification.
Figure 5
Figure 5
Comparison between transcriptional profiles of Clr-f−/− mice and human CKDs. (A) Table of gene expression profile data sets of 15 human renal disorders vs. 13-week-old Clr-f−/− mice. The reference source for the human expression profile data set sources is indicated by the Study column. (B) Similarity matrix showing hierarchical clustering of differential gene expression profiles in panel (A). Red-dashed line within dendrogram indicates the level of matrix cluster separation. (C) Comparison of 4531 DEGs (Log2 FC; Padj. < 0.05) of 13-week-old Clr-f−/− mice (group 0) and IgAN patients. Gene set enrichment from 4 DEG clusters: (I) upregulated in both Clr-f−/− mice and IgAN patients, (II) upregulated in Clr-f−/− mice and downregulated IgAN patients, (III) downregulated in Clr-f−/− mice, and upregulated IgAN patients, and (IV) downregulated in both Clr-f−/− mice and IgAN patients. Heat maps were constructed using Morpheus (https://software.broadinstitute.org/morpheus).
Figure 6
Figure 6
Presence of renal immune cells in kidney tissue in Clr-f−/− mice. (A) Flow cytometry analysis of neutrophil, macrophage, NK1.1+ cell, NKp46+ cell, T cell, and B cell numbers per the whole kidney of Clr-f−/− mice relative to WT mice at 12 weeks of age. Horizontal bars represent mean cell numbers. (B) IF staining of WT and Clr-f−/− mouse kidneys with anti-CD45 antibody or (C) anti-CD11c antibody and DAPI nuclear staining (in red). Glomeruli are indicated by white-dashed lines. Brightfield panels of select glomeruli are shown with CD45+ or CD11c+ cells shown (in green). Scale bars represent 40 μm. (D) IHC staining of WT and Clr-f−/− mouse kidneys with antibodies against F4/80, NKp46, and CD3. Black arrowheads indicate select IHC positive cells. Images are captured at 20 × magnification. Scale bars represent 40 μm. (E) Visual quantification of indicated immune cell type per field from kidney sections of two WT and two Clr-f−/− mice. Each dot represents an individual field count and horizontal bars represent mean cell numbers. (F) IF staining of kidney sections for IL-12 and (G) IFNγ cytokines in WT and Clr-f−/− mice. Scale bars represent 40 μm. (H) NKR-P1G mean-fluorescence intensity (MFI) on kidney TCRβ+ T cells and NK1.1+ NK cells measured by flow cytometry analysis. Horizontal bars represent mean cell numbers and error bars represent standard deviation.
Figure 7
Figure 7
Presence of T and B cell-independent kidney pathology in Clr-f−/− mice. (A) Light microscopy images of H & E-stained kidney section from Rag1−/− and Rag1−/−Clr-f−/− mice. Rag1−/−Clr-f−/− kidneys shown in (I and II) exhibit glomerular hypercellularity (black arrowheads) and Rag1−/−Clr-f−/− kidney shown in (II) exhibit fibrosis (white arrowheads). Scale bars represent 50 μm. (B) Scoring of glomerular lesions in Rag1−/− and Rag1−/−Clr-f−/− H&E-stained kidney sections. Each point represents glomeruli number per kidney that exhibited no overt pathology (circles) or exhibited pathological lesions (squares). Stacked columns indicated score means and error bars represent standard deviation. (C) Scoring of mesangial cellularity, endocapillary proliferation, crescents, glomerulosclerosis, or global or focal segmental sclerosis (GS/FSS), and interstitial fibrosis and tubular atrophy (IF/TA). Counts represent the average number of lesions per kidney section (n = 2 mice). Error bars represent standard deviations. (D) Measurement of total body weight for indicated mouse genotypes. (E) Measurement of total abdominal fat weight dissected from mice of the indicated mouse genotypes. Horizontal bars represent the mean weight. (F) IF staining of kidney sections for IFNγ (G) and IL-12 cytokines in Rag1−/− and Rag1−/−Clr-f−/− mice. Scale bars represent 40 μm. (H) IF staining of Rag1−/− and Rag1−/−Clr-f−/− mice with antibodies against CD45, CD11c, NKp46, or F4/80 (green) and nuclear staining with DAPI (in red). Scale bars represent 10 μm.

References

    1. Hato T, Dagher PC. How the innate immune system senses trouble and causes trouble. Clin. J. Am. Soc. Nephrol. 2015;10:1459–1469. - PMC - PubMed
    1. Krüger T, et al. Identification and functional characterization of dendritic cells in the healthy murine kidney and in experimental glomerulonephritis. J. Am. Soc. Nephrol. 2004;15:613–621. - PubMed
    1. Weisheit CK, Engel DR, Kurts C. Dendritic cells and macrophages: Sentinels in the kidney. Clin. J. Am. Soc. Nephrol. 2015;10:1841–1851. - PMC - PubMed
    1. Woltman AM, et al. Quantification of dendritic cell subsets in human renal tissue under normal and pathological conditions. Kidney Int. 2007;71:1001–1008. - PubMed
    1. Gottschalk C, et al. Batf3-dependent dendritic cells in the renal lymph node induce tolerance against circulating antigens. J. Am. Soc. Nephrol. 2013;24:543–549. - PMC - PubMed

Publication types