. 2022 Mar 22;12(1):4884.
doi: 10.1038/s41598-022-08988-2.

Dimensions and forms of artefacts in 1.5 T and 3 T MRI caused by cochlear implants

Affiliations

Dimensions and forms of artefacts in 1.5 T and 3 T MRI caused by cochlear implants

Timo M Gottfried et al. Sci Rep. .

Abstract

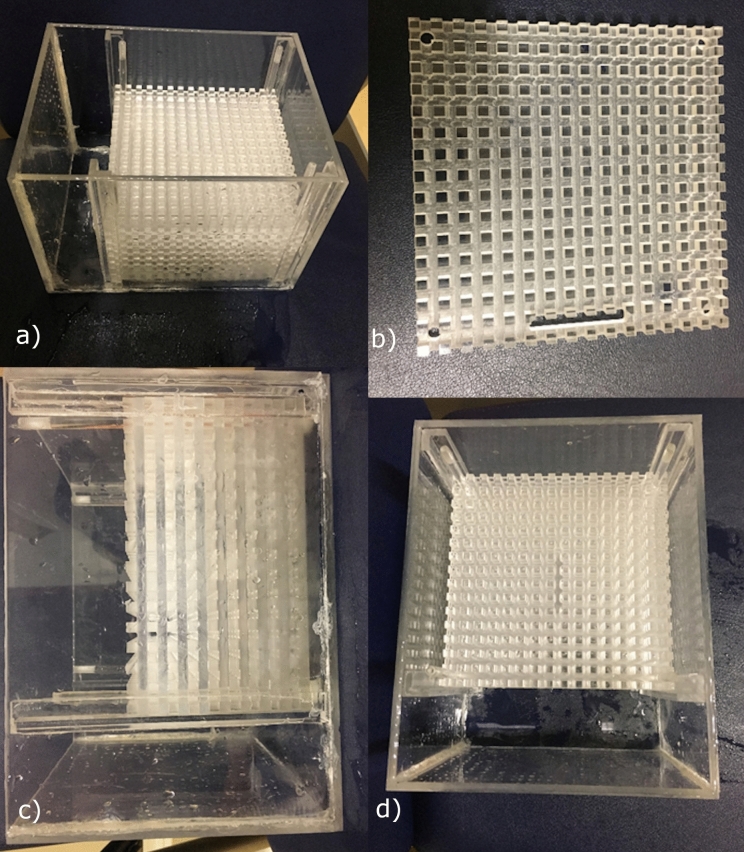
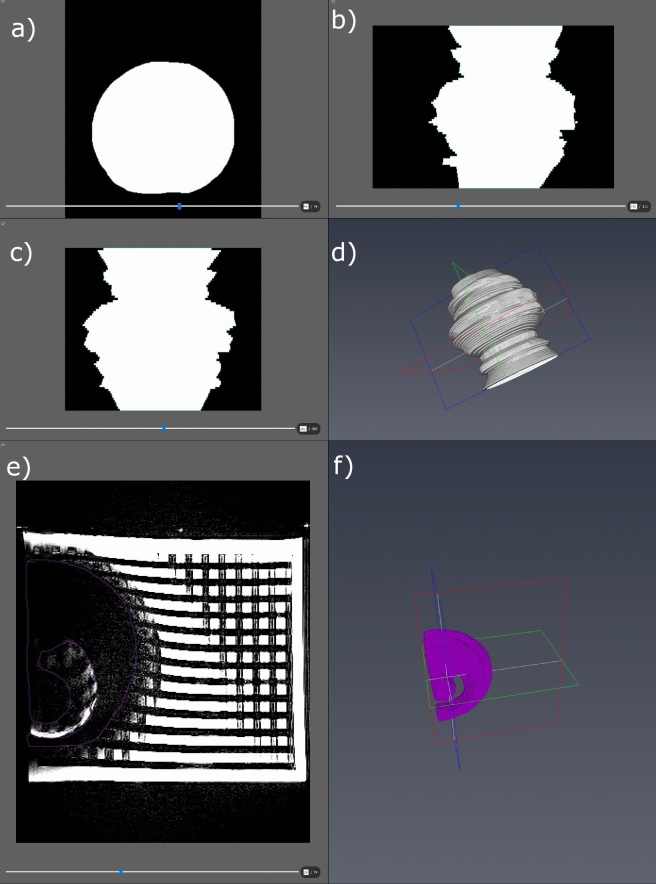
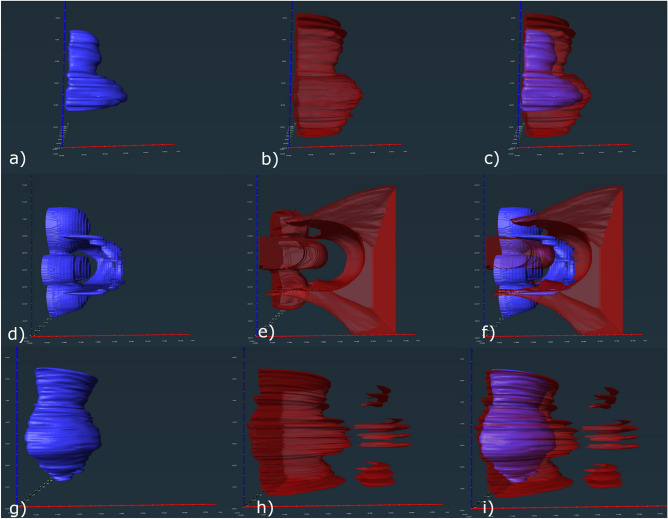
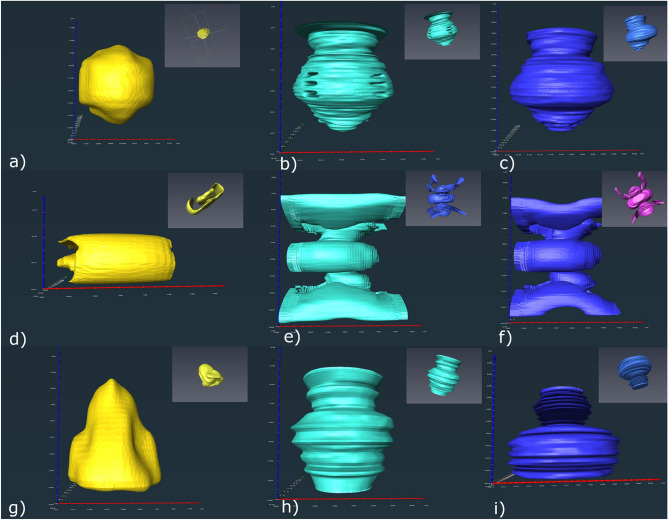
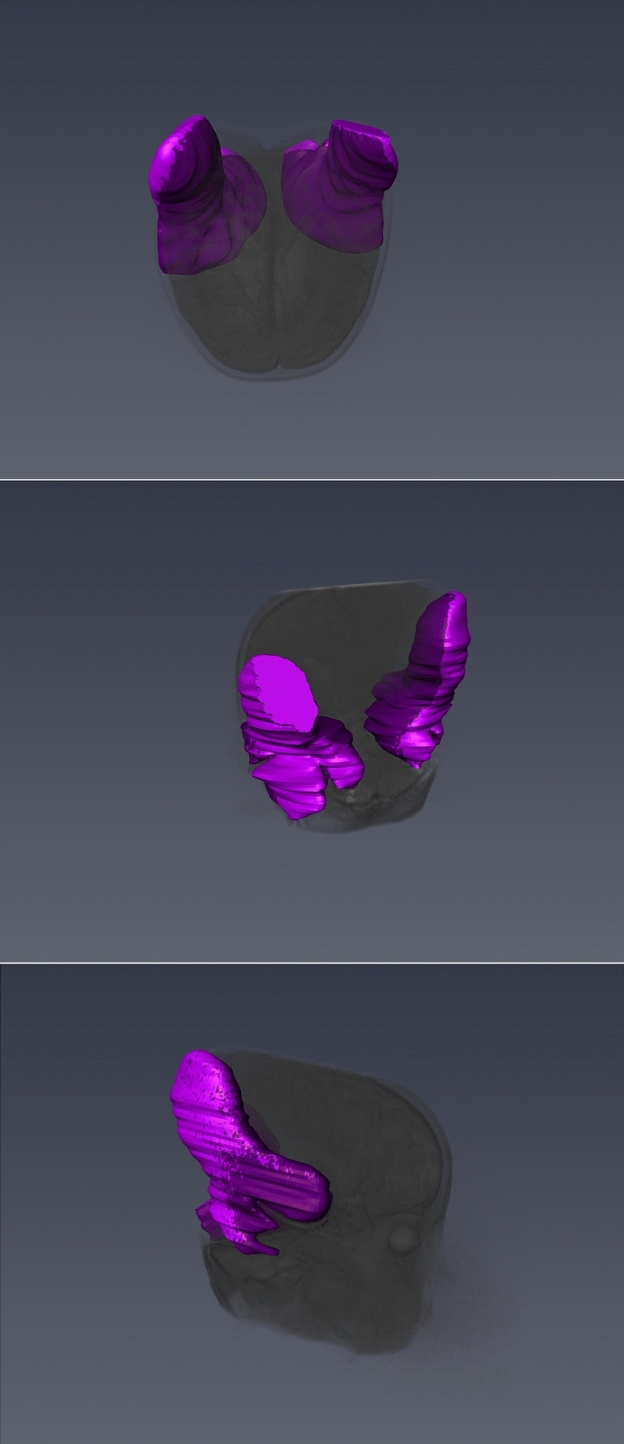
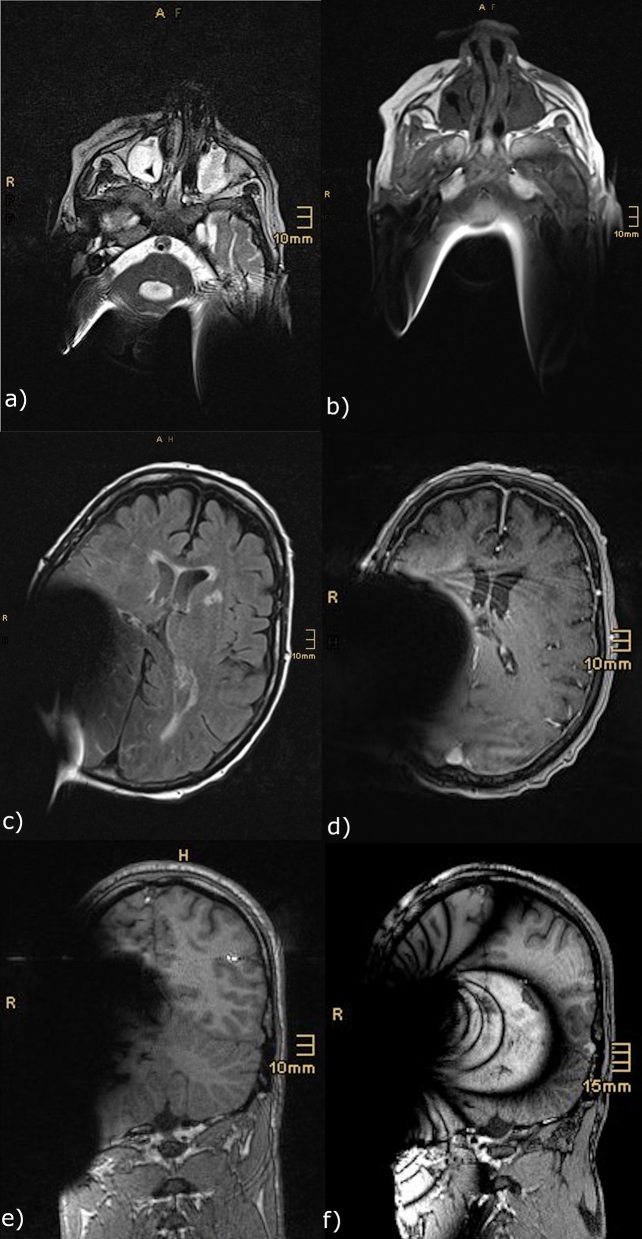
Cochlear implantation is a standard treatment option due to expanding indications. Cranial magnetic resonance imaging (cMRI) has become a widespread diagnostic tool. Therefore, an increased number of cochlear implant (CI) users are undergoing cMRI scans. This study aimed to investigate the issue of the CI magnet impacting MRI quality and artifacts. 1.5 T and 3 T MRI scans with 4 defined sequences (T2-TSE, T2-TIRM, T1-3D-MPRAGE, and TDI) were performed on a phantom with a CI (SYNCHRONY System by MED-EL Austria) in place. The resulting MRI artifacts were retrospectively compared to MRI artifacts observed in patients with a CI. All images were transferred to AMIRA and visualized by manual segmentation. Usable image quality was achieved in three sequences (T2-TSE, T2-TIRM and T1-mprage). Observed artifacts differed in shape and size depending on the sequence. Maximum diameters of signal void areas ranged from 58 × 108 × 98 mm to 127 × 123 × 153 mm. Image distortions were larger. MRI artifacts caused by the SYNCHRONY system are asymmetric with varying shape, depending on the sequence. The phantom artefacts are similar to those in CI users. Considering the observed asymmetry, the hypothesis of varying implantation locations resulting in varying positions of the signal void area needs to be further investigated.


Conflict of interest statement

The corresponding author received research funds from the the R&D Department of MED-EL Elektromedizinische Geräte GmbH Innsbruck.

Figures

Figure 1
Figure 1
(ad) The used model. In a plexiglass cube (a, c, d) multiple layers of 10-mm-thick Plexiglas plates (b) with 5 × 5 mm grids were stacked on top of each other.
Figure 2
Figure 2
The segmentation process using AMIRA software. Insert (ac) depicts the 2-dimensional view which has been marked by hand. In (d) the 3-dimensional composition gathered by (ac) is visualized. Picture (e) shows a T2-TSE sequence in the segmentation process. The signal void area has been marked by hand in pink. Insert (f) visualizes the resulting 3-D image.
Figure 3
Figure 3
The signal void and distorted areas caused by a MED-EL SYNCHRONY CI laterally placed on the phantom for each of the included sequences. Inserts (ac) show the results for T2-TSE. The signal void area is visualized in a, the distorted area in (b). Picture (c) shows the combination of (a) and (b). the pink and blue coloring shows results of two different segmentations, which appear to be identical. In picture (df) the T2-tirm sequence is presented with the signal void area in (d), the distorted area in (e) and the combination in (f). T1-mp_rage sequence is shown in (gi) with the signal void area in (g), the distorted area in (h) and the combination in (i).
Figure 4
Figure 4
The 3D shapes of artifacts caused by the individual components—casing, magnet and the assembled system. Insert (ac) visualize the T1-mp_rage sequence. The signal void area caused by the casing is seen in (a, b) visualizes the signal void area caused by the magnet and (c) the signal void area caused by the assembled system. In (df) the T2-tirm sequence is presented—(d) casing, (e) magnet and (f) assembled system. The pictures (gi) show the results for the T2-TSE sequence with (g) representing the casing, (h) the magnet and (i) the assembled system.
Figure 5
Figure 5
The position of the artifact in correlation to the human head. The example shows the typical T2-TSE sequence artifact in a 1.5 T setting of a bilaterally implanted patient. The orientation of the artifacts exhibits a mirror symmetry along a sagittal plane in the middle of the head.
Figure 6
Figure 6
Examples of the retrospective data used in this study. The pictures (a, c) present different layers of 1.5 T T2 TSE sequences done in a patient with a cochlear implant on (a) both sides and (c) the right side. Pictures (b) and (d) show a comparable layer of the same patient done in a T1-mp_rage sequence. Picture e) visualize exemplary an artefact caused by a CI on the right side in a 1.5 T MRI (T1-mp_rage), while picture (f) represents nearly the same layer of an image done in a 3 T device.

Similar articles

References

    1. Fallon JB, Irvine DRF, Shepherd RK. Cochlear implants and brain plasticity. Hear Res. 2008;238(1–2):110–117. doi: 10.1016/j.heares.2007.08.004. - DOI - PMC - PubMed
    1. US Department of Health & Human Services NIoDaoCD. Cochlear Implants. (2017).
    1. Todt I, Tittel A, Ernst A, Mittmann P, Mutze S. Pain free 3 T MRI scans in cochlear implantees. Otol. Neurotol. 2017;38(10):e401–e404. doi: 10.1097/mao.0000000000001569. - DOI - PubMed
    1. Stark T, Helbig S. Cochlear implantation: A changing indication. HNO. 2011;59(6):605–614. doi: 10.1007/s00106-011-2309-9. - DOI - PubMed
    1. Xiang X, Cao F. Time window and “tissue window”: Two approaches to assist decision-making in strokes. J. Neurol. 2019;266(2):283–288. doi: 10.1007/s00415-018-8933-5. - DOI - PubMed