. 2022 Mar 22;12(1):4923.
doi: 10.1038/s41598-022-09003-4.

Interneuron function and cognitive behavior are preserved upon postnatal removal of Lhx6

Affiliations

Interneuron function and cognitive behavior are preserved upon postnatal removal of Lhx6

Lars Voss et al. Sci Rep. .

Abstract

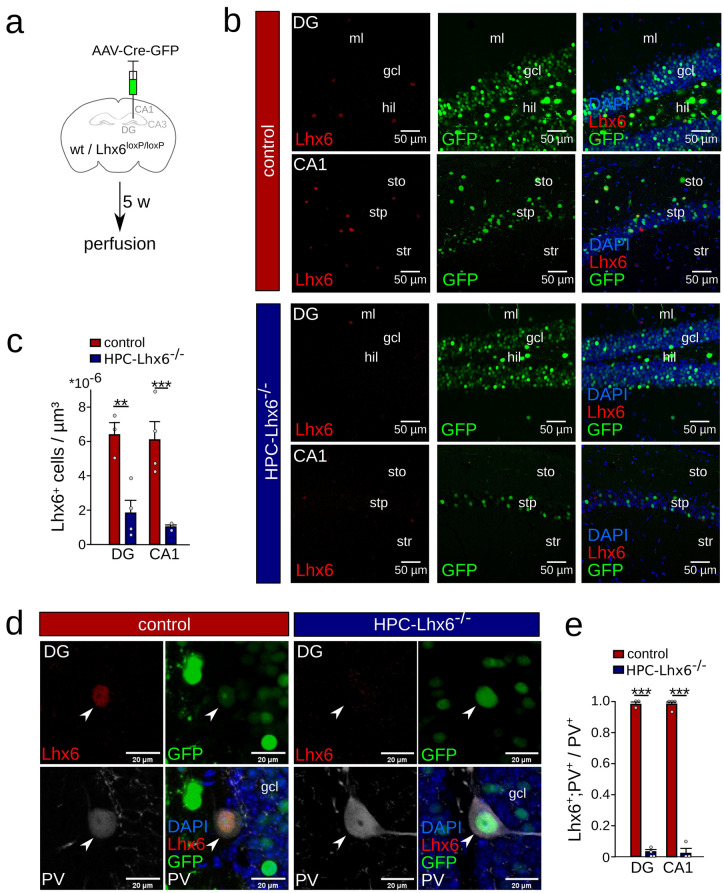
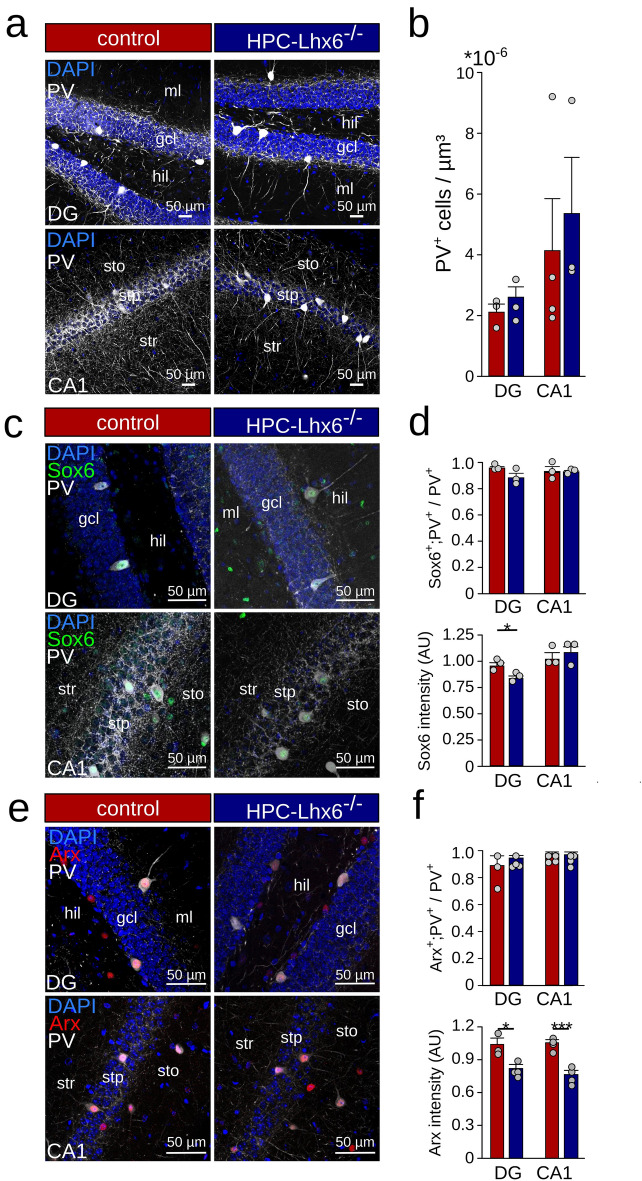
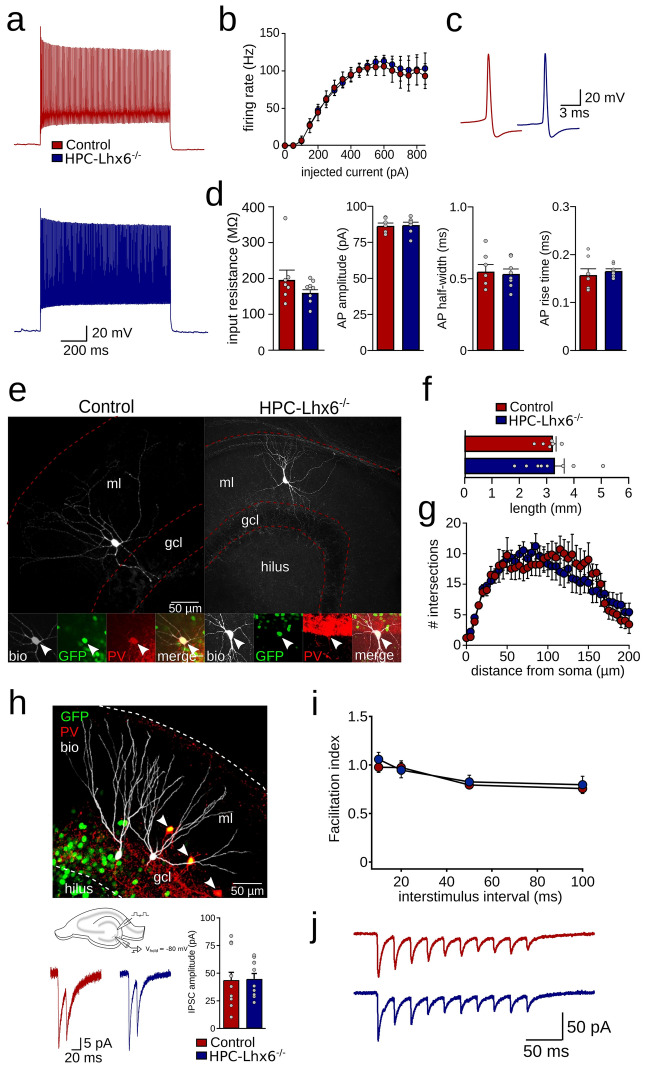
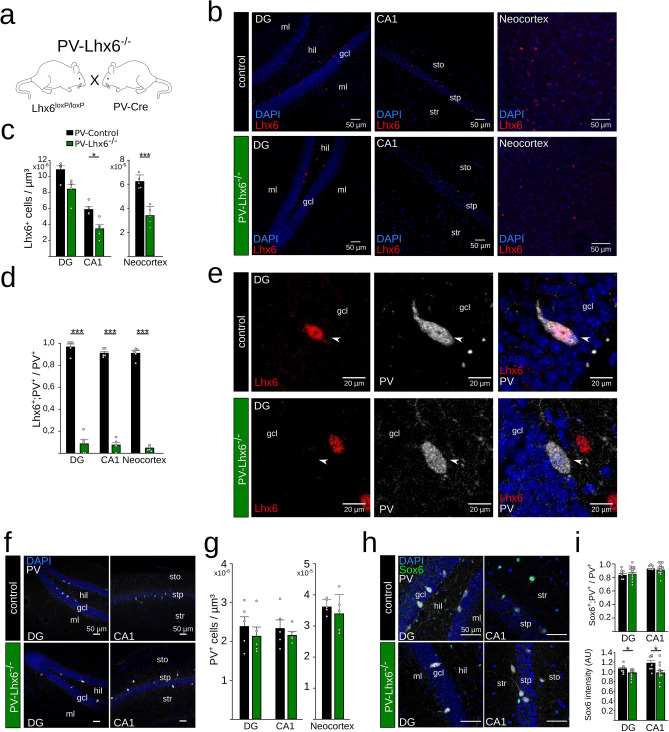
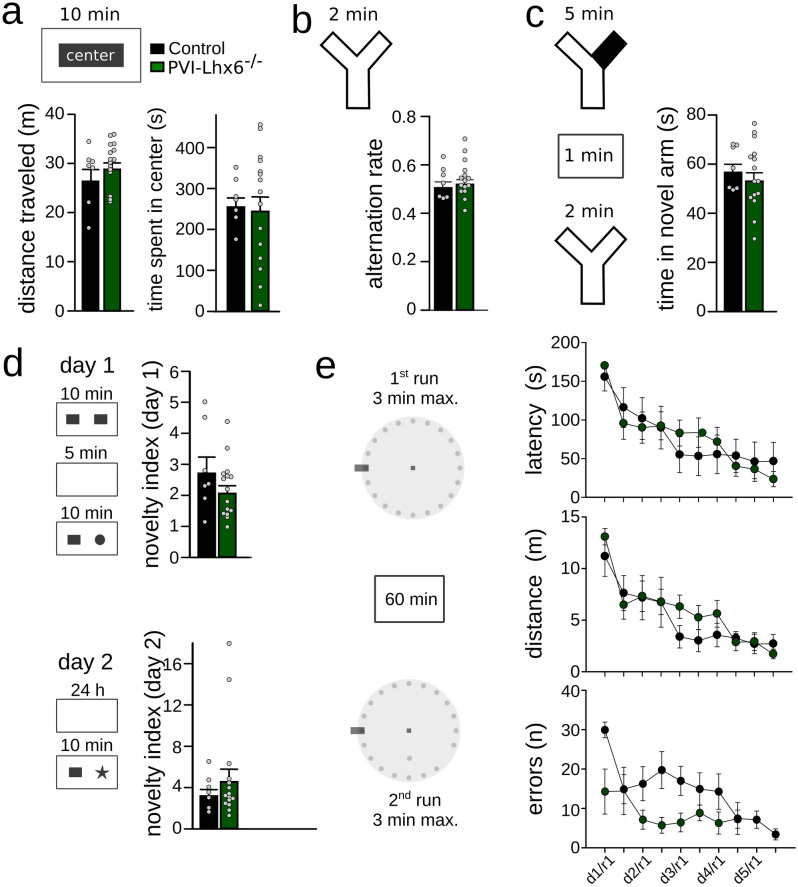
LIM homeobox domain transcription factor 6 (Lhx6) is crucial for the prenatal specification and differentiation of hippocampal GABAergic interneuron precursors. Interestingly, Lhx6 remains to be expressed in parvalbumin-positive hippocampal interneurons (PVIs) long after specification and differentiation have been completed, the functional implications of which remain elusive. We addressed the role of adult-expressed Lhx6 in the hippocampus by knocking down Lhx6 in adult mice (> 8 weeks old) using viral or transgenic expression of Cre-recombinase in Lhx6loxP/loxP mice. Late removal of Lhx6 did not affect the number of PVIs and had no impact on the morphological and physiological properties of PVIs. Furthermore, mice lacking Lhx6 in PVIs displayed normal cognitive behavior. Loss of Lhx6 only partially reduced the expression of Sox6 and Arx, downstream transcription factors that depend on Lhx6 during embryonic development of PVIs. Our data thus suggest that while Lhx6 is vitally important to drive interneuron transcriptional networks during early development, it becomes uncoupled from downstream effectors during postnatal life.


Conflict of interest statement

The authors declare no competing interests.

Figures

Figure 1
Figure 1
Removal of Lhx6 from adult PVIs. (a) Schematic of the experimental procedure used to remove Lhx6 from PVIs. Stereotaxic injections of adeno-associated viruses encoding Cre-recombinase were targeted to the hippocampus of mice carrying two alleles of the Lhx6 gene flanked by loxP-sites (HPC-Lhx6−/− mice) or wildtype control mice. (b) Confocal image stacks of the dentate gyrus (DG) and CA1 showing the expression of Lhx6 (red), Cre-GFP (green), and DAPI (blue) in control (top) and HPC-Lhx6−/− mice (bottom). Gcl: granule cell layer; hil: hilus; ml: molecular layer; stp: stratum pyramidale; sto: stratum oriens; str: stratum radiatum. (c) Quantification of the number of Lhx6-positive neurons revealed a significant reduction in HPC-Lhx6−/− compared to control mice. (d) Examples of the colocalisation of Lhx6 (red), Cre-GFP (green) and parvalbumin (PV, grey) in the DG. Lhx6 immunoreactivity is absent in the majority of PVIs in HPC-Lhx6−/− mice. (e) Quantification of the colocalisation of Lhx6 and PV in Cre-GFP-positive neurons. Data are mean ± sem. 3–4 mice were used per group. Data points show mouse averages. **p < 0.01, ***p < 0.001. Schematic in (a) was created with Inkscape 0.92 (www.inkscape.com).
Figure 2
Figure 2
Intact downstream transcription factor expression upon removal of Lhx6 from PVIs. (a) Confocal image stacks of PV-staining (white) and DAPI (blue) in the dentate gyrus (DG, top) and CA1 (bottom) were used to quantify the number of PVIs in the hippocampus. Gcl granule cell layer, hil hilus, ml molecular layer, sto stratum oriens, stp stratum pyramidale, str stratum radiatum. (b) Quantification of the PVI density in control (red) and HPC-Lhx6−/− (blue) mice revealed no significant difference between groups. (c) Confocal image stacks of PV (grey), Sox6 (green), and DAPI labelling (blue) in control and PV-Lhx6−/− mice. (d) Quantification of the colabelling of Sox6 and PV revealed no difference in the number of colabelled neurons (top) but reduced expression levels in the DG of PV-Lhx6−/− mice (bottom). (e) Same as (c) but with staining for the transcription factor Arx (red). (f) Quantification of the costaining of Arx and PV revealed no difference in the number of colabelled neurons (top) but reduced expression levels in PV-Lhx6−/− mice (bottom). Data are mean ± sem. Data points show mouse averages. *p < 0.05, ***p < 0.001.
Figure 3
Figure 3
Intact physiological and morphological properties of DG fast-spiking interneurons upon adult Lhx6-knockdown. (a) Firing response of a control (top, red) and HPC-Lhx6−/− fast-spiking interneuron (bottom, blue) in response to somatic current injection. Recordings were targeted to the DG. (b) Average firing rate as a function of injected current revealed that action potentials (APs) can be reliably evoked in fast-spiking interneurons of HPC-Lhx6−/− mice. (c) Individual AP waveforms of the cells shown in (a). (d) Unchanged input resistance measured by somatic voltage application, AP amplitude, AP half-width and AP rise time. (e) Confocal image stacks of fast-spiking interneurons filled with biocytin during whole-cell patch clamp recording. The insets show the coexpression of Cre-GFP (green) and PV (red) in both neurons (arrows). Gcl granule cell layer, ml molecular layer, Bio biocytin. (f) Quantification of dendritic length based on reconstructions of the dendritic arbour. (g) Sholl analysis applied to the dendrites of fast-spiking interneurons of control and HPC-Lhx6−/− mice. (h) Top, confocal image stack of DG granule cells filled with biocytin during whole-cell recording. PV is shown in red, Cre-GFP in green. Bottom, examples and summary of minimal stimulation in the gcl to evoke perisomatic inhibitory postsynaptic currents (IPSCs). There was no difference in IPSC amplitude. (i) Facilitation indices obtained from the amplitudes of IPSCs evoked at different interstimulus intervals were unaltered in HPC-Lhx6−/− granule cells. (j) Example of unaltered multiple-pulse behavior in response to trains of 10 pulses at 50 Hz. Data points show averages for individual cells. Data are mean ± sem. Schematic in (h) was created with Inkscape 0.92 (www.inkscape.com).
Figure 4
Figure 4
Removing Lhx6 during postnatal development. (a) Schematic of the experimental procedures used to remove Lhx6 from cortical PVIs: Mice expressing Cre-recombinase under the control of the PV-promotor were crossed with Lhx6loxP/loxP mice. These animals are referred to as PV-Lhx6−/− mice. (b) Confocal image stacks showing the expression of Lhx6 (red) and DAPI (blue) in DG (left), CA1 (middle) and neocortex (right). (c) Quantification of the number of Lhx6-positive cells. (d,e) Quantification and confocal examples of the colocalisation of Lhx6 and PV in control and PV-Lhx6−/− mice. The proportion of PVIs expressing Lhx6 was significantly reduced in DG, CA1 and neocortex. (f) Overview images used to quantify the expression of PV in PV-Lhx6−/− and control mice. (g) Unaltered number of PVIs in DG, CA1 and neocortex. (h) Costaining of Sox6 (green), PV (white) and DAPI (blue). (i) Unaltered number of Sox6-positive neurons (top) and mild reduction in Sox6 intensity (bottom). Data points show mouse averages. Data are mean ± sem. *p < 0.05, ***p < 0.001. Schematic in (a) was created with Inkscape 0.92 (www.inkscape.com).
Figure 5
Figure 5
Intact cognitive behavior upon postnatal removal of Lhx6. (a) Open field task. PV-Lhx6−/− mice displayed similar total distance travelled (left) and time spent in the center of the arena (right), indicating unaltered motor behavior and anxiety levels. (b) Spontaneous alternation task. There was no significant difference in the alternation rate of PV-Lhx6−/− mice. (c) Novel arm exploration task. Left: schematic of the procedure. Right: during the test phase, PV-Lhx6−/− mice spent equal times in the novel as control animals. (d) Novel object task. Left. Schematic of the procedure. Right: quantification of the novelty index for 5 min (top) and 24 h delay periods (bottom) indicated unchanged object recognition in PV-Lhx6−/− mice. (e) Barnes maze task. Left: schematic of the test. Right: quantification of latency to the escape tunnel (top), distance travelled (middle) and errors (bottom) revealed intact spatial learning in PV-Lhx6−/− mice. Data points show mouse averages. Data are mean ± sem. Schematics were created with Inkscape 0.92 (www.inkscape.com).

Similar articles

Cited by

References

    1. Murayama M, et al. Dendritic encoding of sensory stimuli controlled by deep cortical interneurons. Nature. 2009;457:1137–1141. doi: 10.1038/nature07663. - DOI - PubMed
    1. Sohal VS, Zhang F, Yizhar O, Deisseroth K. Parvalbumin neurons and gamma rhythms enhance cortical circuit performance. Nature. 2009;459:698–702. doi: 10.1038/nature07991. - DOI - PMC - PubMed
    1. Cardin JA, et al. Driving fast-spiking cells induces gamma rhythm and controls sensory responses. Nature. 2009;459:663–667. doi: 10.1038/nature08002. - DOI - PMC - PubMed
    1. Gelman D, et al. A wide diversity of cortical GABAergic interneurons derives from the embryonic preoptic area. J. Neurosci. 2011;31:16570–16580. doi: 10.1523/JNEUROSCI.4068-11.2011. - DOI - PMC - PubMed
    1. Pleasure SJ, et al. Cell migration from the ganglionic eminences is required for the development of hippocampal GABAergic interneurons. Neuron. 2000;28:727–740. doi: 10.1016/S0896-6273(00)00149-5. - DOI - PubMed

Publication types