. 2022 Mar 22;5(1):251.
doi: 10.1038/s42003-022-03210-5.

Pre-activation of autophagy impacts response to olaparib in prostate cancer cells

Affiliations

Pre-activation of autophagy impacts response to olaparib in prostate cancer cells

Maxime Cahuzac et al. Commun Biol. .

Abstract

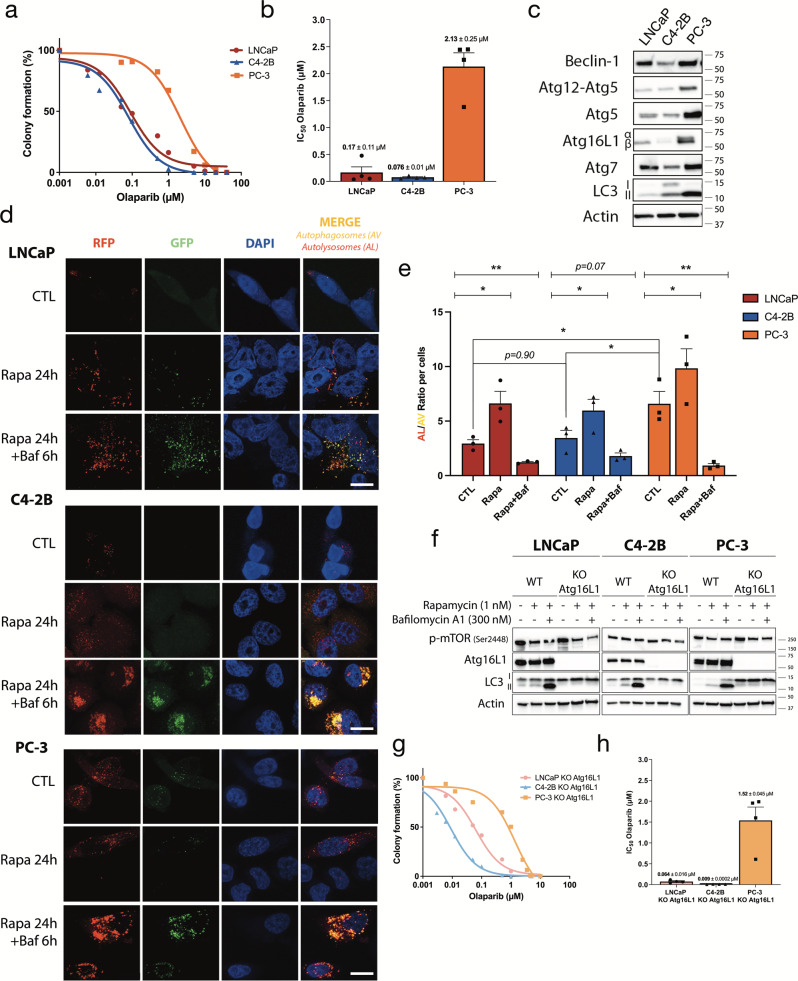
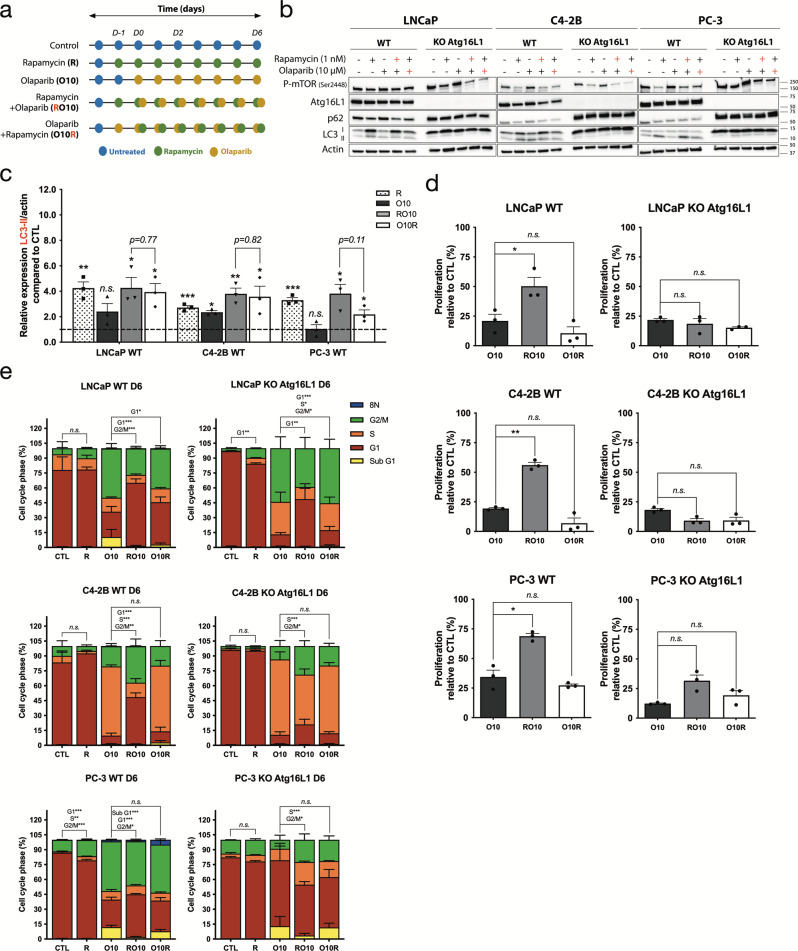
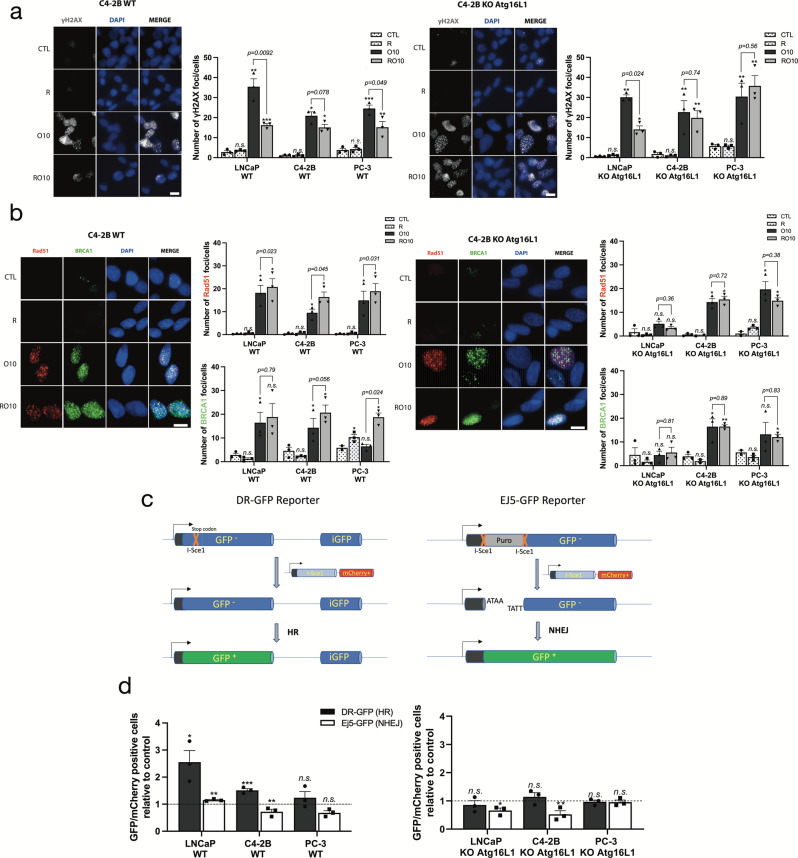
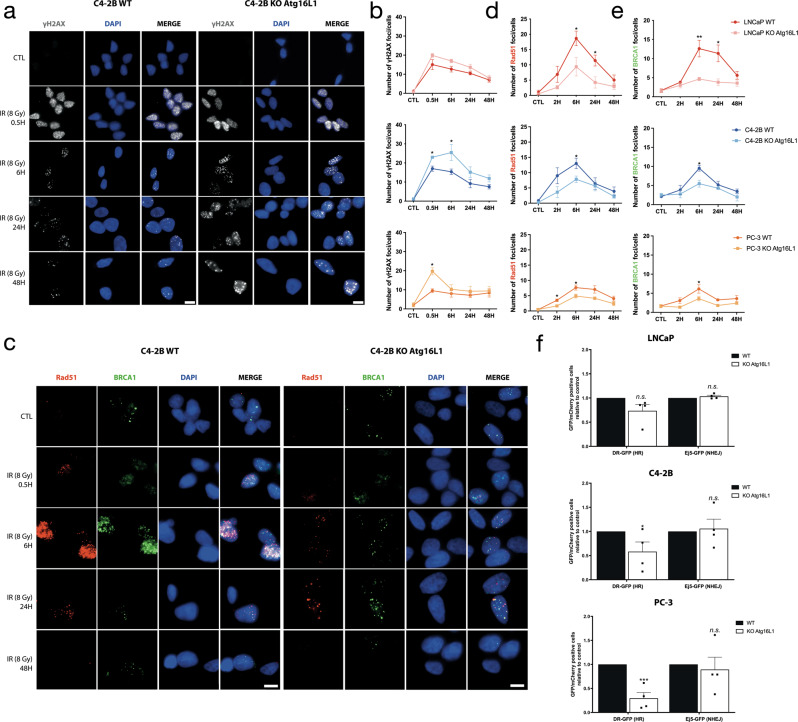
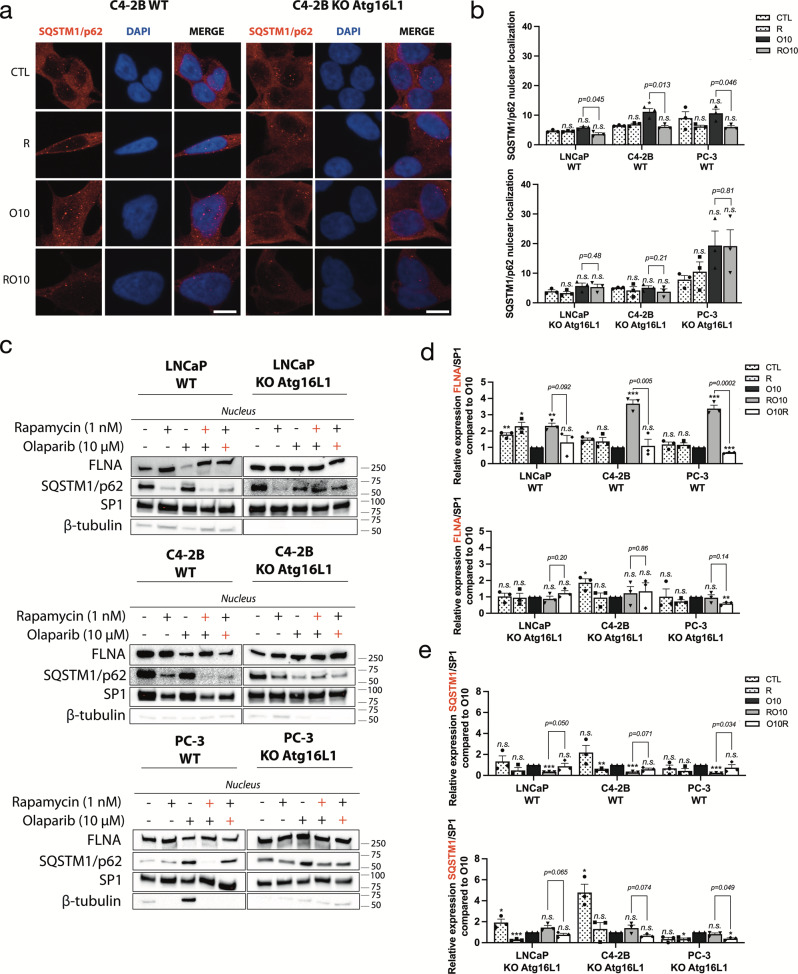
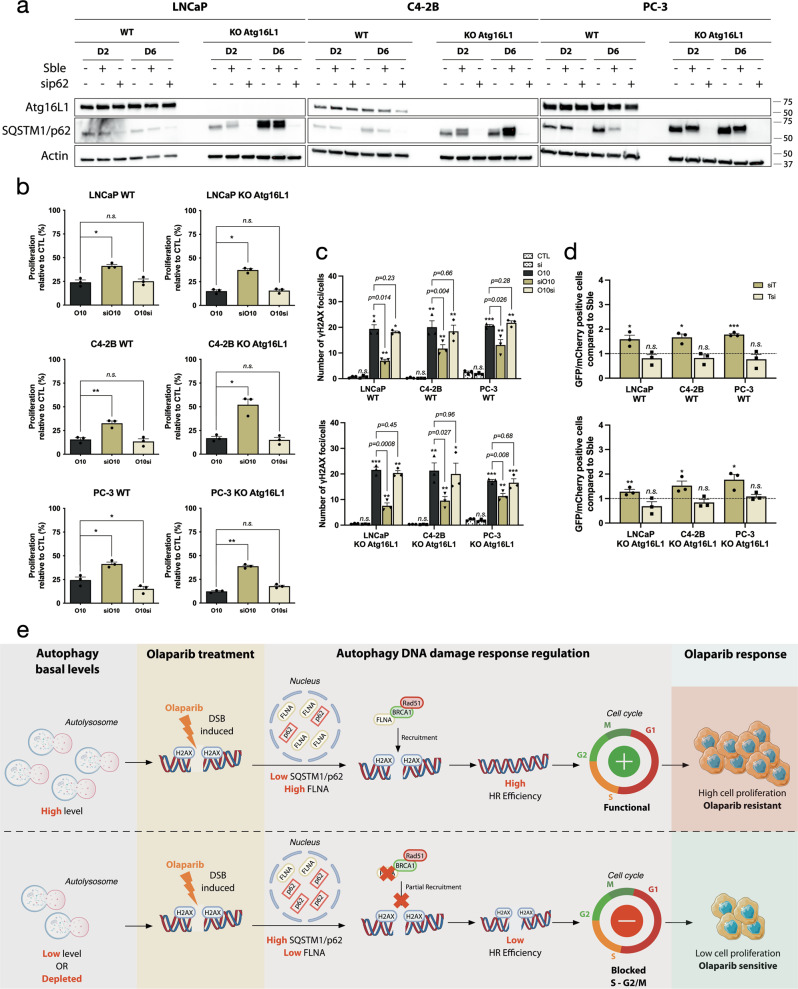
Poly (ADP-ribose) polymerase 1 (PARP1) plays an essential role in DNA repair and is targeted by anticancer therapies using PARP inhibitors (PARPi) such as olaparib. PARPi treatment in prostate cancer (PC) is currently used as a monotherapy or in combination with standard therapies (hormonotherapy) in clinical trials for patients with DNA damage response mutation. Unfortunately, 20% of these patients did not respond to this new treatment. This resistance mechanism in PC is still not well understood. Here, we report that autophagy affects differently the response of PC cell lines to olaparib depending on its activation status. Pre-activation of autophagy before olaparib resulted in an increase of DNA repair activity by homologous recombination (HR) to repair double-strand breaks induced by olaparib and enhanced cell proliferation. When autophagy was activated after olaparib treatment, or completely inhibited, PC cells demonstrated an increased sensitivity to this PARPi. This autophagy-mediated resistance is, in part, regulated by the nuclear localization of sequestrosome 1 (SQSTM1/p62). Decrease of SQSTM1/p62 nuclear localization due to autophagy pre-activation leads to an increase of filamin A (FLNA) protein expression and BRCA1/Rad51 recruitment involved in the HR pathway. Our results reveal that autophagy basal levels may in part determine amenability to PARPi treatment.


Conflict of interest statement

F.S. is an advisory board member (personal) and has received research funding (institutional) from AstraZeneca, Pfizer, Astellas, Bayer and Janssen.

Figures

Fig. 1
Fig. 1. Basal level of autophagy affects olaparib sensitivity profile of PC cell lines.
a Olaparib sensitivity curves in PC cell lines determined by clonogenic assay. b Olaparib IC50 of PC cell lines calculated from a. c Western blot analysis of basal level expression of key autophagy proteins in PC cell lines. d Representative images of autophagy flux with the tandem RFP-GFP LC3B sensor in cell lines, captured by confocal microscopy. Rapamycin (Rapa; 1 nM) was used as positive control and combined with 300 nM bafilomycin A1 (Baf) as a negative control. e Quantification of autophagy flux was achieved with a specific macro for Image J to calculate the ratio between autolysosomes (AL; red puncta) and autophagosomes (AV; yellow puncta) relative to control. f Confirmation of KO Atg16L1 in PC cell lines under control, autophagy-induced, and autophagy-blocked conditions by western blot analysis. g Olaparib sensitivity curves in KO Atg16L1 cell lines determined by clonogenic assay. h Olaparib IC50 of KO Atg16L1 cell lines calculated from g. Bars represent average ± SEM of IC50 values obtained by three independent clonogenic assays for b and h. The mean ± SEM of four (b and h) or three (e) independent experiments is shown. Data were analyzed using the two-tail Student t-test. *p < 0.05 and **p < 0.01. Scale bar 10 µm.
Fig. 2
Fig. 2. Pre-activation of autophagy by rapamycin induces a protective effect against olaparib.
a Treatment timeline of cell lines. Cells were treated with 10 µM olaparib alone (denoted as O10) or received 1 nM rapamycin 24 h before (RO10) or 24 h after (O10R) the start of olaparib treatment. Experiments were conducted for 6 days. b Western blot analyses of autophagy induction after olaparib and rapamycin treatments in WT and KO Atg16L1 cell lines at day 2. Rapamycin (red +) denotes RO10. Olaparib (red +) denotes O10R. c Relative expression of LC3-II normalized with actin and compared to control (CTL) from b. d Cell proliferation of WT and KO cell lines under O10, RO10, or O10R treatments at day 6. e Quantification of cell cycle phase populations determined by flow cytometry following 6 days of treatment of WT and KO cell lines. For all data, the mean ± SEM of three independent experiments is shown. Data were analyzed using the two-tail Student t-test. n.s. = nonsignificant. *p < 0.05, **p < 0.01, and ***p < 0.001.
Fig. 3
Fig. 3. Pre-activation of autophagy increases HR activity and reduces the accumulation of DNA damage induced by olaparib.
a Representative images (C4-2B WT and KO Atg16L1) and quantification of the number of γ-H2AX foci per nucleus in PC WT and KO cell lines following treatment with rapamycin alone (R), O10 or RO10 after 2 days. b Representative images (C4-2B WT and KO Atg16L1) and quantification of Rad51 and BRCA1 foci following same conditions as a. c Schematic representation of reporter assay system. d Quantification of HR (DR-GFP) and NHEJ (Ej5-GFP) activity when autophagy was activated by rapamycin 24 h before plasmids co-transfection (RT). The ratio of GFP-positive cells versus mCherry-positive cells was determined by flow cytometry. For all data, the mean ± SEM of three independent experiments is shown. Data were analyzed using the two-tail Student t-test. n.s. = nonsignificant. *p < 0.05, **p < 0.01, and ***p < 0.001. Scale bar 10 µm.
Fig. 4
Fig. 4. Autophagy-depleted PC cells repair DNA breaks using NHEJ.
a Representative images (C4-2B WT and KO Atg16L1) of the number of γ-H2AX foci per nucleus in WT and KO cells of C4-2B after 8 Gy irradiation. b Quantification of γ-H2AX foci per cells. c Representative images (C4-2B WT and KO Atg16L1) of the number of Rad51 and BRCA1 foci per nucleus in WT and KO cells of C4-2B after 8 Gy irradiation. d, e Quantification of Rad51 and BRCA1 foci per cell. f Analysis of HR (DR-GFP) and NHEJ (Ej5-GFP) activity in WT and KO cell lines by flow cytometry. The mean ± SEM of three (b) or four (d, e) independent experiments is shown. Data were analyzed using the two-tail Student t-test. n.s. = nonsignificant. *p < 0.05,**p < 0.01 and ***p < 0.001. Scale bar 10 µm.
Fig. 5
Fig. 5. SQSTM1/p62 nuclear localization regulates autophagy-mediated resistance to olaparib.
a Representative images (C4-2B WT and KO Atg16L1) of the number of SQSTM1/p62 puncta following rapamycin alone (R), O10 or RO10 treatments after 2 days. b Quantification of nuclear SQSTM1/p62 in WT and KO cell lines. c Western blot of nuclear fraction after 2 days of RO10 and O10R treatment in PC WT and KO Atg16L1 cell lines. Rapamycin (red +) denotes RO10. Olaparib (red +) denotes O10R. ß-tubulin was used as quality control as a marker of cytoplasmic fraction and SP1 as a marker of the nuclear fraction. d, e Relative expression of FLNA and SQSTM1 normalized with SP1 and compared to O10 condition. For all data, the mean ± SEM of three independent experiments is shown. Data were analyzed using the two-tail Student t-test. n.s. = nonsignificant. *p < 0.05, **p < 0.01, and ***p < 0.001. Scale bar 10 µm.
Fig. 6
Fig. 6. Targeting SQSTM1/p62 rescue autophagy-mediated resistance in PC KO Atg16L1 cell lines.
a Validation of efficacity of siRNA against SQSTM1/p62 at day 2 and 6. b Cell proliferation of PC WT and KO cell lines following transfection with siRNA against SQSTM1/p62 alone (si) or 24 h before olaparib treatment (siO10) or after (O10si) at day 6. c Quantification of the number of γ-H2AX foci per nucleus in PC WT and KO cell lines in same conditions as b. d Quantification of HR (DR-GFP) activity when SQSTM1/p62 was targeted with a siRNA 24 h before (siT) or after (Tsi) plasmids co-transfection. For all data, the mean ± SEM of three independent experiments is shown. Data were analyzed using the two-tail Student t-test. n.s. = nonsignificant. *p < 0.05, **p < 0.01, and ***p < 0.001. e This schematic proposes how autophagy activation may determine the PC cell response to olaparib. When a higher level of autophagy is present prior to olaparib treatment, nuclear levels of SQSTM1/p62 are low that prevents degradation of FLNA thereby promoting HR by recruiting Rad51 and BRCA1 to DNA breaks induced by olaparib. This allows PC cells to proliferate, leading to a resistance phenotype. If autophagy level is low prior to olaparib treatment, SQSTM1/p62 is not sufficiently cleared leading to higher levels of SQSTM1/p62 to target FLNA for degradation. This downregulation of FLNA reduces the efficiency of HR, leading to partial repair of DNA breaks and an olaparib-sensitive phenotype. Parts of this schematic proposes were drawn using pictures from Servier Medical Art. Servier Medical Art by Servier is licensed under a Creative Commons Attribution 3.0 Unported License.

Similar articles

Cited by

References

    1. Brenner DR, et al. Projected estimates of cancer in Canada in 2020. CMAJ. 2020;192:E199–E205. - PMC - PubMed
    1. Siegel RL, Miller KD, Fuchs HE, Jemal A. Cancer Statistics, 2021. CA Cancer J. Clin. 2021;71:7–33. - PubMed
    1. Robinson D, et al. Integrative clinical genomics of advanced prostate cancer. Cell. 2015;161:1215–1228. - PMC - PubMed
    1. Mateo J, et al. DNA-repair defects and olaparib in metastatic prostate cancer. N. Engl. J. Med. 2015;373:1697–1708. - PMC - PubMed
    1. Warner, E. W., Yip, S. M., Chi, K. N. & Wyatt, A. W. DNA repair defects in prostate cancer: impact for screening, prognostication and treatment. BJU Int. 10.1111/bju.14576 (2018). - PubMed

Publication types