. 2022 Jun;27(6):2901-2913.
doi: 10.1038/s41380-022-01513-x. Epub 2022 Mar 22.

Cav3.1-driven bursting firing in ventromedial hypothalamic neurons exerts dual control of anxiety-like behavior and energy expenditure

Affiliations

Cav3.1-driven bursting firing in ventromedial hypothalamic neurons exerts dual control of anxiety-like behavior and energy expenditure

Jie Shao et al. Mol Psychiatry. 2022 Jun.

Abstract

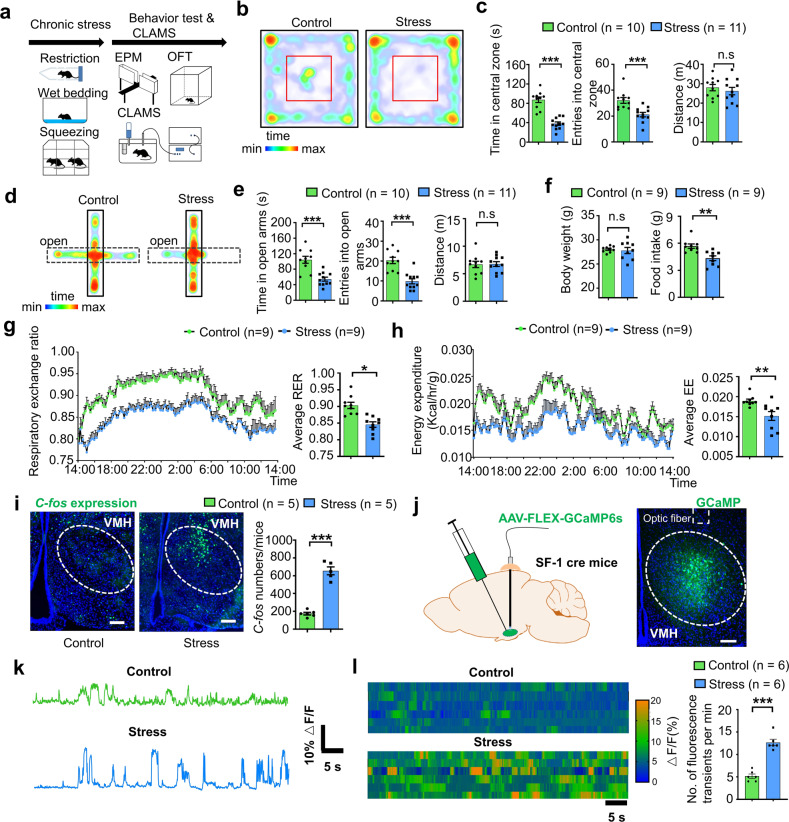
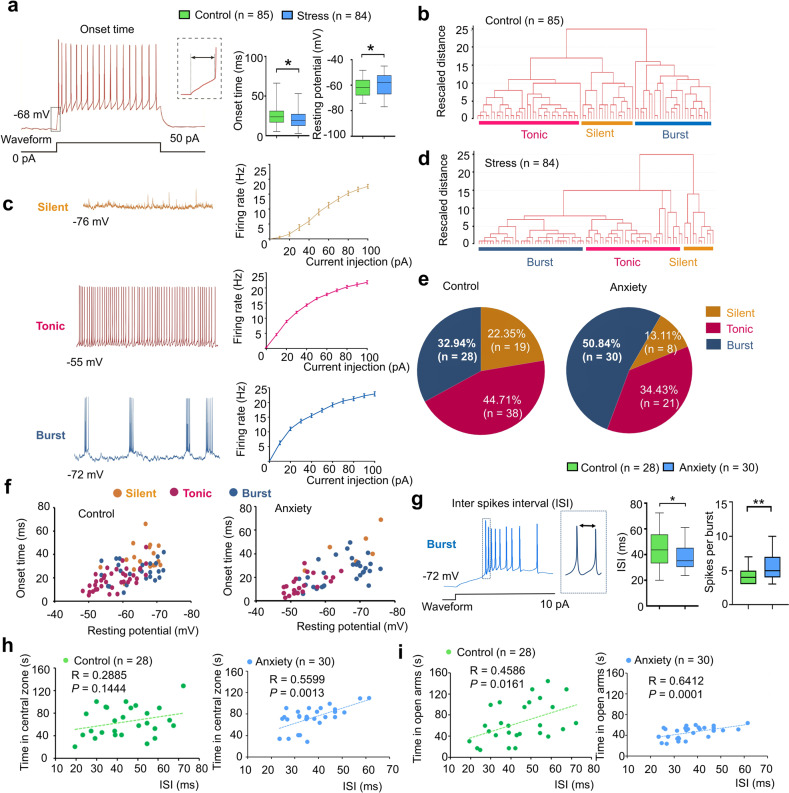
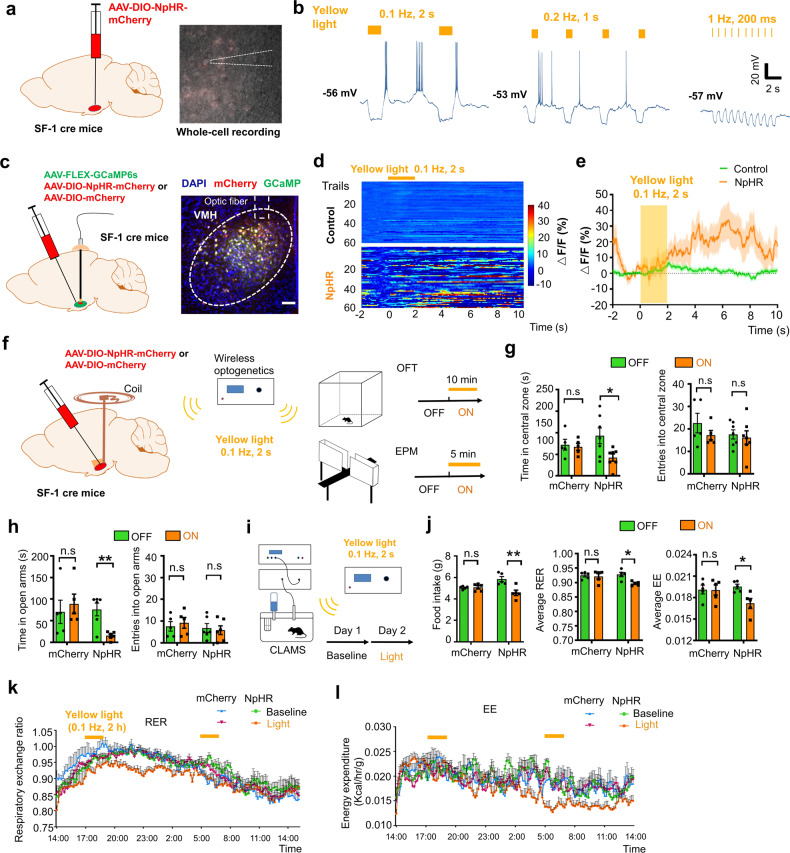
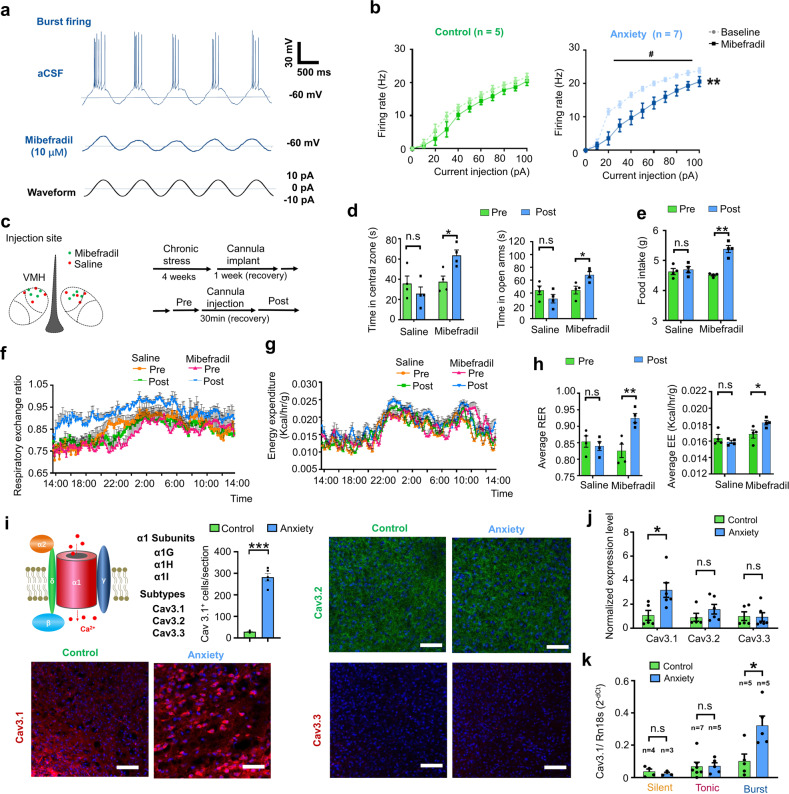
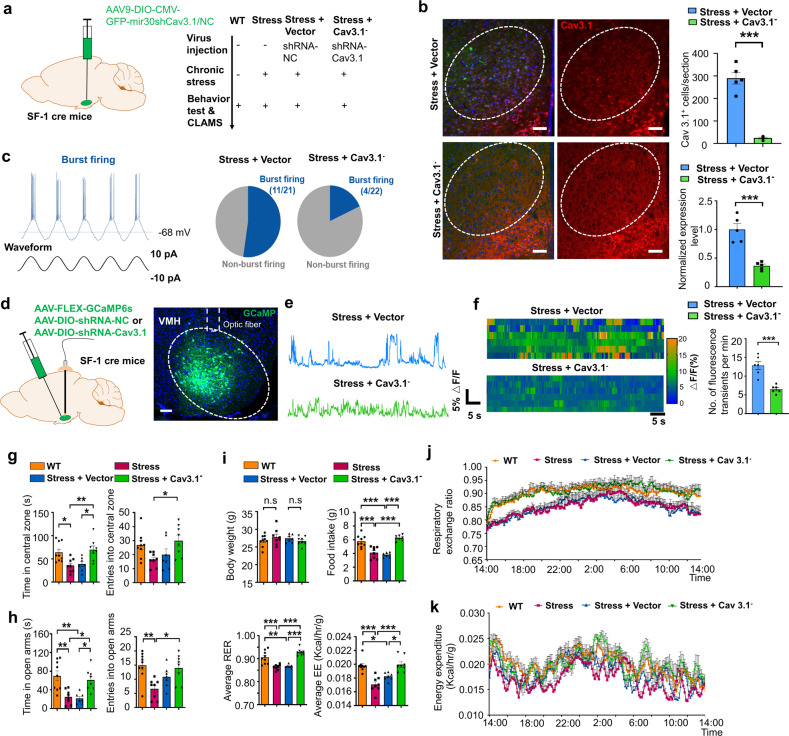
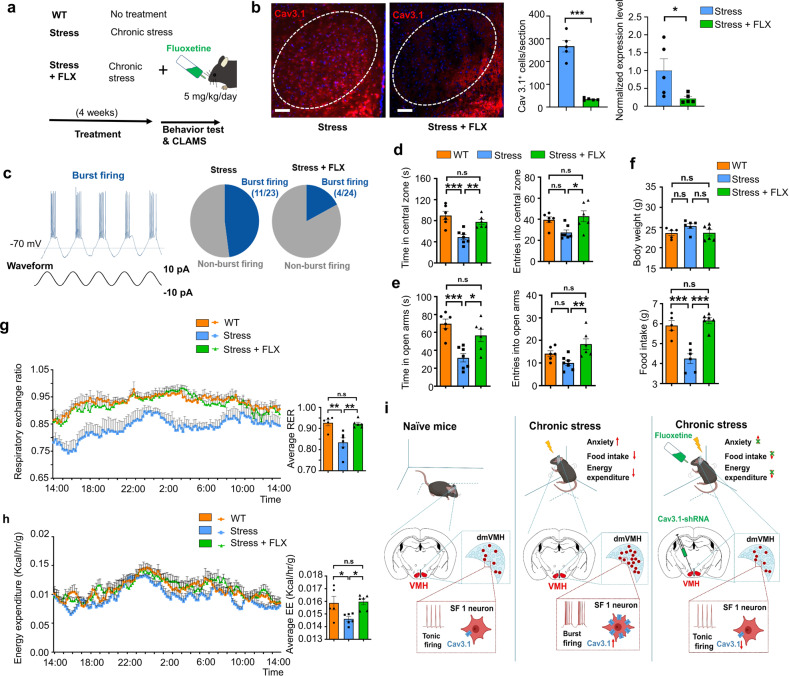
The central nervous system has evolved to coordinate the regulation of both the behavior response to the external environment and homeostasis of energy expenditure. Recent studies have indicated the dorsomedial ventromedial hypothalamus (dmVMH) as an important hub that regulates both innate behavior and energy homeostasis for coping stress. However, how dmVMH neurons control neuronal firing pattern to regulate chronic stress-induced anxiety and energy expenditure remains poorly understood. Here, we found enhanced neuronal activity in VMH after chronic stress, which is mainly induced by increased proportion of burst firing neurons. This enhancement of VMH burst firing is predominantly mediated by Cav3.1 expression. Optogenetically evoked burst firing of dmVMH neurons induced anxiety-like behavior, shifted the respiratory exchange ratio toward fat oxidation, and decreased food intake, while knockdown of Cav3.1 in the dmVMH had the opposite effects, suggested that Cav 3.1 as a crucial regulator. Interestingly, we found that fluoxetine (anxiolytics) could block the increase of Cav3.1 expression to inhibit the burst firing, and then rescued the anxiety-like behaviors and energy expenditure changes. Collectively, our study first revealed an important role of Cav3.1-driven bursting firing of dmVMH neurons in the control of anxiety-like behavior and energy expenditure, and provided potential therapeutic targets for treating the chronic stress-induced emotional malfunction and metabolism disorders.


Conflict of interest statement

The authors declare no competing interests.

Figures

Fig. 1
Fig. 1. Stressed mice exhibited anxiety-like behavior, altered metabolism, and enhanced neural activity in dmVMH.
a Illustration of unpredictable chronic stress protocol and phenotype assessment, with one stressor treatment randomly chosen per day, lasting for 4 weeks. b Residence time in each site of open field (blue, less time; red, more time). c Behavioral analysis of control (n = 10) and stress group mice (n = 11) in open field test showed significant decrease in both time spent in central area (unpaired Student’s t-test, P < 0.0001) and entries into central area in stress group (unpaired Student’s t-test, P = 0.0009), but no obvious change in traveling distance between groups (unpaired Student’s t-test, P = 0.4896). d Residence time in each site of elevated plus-maze (blue, less time; red, more time) of control and stress groups. e Control (n = 10) and stress groups (n = 11) in elevated plus-maze showed significant decrease in time spent in open arm (unpaired Student’s t-test, P < 0.0001) and entries into open arm in stress group (unpaired Student’s t-test, P < 0.0001), but no obvious change in traveling distance between groups (unpaired Student’s t-test, P = 0.9215). f Body weight monitored after chronic stress period showed no obvious change compared with control group (n = 9 in each group, unpaired Student’s t-test, P = 0.7125), and 24-h food intake after overnight fasting decreased in stress group (n = 9, unpaired Student’s t-test, P = 0.0014) compared with control group (n = 9). g Average respiration exchange ratio (RER) decreased in stress group compared with control group (unpaired student’s t-test, P = 0.0003, n = 9 mice in each group); RER curve shifted after chronic stress (two-way ANOVA, P = 0.0002, F (1, 16) = 21.95, with Bonferroni correction). h Significant decreases in 24-h energy expenditure (EE) curve and average EE were observed in stress group (two-way ANOVA, P = 0.0057, F (1, 16) = 20.2, with Bonferroni correction; unpaired Student’s t-test; P = 0.0060). i Increased c-fos expression in dmVMH under chronic stress (unpaired Student’s t-test, P < 0.001, n = 5 mice in each group). Scale bar, 100 µm. j Schematic of GCaMP6s injection and expression in VMH SF-1 neuron. Scale bar, 100 µm. k, l Representative in vivo calcium fluorescence traces and heat maps demonstrate enhanced spontaneous calcium signals (dF/F) of SF-1 neurons in mice of stress group compared with control (6 mice in each group, unpaired Student’s t-test, P < 0.001). Data are means ± SEM. *P < 0.05, **P < 0.01, ***P < 0.001. CLAMS comprehensive laboratory animal monitoring system.
Fig. 2
Fig. 2. Chronic stress-induced enhancement of burst firing in dmVMH neurons.
a Decreased average onset time (unpaired Student’s t-test, P = 0.0233) and depolarized average resting membrane potential (RMP) (unpaired Student’s t-test, P = 0.0434) in 84 dmVMH neurons from stressed mice compared with 85 neurons from wild-type control mice. b Cluster analysis of 85 dmVMH neurons from 35 control mice. Dendrogram of cluster analysis shows that dmVMH neurons could be classified into three subtypes: i.e., silent, tonic-firing, and bursting. c Electrophysiological properties of silent, tonic-firing, and bursting dmVMH neuronal subtypes. left: whole-cell recording traces of three neuronal subtypes without current injection; right: frequency-current curve of three subtypes at current injections of 0–100 pA and 10 pA/step. d Cluster analysis of 84 dmVMH neurons from 39 stressed mice. Dendrogram of cluster analysis shows these dmVMH neurons can be classified into three subtypes: i.e., silent (n = 11), tonic-firing (n = 35), and bursting (n = 38). e Pie chart of percentages of neuronal dmVMH subtypes in control group and stressed mice with obvious anxiety-like behavior (anxiety group). f Distribution of 85 dmVMH neurons in control mice (left) and 57 dmVMH neurons in anxiety group (right) using onset time-RMP coordinate system, which represents shorter average onset time and more depolarized average RMP caused by changes in proportion of three subtypes. g Inter-spike interval (ISI) of bursts in dmVMH neurons of control and stressed mice. Left, Example of burst firing and ISI; right, ISI of burst firing dmVMH neurons (n = 30) in anxiety group decreased significantly compared with that in control group (n = 28), and burst of anxiety group exhibited more spikes (unpaired Student’s t-test, ISI: P = 0.0173, spikes in each burst, P = 0.0036). h, i ISI of dmVMH bursting neurons in anxiety group (stressed mice which displayed obvious anxiety behavior) exhibits higher correlation with the residing time in open arms of EPM and central area of open field, compared with that in control group (control group: n = 28 cells from 21 mice; anxiety group: n = 30 cells from 20 mice). The box plotted at the median extending from the 25 to 75th percentile, and the whisker represents Min to Max distribution. Data are means ± SEM *P < 0.05, **P < 0.01.
Fig. 3
Fig. 3. Optogenetic activation of burst firing neurons in dmVMH induced anxiety-like behavior and energy expenditure changes.
a Schematic of dmVMH injection of NpHR AAV viral vector to induce burst firing in vivo. b Whole-cell recordings of yellow light-evoked burst firing in brain slices (yellow light: 590 nm, left: 0.1 Hz, 2 s; middle: 0.2 Hz, 1 s; right: 1 Hz, 200 ms), 0.1 Hz successfully induced activation of burst firing neurons in dmVMH. c Schematic of dmVMH injection of NpHR AAV and GCaMP6s AAV viral vector in SF-1 cre mice to achieve in vivo photometry recording and optogenetic manipulation. Scale bar, 100 µm. d Heatmaps demonstrate GCaMP6s fluorescence change induced by optogenetically induced burst firing (60 trails from 3 mice in each group). e Average traces of calcium fluorescence responses in VMH evoked by yellow light. f Illustration of wireless optogenetic manipulation of dmVMH neurons and behavioral test strategies in free-moving mice. g Open field tests before and during light illumination: residence time in central area decreased during 10-min yellow light illumination in NpHR group (n = 7, paired Student’s t-test, P = 0.0210), but not control group (n = 5, paired Student’s t-test, P = 0.4587). No significant effect of light stimulation was observed on number of entries into central area in two groups (paired Student’s t-test, control group: P = 0.3915; NpHR group: P = 0.5327). h Residence time in open arms decreased only in NpHR group (paired Student’s t-test, control group: n = 5, P = 0.6382; NpHR group: n = 6, P = 0.0036); No obvious changes in number of entries into open arms observed during “light-on” period in two groups (paired Student’s t-test, control group: P = 0.4908; NpHR group: P = 0.7060). i Schematic of CLAMS experiments on free-moving mice with wireless optogenetic manipulation of dmVMH neurons, 0.1-Hz yellow light illumination at the start of the test period at Day 2 for 2 h and repeated the stimulation after 12 h. j Food intake and energy expenditure were monitored during optogenetic manipulation of dmVMH neurons in free-moving mice. Food intake decreased during light stimulation in NpHR group (paired Student’s t-test, control group: P = 0.6240; NpHR group: P = 0.0038, n = 5 mice in each group), also average RER (paired Student’s t-test, control group: P = 0.7058; NpHR group: P = 0.0176) and EE (paired Student’s t-test, control group: P = 0.9502; NpHR group: P = 0.0383) decreased in NpHR group. kl 24-h-RER and EE curve of NpHR group in Day 2 (0.1 Hz, 2 s yellow light; lasting for 2 h/trial, 2 trials) shifted compare with baseline. (two-way ANOVA, RER: P = 0.0053, F (1, 8) = 14.38; EE: P = 0.0143, F (1, 8) = 9.699, with Bonferroni correction), and no significant change occurs in control group (two-way ANOVA, RER: P = 0.7709, F (1, 8) = 0.0907; EE: P = 0.9457, F (1, 8) = 0.0049, with Bonferroni correction). Data are means ± SEM; *P < 0.05, **P < 0.01.
Fig. 4
Fig. 4. T-VGCC mediated enhancement of burst firing in dmVMH neurons under chronic stress.
a Evoked burst firing trace of dmVMH neurons without and with T-VGCC antagonist (mibefradil, 10 μM), 10 pA current injection was given in cosine waveform. b Effects of mibefradil on suprathreshold activity in dmVMH burst firing neurons in control (n = 5 cells from 4 mice) and anxiety groups (n = 7 cells from 5 mice). Mibefradil inhibited T-VGCC and caused a rightward frequency-current curve shift (two-way ANOVA, control, P = 0.2140, F (1, 8) = 1.854; anxiety, P = 0.0077, F (1, 12) = 10.22, with Bonferroni correction). c Schematic of cannula implanted sites and experimental strategy of T-VGCC blockage in the VMH of chronic stress-treated mice. d Behavioral test before and after delivery of mibefradil or saline; left, residence time in central area of open field increased after mibefradil application (n = 4 in each group, P = 0.0142, paired Student’s t-test); right, residence time in open arm increased after mibefradil application (n = 4 in each group, P = 0.0228, paired Student’s t-test). eh Administration of mibefradil in stressed mice increased food intake (n = 4 in each group, P = 0.0030, unpaired Student’s t-test), average RER (P = 0.00671, paired Student’s t-test) and average EE (P = 0.0482, paired Student’s t-test). RER and EE curve shifted (two-way ANOVA, RER: P = 0.0067, F (1, 6) = 16.42; EE: P = 0.0301, F (1, 6) = 7.993, with Bonferroni correction) after applying mibefradil. No comparable changes were observed in saline group. i Schematic Structure of voltage-gated calcium channel located on cell membrane (left top). Representative immunofluorescence showing Cav 3.1 (left bottom), Cav 3.2 (right top), and Cav 3.3 (right bottom) expression in dmVMH of control and anxiety mice respectively, significantly increased Cav3.1 expression observed after chronic stress (Cav3.1+ cells counting, unpaired Student’s t-test, P < 0.001). Scale bar: 100 μm. j Quantification of T-VGCCs expression in dmVMH tissue between control (n = 5 mice) and anxiety groups (n = 6 mice). Expression of Cav 3.1 was significantly upregulated under chronic stress conditions (unpaired Student’s t-test, P = 0.0232). k Single-cell qRT-PCR analysis of T-VGCC expression in dmVMH neuronal subtypes between control (n = 16 cells) and anxiety groups (n = 13 cells). Expression of Cav 3.1 in burst firing neurons was significantly upregulated in anxiety group (unpaired Student’s t-test, Cav3.1, P = 0.0164). means ± SEM. *P < 0.05, **P < 0.01.
Fig. 5
Fig. 5. Knockdown of Cav3.1 in dmVMH decreased burst firing, and rescued anxiety-like behavior and metabolic alteration induced by chronic stress.
a Schematic demonstrates injection of DIO-based shRNA-expressing AAV viral vector into dmVMH of SF-1 cre mice to interfere with Cav 3.1 expression. b Immunostaining of Cav 3.1 in stressed mice injected with shRNA-NC (negative control) or shRNA-Cav3.1 AAV vector. Scale bar is 100 μm. Cell counting (right, up) and gene expression analysis (right bottom) indicated an effective knock-down of Cav3.1 expression in stress + Cav3.1 group (Cav3.1+ cells counting, unpaired Student’s t-test, P < 0.001; Q-PCR, unpaired Student’s t-test, P < 0.001). c Proportion of burst firing neurons decreased in stress + Cav3.1 group (4/22) compared with stress + vector group (11/21). d Schematic of injection of GCaMP6s AAV viral vector into dmVMH of SF-1 cre mice to achieve in vivo photometry recording. Scale bar, 100 µm. e Representative traces of spontaneous calcium transients in VMH of stress + vector and stress + Cav3.1 groups. f Heatmaps demonstrate different spontaneous GCaMP6s fluorescence signals in stress + vector and stress + Cav3.1 groups (6 mice in each group, unpaired Student’s t-test, P < 0.001). g Time spent in central area and number of entries into central area of open field in WT, stress, stress + vector and stress + Cav3.1 groups. Residence time: P = 0.0024; WT (n = 9) versus stress group (n = 8), P = 0.0324; stress + vector (n = 7) versus stress + Cav3.1 group (n = 8), P = 0.0261; stress versus stress + Cav3.1 group, P = 0.0084. Number of entries: P = 0.0024; WT versus stress group, P = 0.1795; stress + vector versus stress + Cav3.1 group, P = 0. 2843; stress versus stress + Cav3.1 group, P = 0.0433. (one way ANOVA, with Bonferroni correction). h Time spent in open arms and number of entries into open arms of elevated plus-maze in WT, stress, stress + vector and stress + Cav3.1 groups. Residence time: P = 0.0002; WT (n = 9) versus stress group (n = 8), P = 0.0019; stress + vector (n = 7) versus stress + Cav3.1 group (n = 8), P = 0.0142; WT versus stress + vector group: P = 0.0013; stress versus stress + Cav3.1 group, P = 0.0219. Number of entries: P = 0.0025; WT versus stress group, P = 0.0031; stress + vector versus stress + Cav3.1 group, P = 0.9999; stress versus stress + Cav3.1 group, P = 0.0121 (one way ANOVA, with Bonferroni correction). i No significant differences in average body weights of WT, stress, stress + vector and stress + Cav3.1 groups were observed after 4 weeks of chronic stress (P = 0.4755); WT (n = 9) versus stress group (n = 8), P = 0.9999; stress + vector (n = 7) versus stress + Cav3.1 group (n = 8), P = 0.9999; Food intake: P < 0. 0001; WT versus stress group, P = 0.0001; stress + vector versus stress + Cav3.1 group, P < 0.0001; WT versus stress + vector group, P < 0.0001; stress versus stress + Cav3.1− group, P < 0.0001. Average RER: P < 0.0001; WT versus stress group, P = 0.0003; stress + vector versus stress + Cav3.1 group, P < 0.0001; WT versus stress + vector group, P = 0.0016; stress versus stress + Cav3.1− group, P < 0.0001. Average EE: P < 0.0001; WT versus stress group, P < 0.0001; stress + vector versus stress + Cav3.1 group, P = 0.0112; WT versus stress + vector group, P = 0.0189; stress versus stress + Cav3.1− group, P < 0.0001 (one way ANOVA with Bonferroni correction). j, k 24-h RER and EE curve of WT, stress, stress + vector and stress + Cav3.1 groups; For RER: two-way ANOVA: WT versus stress group, P = 0.0251, F(1, 15) = 6.186; stress + vector versus stress + Cav3.1 group, P = 0.0289, F(1, 13) = 6.027; 8 mice in each group; For EE: two-way ANOVA: WT versus stress group, P < 0.001, F(1, 15) = 31.40; stress + vector versus stress + Cav3.1 group, P = 0.0062, F(1, 13) = 10.654). All two-way ANOVA are performed with Bonferroni correction. Data are means ± SEM, *P < 0.05, **P < 0.01, ***P < 0.001.
Fig. 6
Fig. 6. Anxiolytics suppressed Cav3.1 expression and burst firing in VMH, and rescued anxiety-like behavior and metabolic alteration induced by chronic stress.
a Schematic demonstrates fluoxetine application and related experimental strategy. b Immunostaining of Cav 3.1 in mice undergo chronic stress alone or chronic stress plus fluoxetine treatment. Scale bar is 100 μm. Quantification of Cav3.1 expression (right) in these two groups (Cav3.1+ cells counting, unpaired Student’s t-test, P < 0.001; qRT-PCR, Mann–Whitney test, P = 0.0397). c Proportion of burst firing neurons decreased in stress + FLX (fluoxetine) group (4/24) compared with stress group (11/23). d Time spent in central area and number of entries into central area of open field in WT, stress, and stress + FLX groups. Residence time: P = 0.0004; WT (n = 6) versus stress group (n = 7), P = 0.0004; stress versus stress + FLX group (n = 6), P = 0.0091. Number of entries: P = 0.0160; WT versus stress group, P = 0.0827; stress versus stress + FLX group, P = 0.0209 (one way ANOVA with Bonferroni correction). e Time spent in open arms and number of entries into open arms of elevated plus-maze in WT, stress, and stress + FLX groups. Residence time: P = 0.0006; WT (n = 6) versus stress group (n = 7), P = 0.0005; stress versus stress + FLX group (n = 6), P = 0.0169. Number of entries: P = 0.0075; WT versus stress group, P = 0.2547; stress versus stress + FLX group, P = 0.0062 (one way ANOVA with Bonferroni correction). f No significant differences in average body weights of WT, stress, and stress + FLX groups were observed after 4 weeks of treatments, P = 0.1334; WT (n = 5) versus stress group (n = 6), P = 0.1890; stress versus stress + FLX group (n = 6), P = 0.1869. Food intake of mice in WT, stress, and stress + FLX group: P < 0.0001; WT versus stress group, P = 0.0003; stress versus stress + FLX group, P < 0.0001. (one way ANOVA with Bonferroni correction). g, h 24-h RER and EE curve of WT, stress and stress + FLX groups; For RER: two-way ANOVA: WT versus stress group, P = 0.0060, F(1, 9) = 12.8; stress versus stress + FLX group, P = 0.0030, F(1, 10) = 15.19; For EE: two-way ANOVA: WT versus stress group, P = 0.0375, F(1, 9) = 5.939; stress versus stress + FLX group, P = 0.0010, F(1, 10) = 20.89. Average RER of WT, stress, and stress + FLX group: one way ANOVA with Bonferroni correction, P = 0.0013; WT versus stress group, P = 0.0034; stress versus stress + FLX group, P = 0.0036. Average EE of WT, stress, and stress + FLX group: one way ANOVA with Bonferroni correction, P = 0.0169; WT versus stress group, P = 0.0463; stress + vector versus stress + FLX group, P = 0.0230. i Schematic showing that chronic stress enhanced burst firing and Cav3.1 expression in dmVMH neurons to induce the anxiety-like behavior and energy expenditure changes, which could be rescued by knocking down of Cav3.1 or application of anxiolytics. All two-way ANOVA are performed with Bonferroni correction. Data are means ± SEM, *P < 0.05, **P < 0.01, ***P < 0.001.

Similar articles

Cited by

References

    1. Koolhaas JM, Korte SM, De Boer SF, Van Der Vegt BJ, Van Reenen CG, Hopster H, et al. Coping styles in animals: current status in behavior and stress-physiology. Neurosci Biobehav Rev. 1999;23:925–35. doi: 10.1016/S0149-7634(99)00026-3. - DOI - PubMed
    1. Viskaitis P, Irvine EE, Smith MA, Choudhury AI, Alvarez-Curto E, Glegola JA, et al. Modulation of SF1 neuron activity coordinately regulates both feeding behavior and associated emotional states. Cell Rep. 2017;21:3559–72. doi: 10.1016/j.celrep.2017.11.089. - DOI - PMC - PubMed
    1. Ip CK, Zhang L, Farzi A, Qi Y, Clarke I, Reed F, et al. Amygdala NPY circuits promote the development of accelerated obesity under chronic stress conditions. Cell Metab. 2019;30:111–28.e116. doi: 10.1016/j.cmet.2019.04.001. - DOI - PubMed
    1. Kuperman Y, Issler O, Regev L, Musseri I, Navon I, Neufeld-Cohen A, et al. Perifornical Urocortin-3 mediates the link between stress-induced anxiety and energy homeostasis. Proc Natl Acad Sci USA. 2010;107:8393–8. doi: 10.1073/pnas.1003969107. - DOI - PMC - PubMed
    1. Gross C, Hen R. The developmental origins of anxiety. Nat Rev Neurosci. 2004;5:545–52. doi: 10.1038/nrn1429. - DOI - PubMed

Publication types