

Improving large-scale estimation and inference for profiling health care providers
- PMID: 35318706
- PMCID: PMC9314652
- DOI: 10.1002/sim.9387
Improving large-scale estimation and inference for profiling health care providers
Abstract
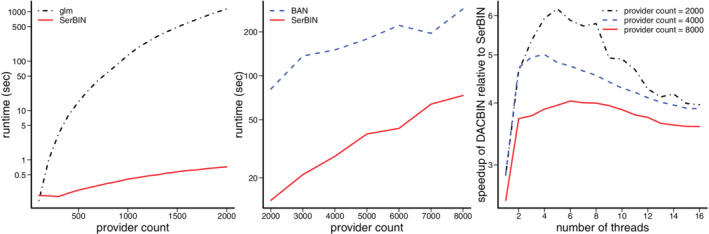
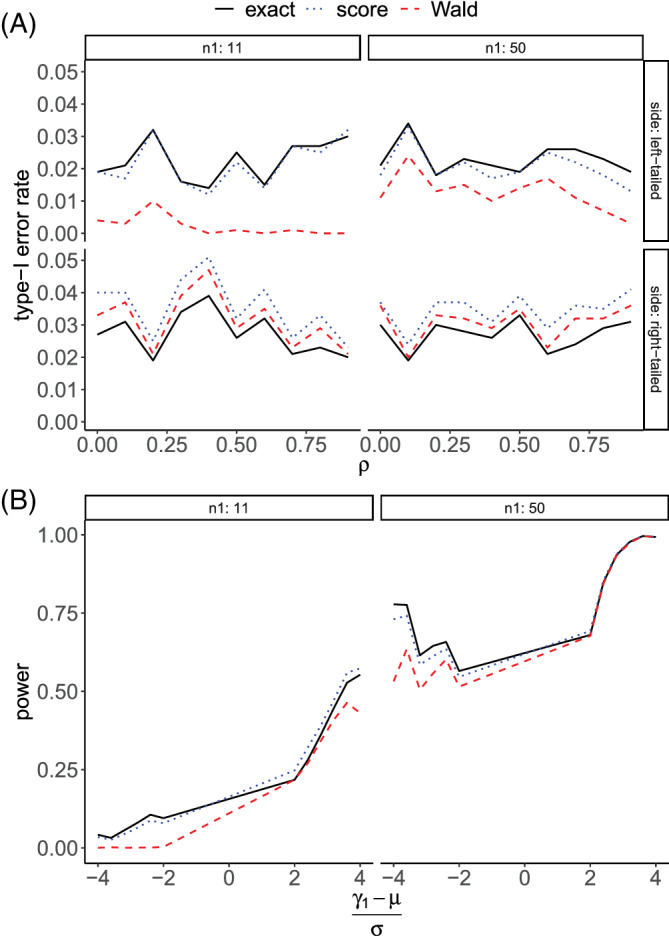
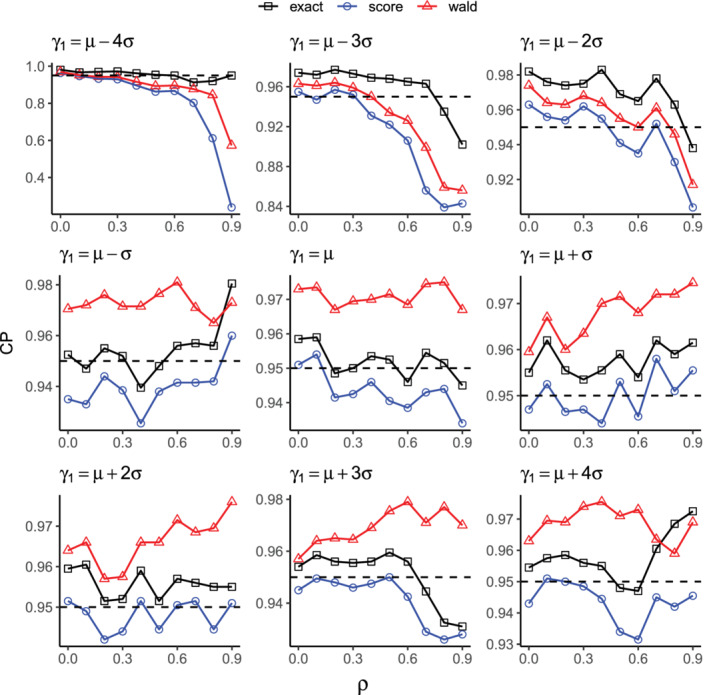
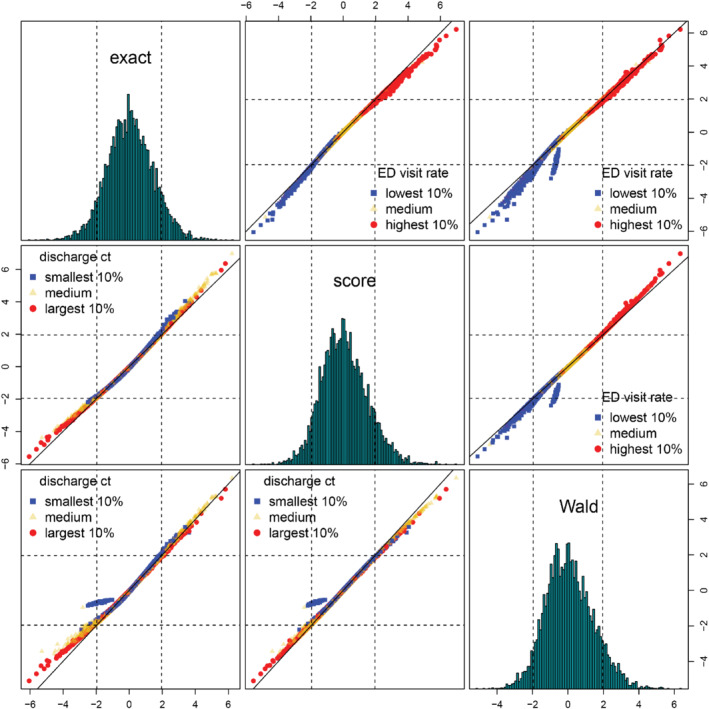
Provider profiling has been recognized as a useful tool in monitoring health care quality, facilitating inter-provider care coordination, and improving medical cost-effectiveness. Existing methods often use generalized linear models with fixed provider effects, especially when profiling dialysis facilities. As the number of providers under evaluation escalates, the computational burden becomes formidable even for specially designed workstations. To address this challenge, we introduce a serial blockwise inversion Newton algorithm exploiting the block structure of the information matrix. A shared-memory divide-and-conquer algorithm is proposed to further boost computational efficiency. In addition to the computational challenge, the current literature lacks an appropriate inferential approach to detecting providers with outlying performance especially when small providers with extreme outcomes are present. In this context, traditional score and Wald tests relying on large-sample distributions of the test statistics lead to inaccurate approximations of the small-sample properties. In light of the inferential issue, we develop an exact test of provider effects using exact finite-sample distributions, with the Poisson-binomial distribution as a special case when the outcome is binary. Simulation analyses demonstrate improved estimation and inference over existing methods. The proposed methods are applied to profiling dialysis facilities based on emergency department encounters using a dialysis patient database from the Centers for Medicare & Medicaid Services.
Keywords: Poisson-binomial distribution; divide-and-conquer; emergency department encounters; exact test; parallel computing.
© 2022 The Authors. Statistics in Medicine published by John Wiley & Sons Ltd.
Conflict of interest statement
The authors declare no potential conflict of interests.
Figures
Similar articles
-
Assessing the Impacts of Misclassified Case-Mix Factors on Health Care Provider Profiling: Performance of Dialysis Facilities.Inquiry. 2020 Jan-Dec;57:46958020919275. doi: 10.1177/0046958020919275. Inquiry. 2020. PMID: 32478600 Free PMC article.
-
Provider monitoring and pay-for-performance when multiple providers affect outcomes: An application to renal dialysis.Health Serv Res. 2009 Oct;44(5 Pt 1):1585-602. doi: 10.1111/j.1475-6773.2009.00990.x. Epub 2009 Jun 22. Health Serv Res. 2009. PMID: 19555398 Free PMC article.
-
Fixed Effects High-Dimensional Profiling Models in Low Information Context.Int J Stat Med Res. 2021;10:118-131. doi: 10.6000/1929-6029.2021.10.11. Epub 2021 Sep 27. Int J Stat Med Res. 2021. PMID: 35465259 Free PMC article.
-
Payment methods for healthcare providers working in outpatient healthcare settings.Cochrane Database Syst Rev. 2021 Jan 20;1(1):CD011865. doi: 10.1002/14651858.CD011865.pub2. Cochrane Database Syst Rev. 2021. PMID: 33469932 Free PMC article.
-
Physician Quality Reporting System (PQRS) for Interventional Pain Management Practices: Challenges and Opportunities.Pain Physician. 2016 Jan;19(1):E15-32. Pain Physician. 2016. PMID: 26752483 Review.
Cited by
-
High-Dimensional Fixed Effects Profiling Models and Applications in End-Stage Kidney Disease Patients: Current State and Future Directions.Int J Stat Med Res. 2023 Feb 15;12:193-212. doi: 10.6000/1929-6029.2023.12.24. Int J Stat Med Res. 2023. PMID: 38883969 Free PMC article.
-
Test-specific funnel plots for healthcare provider profiling leveraging individual- and summary-level information.Health Serv Outcomes Res Methodol. 2023 Mar;23:45-58. doi: 10.1007/s10742-022-00285-9. Epub 2022 Jul 6. Health Serv Outcomes Res Methodol. 2023. PMID: 37621728 Free PMC article.
-
Competing Risk Modeling with Bivariate Varying Coefficients to Understand the Dynamic Impact of COVID-19.J Comput Graph Stat. 2024;33(4):1252-1263. doi: 10.1080/10618600.2024.2304089. Epub 2024 Feb 13. J Comput Graph Stat. 2024. PMID: 39691744 Free PMC article.
References
-
- Auerbach BS, Bell K, Bloomberg M, et al. Principles for Profiling Physician Performance. Waltham, MA: Massachusetts Medical Society; 1999.
-
- Jones HE, Spiegelhalter DJ. The identification of "unusual" health‐care providers from a hierarchical model. Am Stat. 2011;65(3):154‐163.
Publication types
MeSH terms
LinkOut - more resources
Full Text Sources
Medical
Research Materials