

A Chirality-Based Quantum Leap
- PMID: 35318848
- PMCID: PMC9278663
- DOI: 10.1021/acsnano.1c01347
A Chirality-Based Quantum Leap
Abstract
There is increasing interest in the study of chiral degrees of freedom occurring in matter and in electromagnetic fields. Opportunities in quantum sciences will likely exploit two main areas that are the focus of this Review: (1) recent observations of the chiral-induced spin selectivity (CISS) effect in chiral molecules and engineered nanomaterials and (2) rapidly evolving nanophotonic strategies designed to amplify chiral light-matter interactions. On the one hand, the CISS effect underpins the observation that charge transport through nanoscopic chiral structures favors a particular electronic spin orientation, resulting in large room-temperature spin polarizations. Observations of the CISS effect suggest opportunities for spin control and for the design and fabrication of room-temperature quantum devices from the bottom up, with atomic-scale precision and molecular modularity. On the other hand, chiral-optical effects that depend on both spin- and orbital-angular momentum of photons could offer key advantages in all-optical and quantum information technologies. In particular, amplification of these chiral light-matter interactions using rationally designed plasmonic and dielectric nanomaterials provide approaches to manipulate light intensity, polarization, and phase in confined nanoscale geometries. Any technology that relies on optimal charge transport, or optical control and readout, including quantum devices for logic, sensing, and storage, may benefit from chiral quantum properties. These properties can be theoretically and experimentally investigated from a quantum information perspective, which has not yet been fully developed. There are uncharted implications for the quantum sciences once chiral couplings can be engineered to control the storage, transduction, and manipulation of quantum information. This forward-looking Review provides a survey of the experimental and theoretical fundamentals of chiral-influenced quantum effects and presents a vision for their possible future roles in enabling room-temperature quantum technologies.
Keywords: chiral imprinting; chirality; electron transport; photoexcitation; probe microscopy; quantum biology; quantum information; quantum materials; spintronics.
Conflict of interest statement
The authors declare no competing financial interest.
Figures
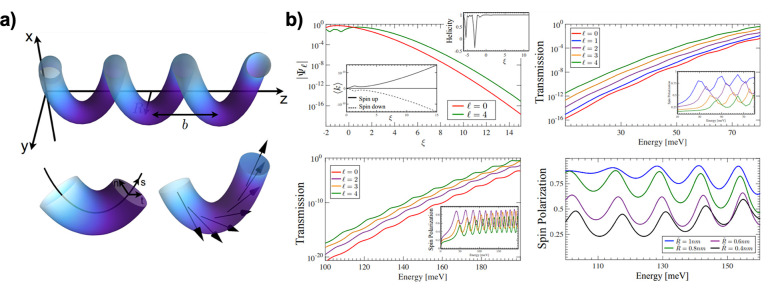
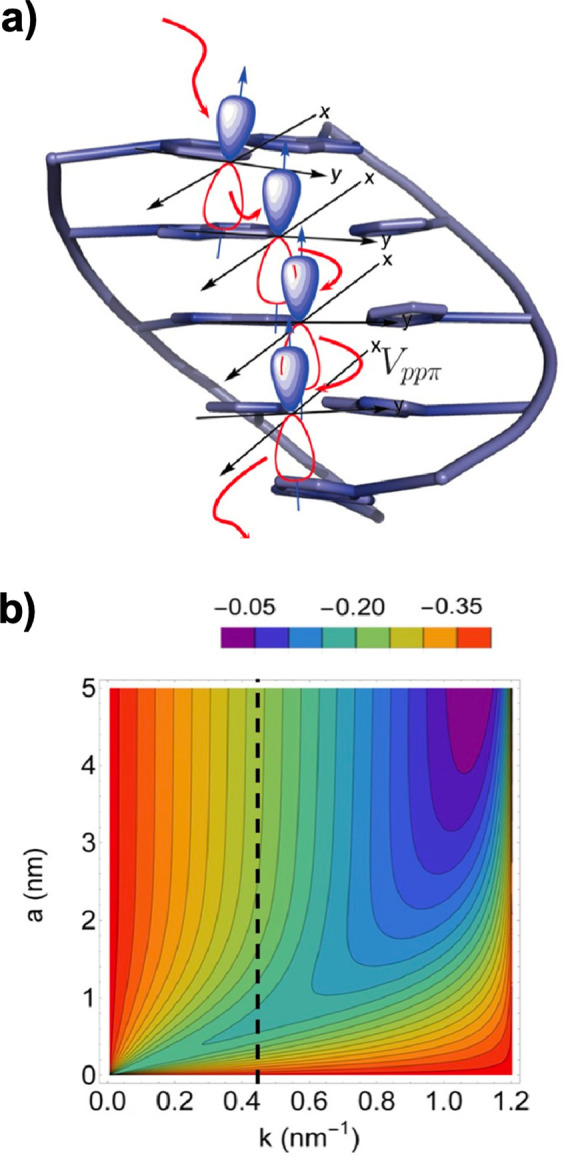
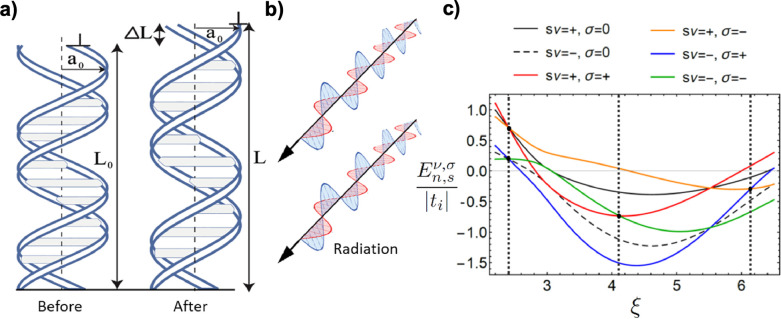
 . The scattering
matrix is derived for the exact wave
function. This panel shows
that the enhanced transmission for
. The scattering
matrix is derived for the exact wave
function. This panel shows
that the enhanced transmission for  is accompanied by a spin polarization (inset).
(Bottom left) Similar results were obtained using a tight binding
calculation for a molecule with the same parameter but somewhat different
length. (Bottom right) Deforming the molecule to have a larger pitch
or radius helps spin polarization. All panels adapted with permission
from ref (127). Copyright
2019 American Chemical Society.
is accompanied by a spin polarization (inset).
(Bottom left) Similar results were obtained using a tight binding
calculation for a molecule with the same parameter but somewhat different
length. (Bottom right) Deforming the molecule to have a larger pitch
or radius helps spin polarization. All panels adapted with permission
from ref (127). Copyright
2019 American Chemical Society.
Similar articles
-
Chirality-Induced Spin Selectivity in Composite Materials: A Device Perspective.Acc Chem Res. 2024 May 21;57(10):1478-1487. doi: 10.1021/acs.accounts.4c00077. Epub 2024 Apr 30. Acc Chem Res. 2024. PMID: 38687873 Free PMC article.
-
Nanophotonic Platforms for Chiral Sensing and Separation.Acc Chem Res. 2020 Mar 17;53(3):588-598. doi: 10.1021/acs.accounts.9b00460. Epub 2020 Jan 8. Acc Chem Res. 2020. PMID: 31913015 Review.
-
The chirality-induced spin selectivity effect in asymmetric spin transport: from solution to device applications.Chem Sci. 2024 Oct 29;15(45):18751-18771. doi: 10.1039/d4sc05736h. eCollection 2024 Nov 20. Chem Sci. 2024. PMID: 39568626 Free PMC article. Review.
-
Spin Selectivity in Photoinduced Charge-Transfer Mediated by Chiral Molecules.ACS Nano. 2019 May 28;13(5):4928-4946. doi: 10.1021/acsnano.9b01876. Epub 2019 May 7. ACS Nano. 2019. PMID: 31016968
-
Spin Quantum Dot Light-Emitting Diodes Enabled by 2D Chiral Perovskite with Spin-Dependent Carrier Transport.Adv Mater. 2024 Feb;36(5):e2305604. doi: 10.1002/adma.202305604. Epub 2023 Dec 5. Adv Mater. 2024. PMID: 37789724
Cited by
-
Mechanism for Electrostatically Generated Magnetoresistance in Chiral Systems without Spin-Dependent Transport.ACS Nano. 2024 Feb 27;18(8):6028-6037. doi: 10.1021/acsnano.3c12925. Epub 2024 Feb 14. ACS Nano. 2024. PMID: 38353652 Free PMC article. Review.
-
Detection of a Chirality-Induced Spin Selective Quantum Capacitance in α-Helical Peptides.Nano Lett. 2023 Sep 13;23(17):8280-8287. doi: 10.1021/acs.nanolett.3c02483. Epub 2023 Aug 31. Nano Lett. 2023. PMID: 37650519 Free PMC article.
-
Enantiopure Dinaphtho[2,3-b:2,3-f]thieno[3,2-b]thiophenes: Reaching High Magnetoresistance Effect in OFETs.Adv Sci (Weinh). 2023 Sep;10(26):e2301914. doi: 10.1002/advs.202301914. Epub 2023 Jul 9. Adv Sci (Weinh). 2023. PMID: 37424043 Free PMC article.
-
Chiral light-matter interactions in solution-processable semiconductors.Nat Rev Chem. 2025 Apr;9(4):208-223. doi: 10.1038/s41570-025-00690-x. Epub 2025 Feb 17. Nat Rev Chem. 2025. PMID: 39962270 Review.
-
Magneto-Structural Correlations in Coordination Polymers Based on Formate Ligand and Transition Metal Cations.Inorg Chem. 2025 May 19;64(19):9758-9771. doi: 10.1021/acs.inorgchem.4c04737. Epub 2025 Apr 10. Inorg Chem. 2025. PMID: 40208057 Free PMC article.
References
-
- Yang S.-H.; Naaman R.; Paltiel Y.; Parkin S. S. P. Chiral Spintronics. Nat. Rev. Phys. 2021, 3, 328–v. 10.1038/s42254-021-00302-9. - DOI
