

Cytokine signature clusters as a tool to compare changes associated with tobacco product use in upper and lower airway samples
- PMID: 35318855
- PMCID: PMC9054348
- DOI: 10.1152/ajplung.00299.2021
Cytokine signature clusters as a tool to compare changes associated with tobacco product use in upper and lower airway samples
Abstract
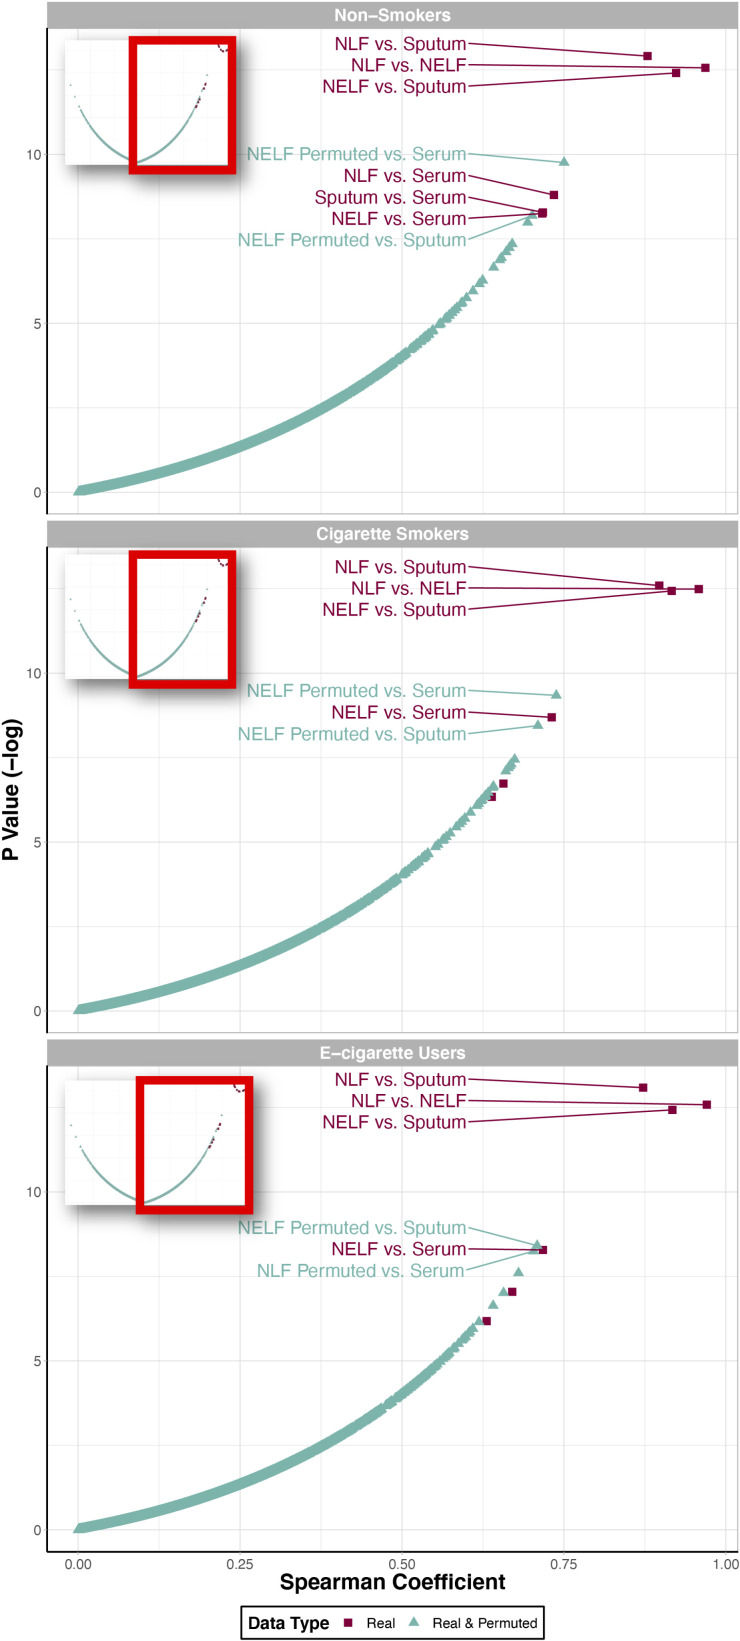
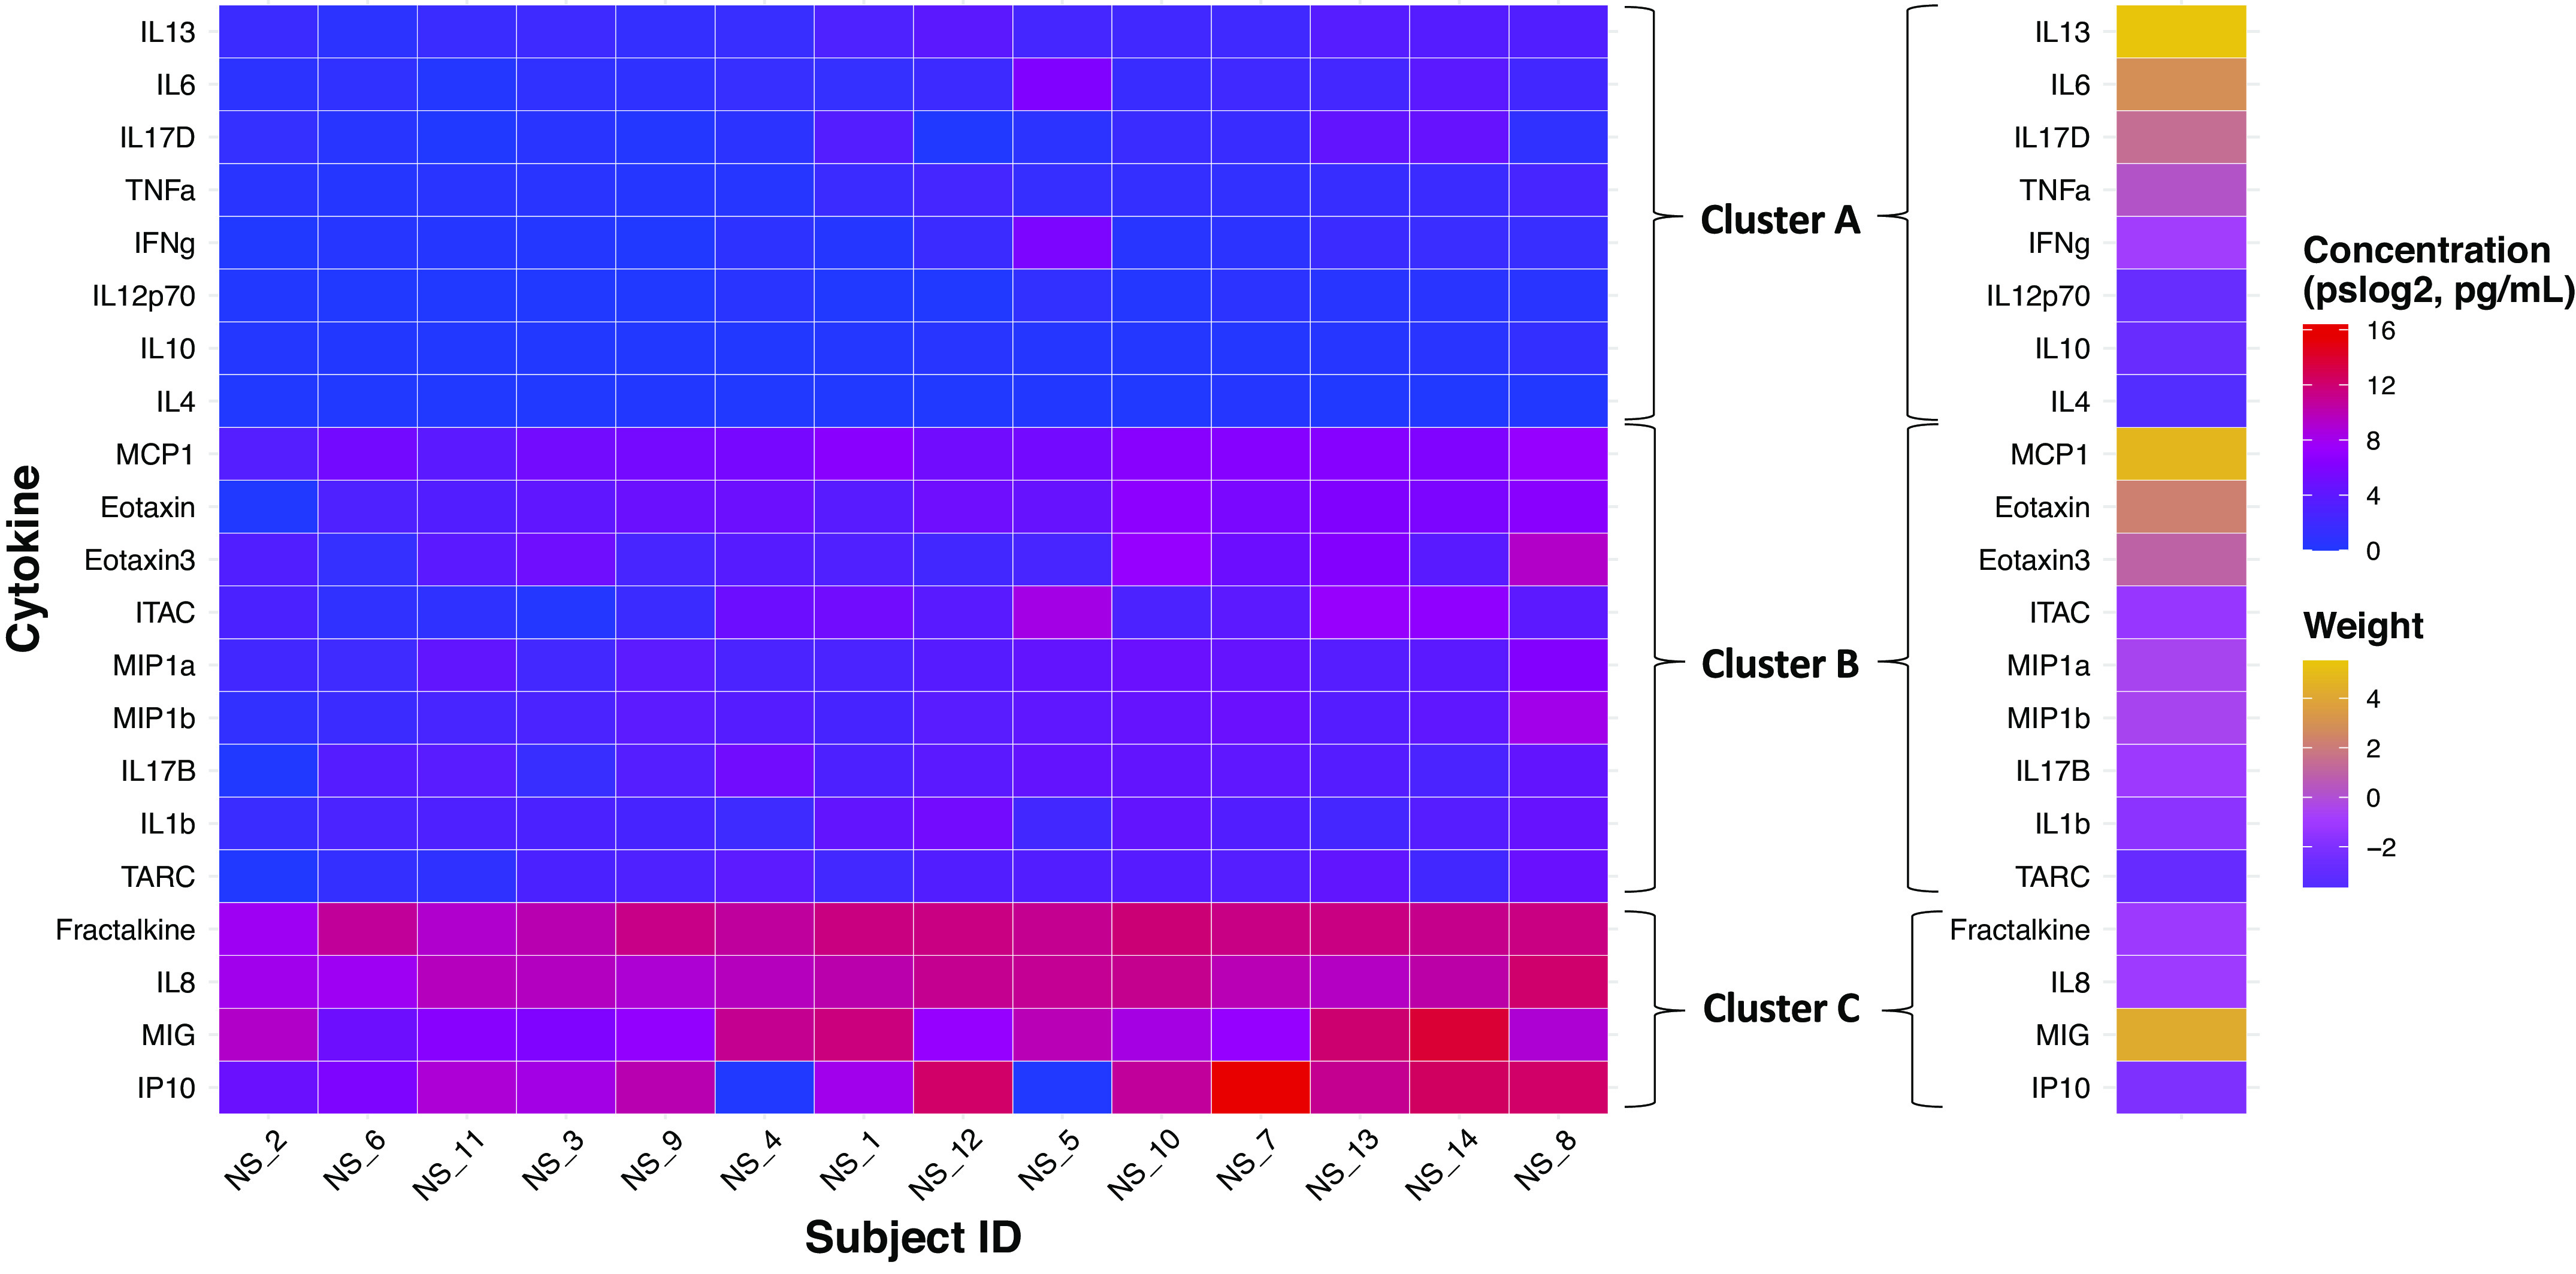
Inhalation exposure to cigarette smoke and e-cigarette aerosol is known to alter the respiratory immune system, particularly cytokine signaling. In assessments of health impacts of tobacco product use, cytokines are often measured using a variety of sample types, from serum to airway mucosa. However, it is currently unclear whether and how well cytokine levels from different sample types and the airway locations they represent are correlated, making comparing studies that utilize differing sample types challenging. To address this challenge, we compared baseline cytokine signatures in upper and lower airways and systemic samples and evaluated how groups of coexpressed cytokines change with tobacco product use. Matched nasal lavage fluid (NLF), nasal epithelial lining fluid (NELF), sputum, and circulating serum samples were collected from 14 nonsmokers, 13 cigarette smokers, and 17 e-cigarette users and analyzed for levels of 22 cytokines. Individual cytokine signatures were first compared across each sample type, followed by identification of cytokine clusters within each sample type. Identified clusters were then evaluated for potential alterations following tobacco product use using eigenvector analyses. Individual cytokine signatures in the respiratory tract were significantly correlated (NLF, NELF, and sputum) compared with randomly permutated signatures, whereas serum was not significantly different from random permutations. Cytokine clusters that were similar across airway sample types were modified by tobacco product use, particularly e-cigarettes, indicating a degree of uniformity in terms of how cytokine host defense and immune cell recruitment responses cooperate in the upper and lower airways. Overall, cluster-based analyses were found to be especially useful in small cohort assessments, providing higher sensitivity than individual signatures to detect biologically meaningful differences between tobacco use groups. This novel cluster analysis approach revealed that eigencytokine patterns in noninvasive upper airway samples simulate cytokine patterns in lower airways.
Keywords: cytokine clusters; tobacco product use; unsupervised machine learning; upper and lower airways.
Conflict of interest statement
No conflicts of interest, financial or otherwise, are declared by the authors.
Figures


Similar articles
-
Electronic-Cigarette Use Alters Nasal Mucosal Immune Response to Live-attenuated Influenza Virus. A Clinical Trial.Am J Respir Cell Mol Biol. 2021 Jan;64(1):126-137. doi: 10.1165/rcmb.2020-0164OC. Am J Respir Cell Mol Biol. 2021. PMID: 33095645 Free PMC article.
-
A cross-category puffing topography, mouth level exposure and consumption study among Italian users of tobacco and nicotine products.Sci Rep. 2020 Jan 8;10(1):12. doi: 10.1038/s41598-019-55410-5. Sci Rep. 2020. PMID: 31913299 Free PMC article.
-
Inflammatory phenotype modulation in the respiratory tract and systemic circulation of e-cigarette users: a pilot study.Am J Physiol Lung Cell Mol Physiol. 2021 Dec 1;321(6):L1134-L1146. doi: 10.1152/ajplung.00363.2021. Epub 2021 Oct 27. Am J Physiol Lung Cell Mol Physiol. 2021. PMID: 34704852 Free PMC article.
-
Effects of reduced-risk nicotine-delivery products on smoking prevalence and cigarette sales: an observational study.Public Health Res (Southampt). 2023 Sep;11(7):1-39. doi: 10.3310/RPDN7327. Public Health Res (Southampt). 2023. PMID: 37795840
-
Role of testing standards in smoke-free product assessments.Regul Toxicol Pharmacol. 2018 Oct;98:1-8. doi: 10.1016/j.yrtph.2018.06.021. Epub 2018 Jul 2. Regul Toxicol Pharmacol. 2018. PMID: 29983383 Review.
Cited by
-
Navigating the bridge between wet and dry lab toxicology research to address current challenges with high-dimensional data.Front Toxicol. 2023 May 26;5:1171175. doi: 10.3389/ftox.2023.1171175. eCollection 2023. Front Toxicol. 2023. PMID: 37304253 Free PMC article.
-
Wildfires and climate justice: future wildfire events predicted to disproportionally impact socioeconomically vulnerable communities in North Carolina.Front Public Health. 2024 Apr 29;12:1339700. doi: 10.3389/fpubh.2024.1339700. eCollection 2024. Front Public Health. 2024. PMID: 38741908 Free PMC article.
-
Burn Pit Smoke Condensate-Mediated Toxicity in Human Airway Epithelial Cells.Chem Res Toxicol. 2024 May 20;37(5):791-803. doi: 10.1021/acs.chemrestox.4c00064. Epub 2024 Apr 23. Chem Res Toxicol. 2024. PMID: 38652897 Free PMC article.
-
Nasal biomarkers of immune function differ based on smoking and respiratory disease status.Physiol Rep. 2023 Feb;11(3):e15528. doi: 10.14814/phy2.15528. Physiol Rep. 2023. PMID: 36780897 Free PMC article.
-
Air Pollution and Diet: Potential Interacting Exposures in Asthma.Curr Allergy Asthma Rep. 2023 Sep;23(9):541-553. doi: 10.1007/s11882-023-01101-1. Epub 2023 Jul 13. Curr Allergy Asthma Rep. 2023. PMID: 37440094 Review.
References
-
- Martin EM, Clapp PW, Rebuli ME, Pawlak EA, Glista-Baker E, Benowitz NL, Fry RC, Jaspers I. E-cigarette use results in suppression of immune and inflammatory-response genes in nasal epithelial cells similar to cigarette smoke. Am J Physiol Lung Cell Mol Physiol 311: L135–L144, 2016. doi:10.1152/ajplung.00170.2016. - DOI - PMC - PubMed
-
- Rebuli ME, Glista-Baker E, Hoffman JR, Duffney PF, Robinette C, Speen AM, Pawlak EA, Dhingra R, Noah TL, Jaspers I. Electronic-cigarette use alters nasal mucosal immune response to live-attenuated influenza virus. A clinical trial. Am J Respir Cell Mol Biol 64: 126–137, 2021. doi:10.1165/rcmb.2020-0164OC. - DOI - PMC - PubMed
Publication types
MeSH terms
Substances
Grants and funding
LinkOut - more resources
Full Text Sources
Medical