. 2022 Apr;28(4):820-827.
doi: 10.3201/eid2804.212014.

Decrease in Tuberculosis Cases during COVID-19 Pandemic as Reflected by Outpatient Pharmacy Data, United States, 2020

Decrease in Tuberculosis Cases during COVID-19 Pandemic as Reflected by Outpatient Pharmacy Data, United States, 2020

Kathryn Winglee et al. Emerg Infect Dis. 2022 Apr.

Abstract

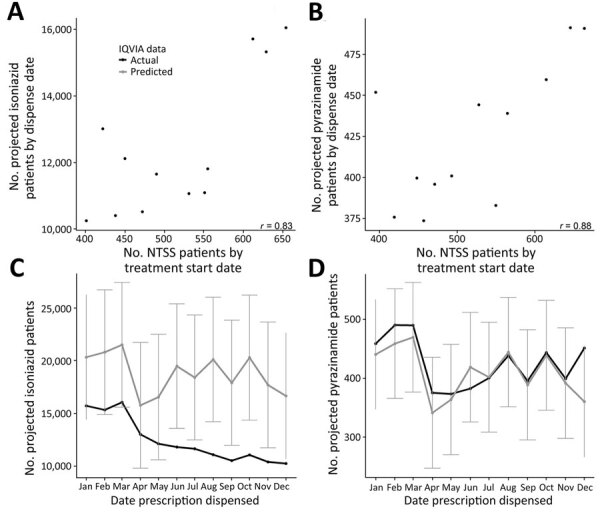
We analyzed a pharmacy dataset to assess the 20% decline in tuberculosis (TB) cases reported to the US National Tuberculosis Surveillance System (NTSS) during the coronavirus disease pandemic in 2020 compared with the 2016-2019 average. We examined the correlation between TB medication dispensing data to TB case counts in NTSS and used a seasonal autoregressive integrated moving average model to predict expected 2020 counts. Trends in the TB medication data were correlated with trends in NTSS data during 2006-2019. There were fewer prescriptions and cases in 2020 than would be expected on the basis of previous trends. This decrease was particularly large during April-May 2020. These data are consistent with NTSS data, suggesting that underreporting is not occurring but not ruling out underdiagnosis or actual decline. Understanding the mechanisms behind the 2020 decline in reported TB cases will help TB programs better prepare for postpandemic cases.

Keywords: COVID-19; SARIMA; SARS-CoV-2; United States; bacteria; coronavirus disease; prescriptions; respiratory infections; severe acute respiratory syndrome coronavirus 2; surveillance; tuberculosis and other mycobacteria; viruses; zoonoses.


Figures

Figure 1
Figure 1
Correlation between National Tuberculosis Surveillance System case counts and IQVIA (https://www.iqvia.com) projected patient counts for isoniazid (A) or pyrazinamide (B) prescriptions, United States, 2006–2019. Horizontal axes show patient counts aggregated by treatment start date, removing patients who had reported resistance to isoniazid or pyrazinamide. Vertical axes show IQVIA projected patient counts aggregated by date drug was dispensed (data are on different scales). Each point represents a month, and all data during 2006–2019 are shown. Solid black lines represent regression fit for a linear model between the 2 databases; dashed gray lines indicate 95% prediction intervals. The Pearson correlation coefficient (r) is shown in the lower righthand corner of each plot.
Figure 2
Figure 2
Comparison between 2020 tuberculosis case counts and case counts in previous years, United States. A) Percentage difference in case counts each year compared to previous years. NTSS case counts were aggregated by treatment start date month. A moving annual total ending in December was used for the number of projected patients in the IQVIA (https://www.iqvia.com) dataset prescribed INH or PZA. The horizontal black line indicates a percent change of zero, indicating no change in the number of cases from the previous year; above the line indicates more patients than the previous year and below the line fewer. B) Percent difference in prescriptions between 2019 and 2020 by month. NTSS case counts were aggregated by treatment start date month, whereas IQVIA data were aggregated by New to Brand prescription data for INH prescriptions, PZA prescriptions, or no filter applied. The horizontal black line represents no change in 2020 compared with 2019; above the line means more prescriptions in 2020 and below indicates fewer. The same analysis was also conducted for IQVIA projected patient counts (Appendix Figure 4). INH, isoniazid; NTSS, National Tuberculosis Surveillance System; PZA, pyrazinamide.
Figure 3
Figure 3
Tuberculosis cases reported to the National TB Surveillance System (NTSS) and IQVIA (https://www.iqvia.com) projected patient counts in 2020 compared with previous years, United States. A seasonal autoregressive integrated moving average model was fit to January 2006–December 2019 data from cases reported to NTSS by treatment start date (A), IQVIA isoniazid projected patient counts (B), or IQVIA pyrazinamide projected patient counts (C) (for model details, see Appendix Figures 6–8). Light gray indicates model with 95% prediction intervals, which was used to forecast 2020 counts with 95% prediction intervals (dark gray). Black dots represent the number of cases (A) or projected patient counts (B, C) each month. Vertical axes in each plot are different because of different scales.
Figure 4
Figure 4
Comparison of National Tuberculosis Surveillance System (NTSS) case counts and IQVIA projected patient counts for isoniazid or pyrazinamide prescriptions, United States, 2020. A, B) Projected patient counts for isoniazid (A) and pyrazinamide (B). Horizontal axis of each plot shows NTSS patient counts aggregated by treatment start date (month), removing patients who had reported resistance. Each point represents a month in 2020. The Pearson correlation coefficient (r) is shown in lower righthand corner of each plot. C, D) A linear model fit to the 2006–2019 data (Figure 1) with quarter as a covariate to predict 2020 IQVIA projected patient counts for isoniazid (C) or pyrazinamide (D). Black line indicates actual data; gray line indicates expected IQVIA counts with 95% prediction intervals. Note vertical axes are different because of different scales for isoniazid and pyrazinamide in the IQVIA dataset. NTSS, National Tuberculosis Surveillance System.

References

    1. Cronin AM, Railey S, Fortune D, Wegener DH, Davis JB. Notes from the field: effects of the COVID-19 response on tuberculosis prevention and control efforts—United States, March–April 2020. MMWR Morb Mortal Wkly Rep. 2020;69:971–2. 10.15585/mmwr.mm6929a4 - DOI - PMC - PubMed
    1. Deutsch-Feldman M, Pratt RH, Price SF, Tsang CA, Self JL. Tuberculosis - United States, 2020. MMWR Morb Mortal Wkly Rep. 2021;70:409–14. 10.15585/mmwr.mm7012a1 - DOI - PMC - PubMed
    1. Centers for Disease Control and Prevention (CDC). Reported tuberculosis in the United States, 2019. [cited 2021 Jul 27]. https://www.cdc.gov/tb/statistics/reports/2019/default.htm
    1. Furukawa NW, Zhu W, Huang YA, Shrestha RK, Hoover KW. National trends in drug payments for HIV preexposure prophylaxis in the United States, 2014 to 2018: a retrospective cohort study. Ann Intern Med. 2020;173:799–805. 10.7326/M20-0786 - DOI - PMC - PubMed
    1. Huang YA, Zhu W, Smith DK, Harris N, Hoover KW. HIV preexposure prophylaxis, by race and ethnicity—United States, 2014–2016. MMWR Morb Mortal Wkly Rep. 2018;67:1147–50. 10.15585/mmwr.mm6741a3 - DOI - PMC - PubMed