

A negative feedback loop between fibroadipogenic progenitors and muscle fibres involving endothelin promotes human muscle fibrosis
- PMID: 35319169
- PMCID: PMC9178170
- DOI: 10.1002/jcsm.12974
A negative feedback loop between fibroadipogenic progenitors and muscle fibres involving endothelin promotes human muscle fibrosis
Abstract
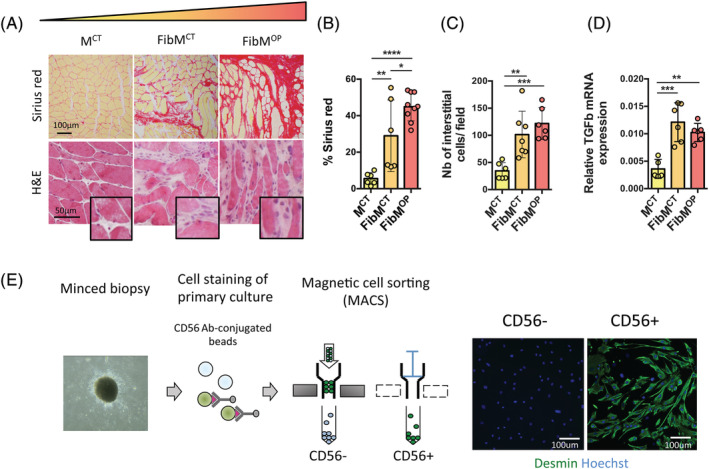
Background: Fibrosis is defined as an excessive accumulation of extracellular matrix (ECM) components. Many organs are subjected to fibrosis including the lung, liver, heart, skin, kidney, and muscle. Muscle fibrosis occurs in response to trauma, aging, or dystrophies and impairs muscle function. Fibrosis represents a hurdle for the treatment of human muscular dystrophies. While data on the mechanisms of fibrosis have mostly been investigated in mice, dystrophic mouse models often do not recapitulate fibrosis as observed in human patients. Consequently, the cellular and molecular mechanisms that lead to fibrosis in human muscle still need to be identified.
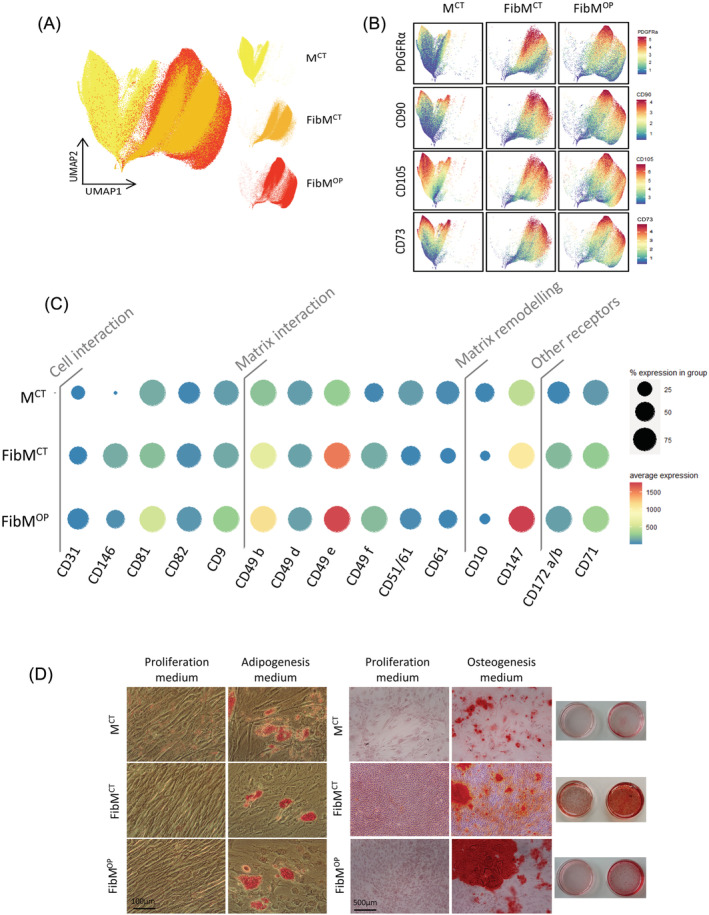
Methods: Combining mass cytometry, transcriptome profiling, in vitro co-culture experiments, and in vivo transplantation in immunodeficient mice, we investigated the role and nature of nonmyogenic cells (fibroadipogenic progenitors, FAPs) from human fibrotic muscles of healthy individuals (FibMCT ) and individuals with oculopharyngeal muscular dystrophy (OPMD; FibMOP ), as compared with nonmyogenic cells from human nonfibrotic muscle (MCT ).
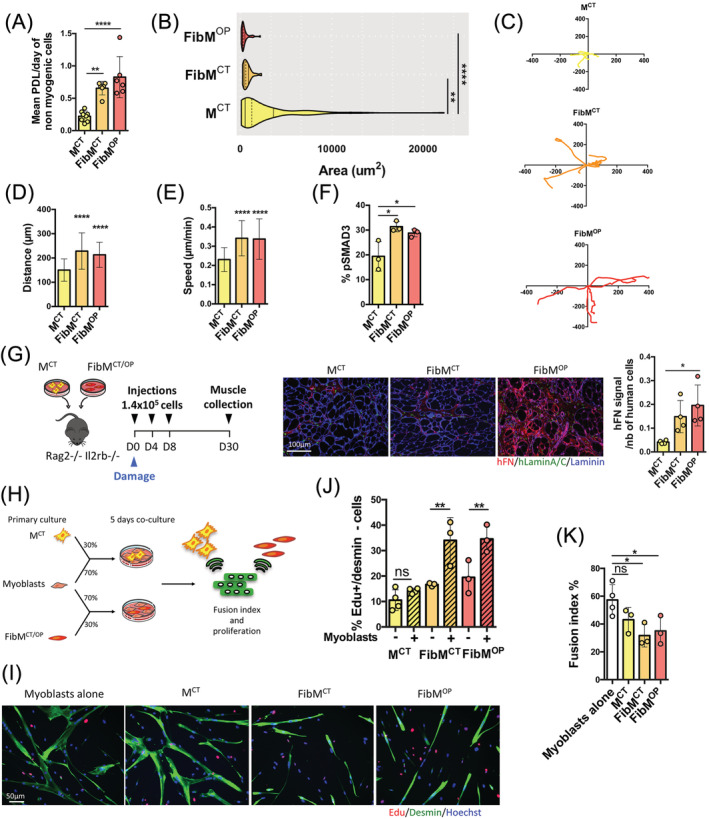
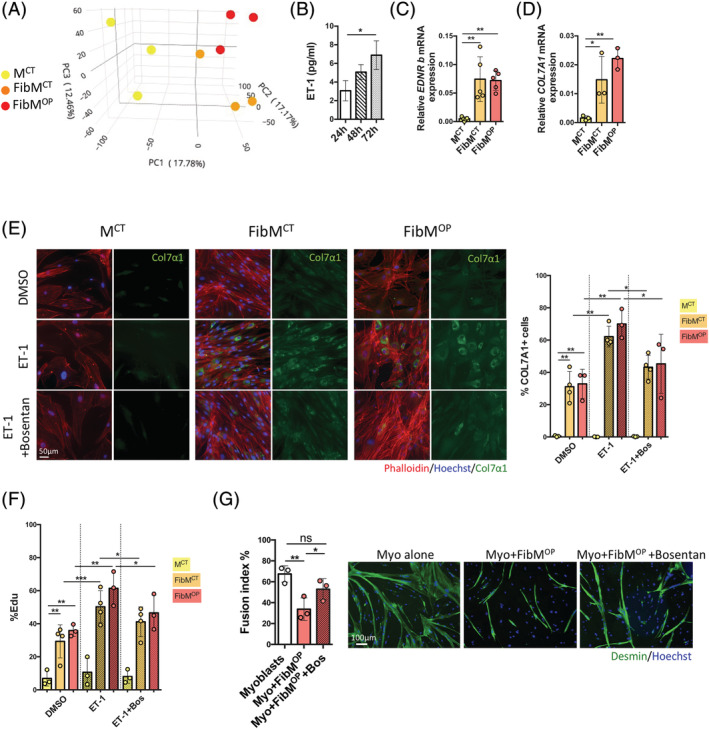
Results: We found that the proliferation rate of FAPs from fibrotic muscle is 3-4 times higher than those of FAPs from nonfibrotic muscle (population doubling per day: MCT 0.2 ± 0.1, FibMCT 0.7 ± 0.1, and FibMOP 0.8 ± 0.3). When cocultured with muscle cells, FAPs from fibrotic muscle impair the fusion index unlike MCT FAPs (myoblasts alone 57.3 ± 11.1%, coculture with MCT 43.1 ± 8.9%, with FibMCT 31.7 ± 8.2%, and with FibMOP 36.06 ± 10.29%). We also observed an increased proliferation of FAPs from fibrotic muscles in these co-cultures in differentiation conditions (FibMCT +17.4%, P < 0.01 and FibMOP +15.1%, P < 0.01). This effect is likely linked to the increased activation of the canonical TGFβ-SMAD pathway in FAPs from fibrotic muscles evidenced by pSMAD3 immunostaining (P < 0.05). In addition to the profibrogenic TGFβ pathway, we identified endothelin as a new actor implicated in the altered cross-talk between muscle cells and fibrotic FAPs, confirmed by an improvement of the fusion index in the presence of bosentan, an endothelin receptor antagonist (from 33.8 ± 10.9% to 52.9 ± 10.1%, P < 0.05).
Conclusions: Our data demonstrate the key role of FAPs and their cross-talk with muscle cells through a paracrine signalling pathway in fibrosis of human skeletal muscle and identify endothelin as a new druggable target to counteract human muscle fibrosis.
Keywords: ECM; Endothelin; FAPs; Fibrosis; Human; Pharyngeal muscle; Regeneration; Skeletal muscle; TGFβ.
© 2022 The Authors. Journal of Cachexia, Sarcopenia and Muscle published by John Wiley & Sons Ltd on behalf of Society on Sarcopenia, Cachexia and Wasting Disorders.
Conflict of interest statement
M.B., L.M., A.B., E.N., and C.T. are inventors on a patent on targeting endothelin to treat fibrosis. A.Bo., L.G., V.A., V.Y., J.D., A.O., V.H., T.G., S.P., J.L.S.G., A.C., V.M., and G.B.B. have declared that no conflicts of interest exist.
Figures
Similar articles
-
Involvement of lysophosphatidic acid-LPA1-YAP signaling in healthy and pathological FAPs migration.Matrix Biol. 2024 Nov;133:103-115. doi: 10.1016/j.matbio.2024.08.005. Epub 2024 Aug 15. Matrix Biol. 2024. PMID: 39153517
-
Thrown for a loop: fibro-adipogenic progenitors in skeletal muscle fibrosis.Am J Physiol Cell Physiol. 2023 Oct 1;325(4):C895-C906. doi: 10.1152/ajpcell.00245.2023. Epub 2023 Aug 21. Am J Physiol Cell Physiol. 2023. PMID: 37602412 Free PMC article. Review.
-
The Role of Matrix Metalloproteinase-13 (MMP13) in TGFβ/BMP Pathway Regulation of Fibro-Adipogenic Progenitor (FAP) Differentiation.Cell Physiol Biochem. 2022 Dec 20;56(6):730-743. doi: 10.33594/000000596. Cell Physiol Biochem. 2022. PMID: 36537139
-
ALS skeletal muscle shows enhanced TGF-β signaling, fibrosis and induction of fibro/adipogenic progenitor markers.PLoS One. 2017 May 16;12(5):e0177649. doi: 10.1371/journal.pone.0177649. eCollection 2017. PLoS One. 2017. PMID: 28520806 Free PMC article.
-
Exploring the therapeutic potential of fibroadipogenic progenitors in muscle disease.J Neuromuscul Dis. 2025 Jan-Feb;12(1):22143602241298545. doi: 10.1177/22143602241298545. J Neuromuscul Dis. 2025. PMID: 39973455 Free PMC article. Review.
Cited by
-
Altered muscle niche contributes to myogenic deficit in the D2- mdx model of severe DMD.bioRxiv [Preprint]. 2023 Mar 28:2023.03.27.534413. doi: 10.1101/2023.03.27.534413. bioRxiv. 2023. Update in: Cell Death Discov. 2023 Jul 4;9(1):224. doi: 10.1038/s41420-023-01503-0. PMID: 37034785 Free PMC article. Updated. Preprint.
-
Muscle transcriptomic circuits linked to periarticular physiology in end-stage osteoarthritis.Physiol Genomics. 2022 Dec 1;54(12):501-513. doi: 10.1152/physiolgenomics.00092.2022. Epub 2022 Oct 24. Physiol Genomics. 2022. PMID: 36278270 Free PMC article.
-
Five Padua days on muscle and mobility medicine (2024Pdm3) 27 February - 2 March, 2024 at Hotel Petrarca, Thermae of Euganean Hills, Padua, and San Luca Hall, Prato della Valle, Padua, Italy.Eur J Transl Myol. 2023 Dec 18;33(4):12161. doi: 10.4081/ejtm.2023.12161. Eur J Transl Myol. 2023. PMID: 38112609 Free PMC article.
-
2023 Padua Days of Muscle and Mobility Medicine: post-meeting Book of Abstracts.Eur J Transl Myol. 2023 Apr 27;33(2):11427. doi: 10.4081/ejtm.2023.11427. Eur J Transl Myol. 2023. PMID: 37114363 Free PMC article.
-
The reciprocity of skeletal muscle and bone: an evolving view from mechanical coupling, secretory crosstalk to stem cell exchange.Front Physiol. 2024 Mar 4;15:1349253. doi: 10.3389/fphys.2024.1349253. eCollection 2024. Front Physiol. 2024. PMID: 38505709 Free PMC article. Review.
References
-
- Abrigo J, Simon F, Cabrera D, Cordova G, Trollet C, Cabello‐Verrugio C. Central role of transforming growth factor type beta 1 in skeletal muscle dysfunctions: an update on therapeutic strategies. Curr Protein Pept Sci 2018;19:1189–1200. - PubMed
-
- Uezumi A, Fukada S, Yamamoto N, Takeda S, Tsuchida K. Mesenchymal progenitors distinct from satellite cells contribute to ectopic fat cell formation in skeletal muscle. Nat Cell Biol 2010;12:143–152. - PubMed
Publication types
MeSH terms
Substances
Grants and funding
LinkOut - more resources
Full Text Sources
Other Literature Sources
Miscellaneous
