. 2022 Apr 13;96(7):e0006322.
doi: 10.1128/jvi.00063-22. Epub 2022 Mar 23.

Deep-Time Structural Evolution of Retroviral and Filoviral Surface Envelope Proteins

Affiliations

Deep-Time Structural Evolution of Retroviral and Filoviral Surface Envelope Proteins

Isidro Hötzel. J Virol. .

Abstract

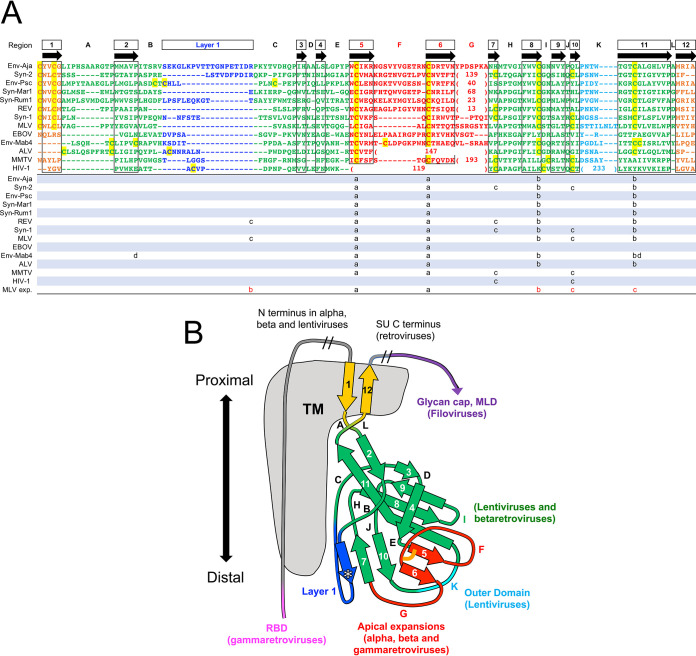
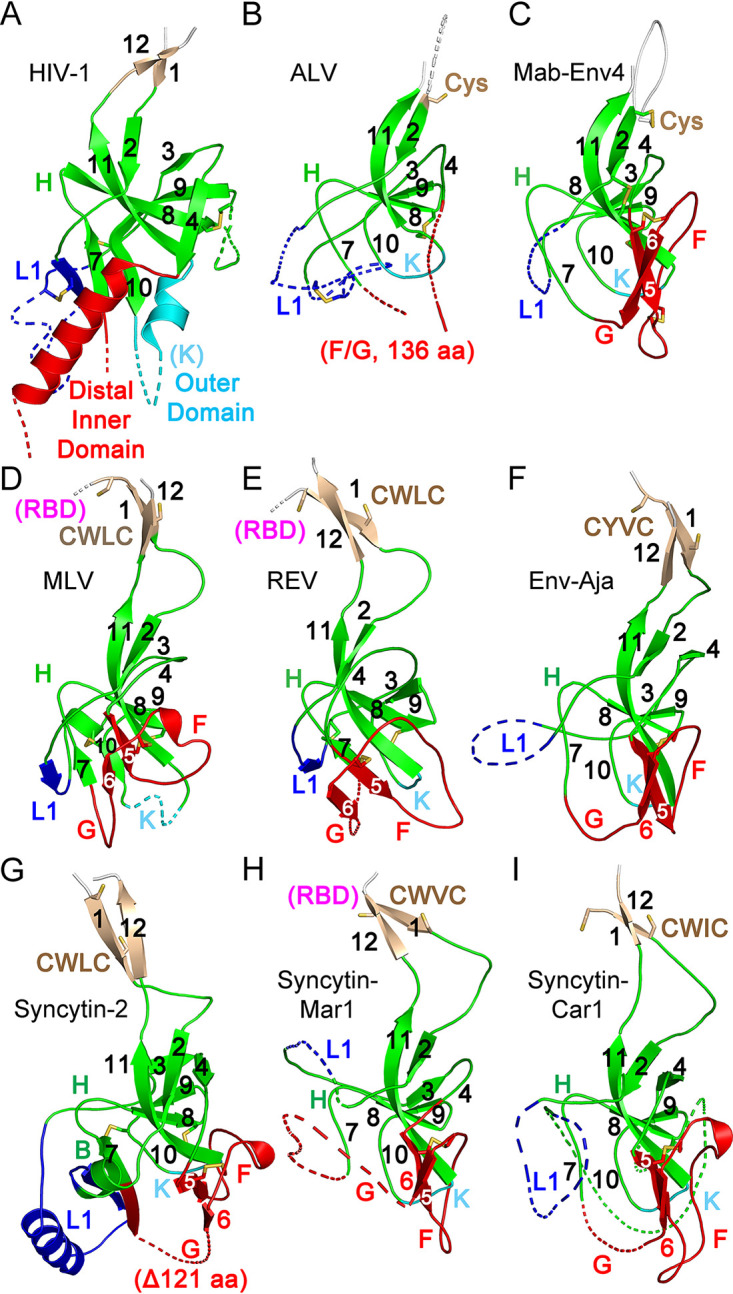
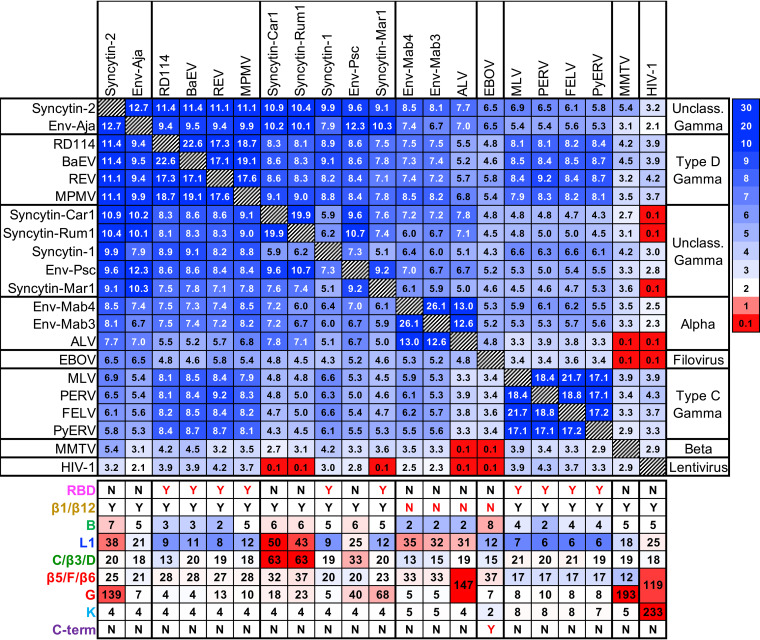
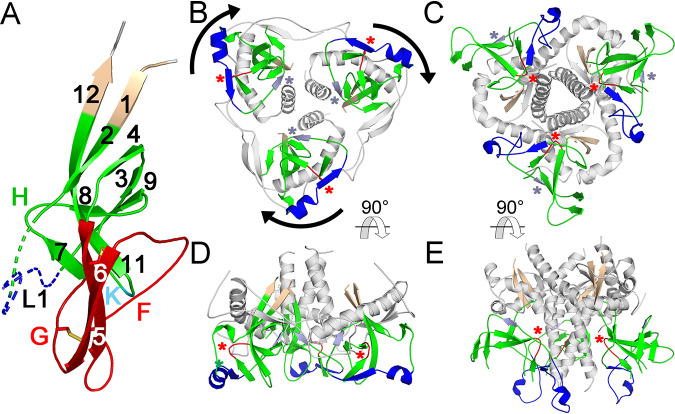
The retroviral surface envelope protein subunit (SU) mediates receptor binding and triggers membrane fusion by the transmembrane (TM) subunit. SU evolves rapidly under strong selective conditions, resulting in seemingly unrelated SU structures in highly divergent retroviruses. Structural modeling of the SUs of several retroviruses and related endogenous retroviral elements with AlphaFold 2 identifies a TM-proximal SU β-sandwich structure that has been conserved in the orthoretroviruses for at least 110 million years. The SU of orthoretroviruses diversified by the differential expansion of the β-sandwich core to form domains involved in virus-host interactions. The β-sandwich domain is also conserved in the SU equivalent GP1 of Ebola virus although with a significantly different orientation in the trimeric envelope protein structure relative to the β-sandwich of human immunodeficiency virus type 1 gp120, with significant evidence for divergent rather than convergent evolution. The unified structural view of orthoretroviral SU and filoviral GP1 identifies an ancient, structurally conserved, and evolvable domain underlying the structural diversity of orthoretroviral SU and filoviral GP1. IMPORTANCE The structural relationships of SUs of retroviral groups are obscured by the high rate of sequence change of SU and the deep-time divergence of retroviral lineages. Previous data showed no structural or functional relationships between the SUs of type C gammaretroviruses and lentiviruses. A deeper understanding of structural relationships between the SUs of different retroviral lineages would allow the generalization of critical processes mediated by these proteins in host cell infection. Modeling of SUs with AlphaFold 2 reveals a conserved core domain underlying the structural diversity of orthoretroviral SUs. Definition of the conserved SU structural core allowed the identification of a homologue structure in the SU equivalent GP1 of filoviruses that most likely shares an origin, unifying the SU of orthoretroviruses and GP1 of filoviruses into a single protein family. These findings will allow an understanding of the structural basis for receptor-mediated membrane fusion mechanisms in a broad range of biomedically important retroviruses.

Keywords: ALV; EBOV; FELV; GP1; HIV-1; MLV; RBD; alpharetrovirus; betaretrovirus; foamy virus; gammaretrovirus; gp120; lentivirus; spumaretrovirus; syncytin.


Conflict of interest statement

The authors declare a conflict of interest. The author is an Employee of Genentech and holds shares in Roche.

Figures

FIG 1
FIG 1
Modeling of orthoretroviral SU. (A) Relationship of orthoretroviral TM and filoviral GP2 transmembrane subunit ectodomain sequences. A neighbor-joining cladogram was generated with Geneious Prime using Ebola virus GP2 to root the cladogram. Orthoretroviral and filoviral groups are color-coded as indicated in the cladogram except for unclassified gammaretroviruses, which are shown in black. Numbers indicate node support (percent) from 1,000 bootstrap runs. (B to I) pLDDT scores of SU models. pLDDT scores along the SU sequence are indicated for each model, grouping similar models in the same panels.
FIG 2
FIG 2
Orthoretroviral SU structural models. Shown are models of the SUs of type C gammaretroviruses (A), syncytin-1 (B), syncytin-2 (C), type D gammaretroviruses (D), syncytin-Mar1 (E), syncytin-Car1 and Rum1 (F), Env-Aja and Env-Psc (G), ALV (H), and Mab-Env3 and Mab-Env4 (I). Panels A, D, F, G, and I show superpositions of structurally similar models, with minimum and maximum root mean square deviations of aligned models in angstroms shown in parentheses. The models in panels A, B, D, and E show the RBD in magenta and the linker regions joining the RBD to the C-domain in gray. The models in panels F, G, and I are shown in colors as indicated in each panel. The disordered PRR and linker regions are shown as dotted lines in panels A and B. The conserved cysteine residues in the gammaretroviral CWLC consensus motifs in panels A to G or preceding the first β-strand in the alpharetrovirus SU models in panels H and I are shown as spheres. The deletion in the syncytin-2 SU model (Δ122) is shown as a dotted line.
FIG 3
FIG 3
pLDDT scores mapped on orthoretroviral SU models. pLDDT scores are mapped on cartoon representations of type C gammaretroviruses (A), syncytin-1 (B), syncytin-2 (C), type D gammaretroviruses (D), syncytin-Mar1 (E), syncytin-Car1 and Rum1 (F), Env-Aja and Env-Psc (G), ALV (H), and Mab-Env3 and Mab-Env4 (I). Models are shown in the same order and orientation as in Fig. 2. The pLDDT score scale is shown next to panel A. Low-confidence model regions with scores below 50 are shown in red. Unstructured PRR and linker regions are shown as dotted lines. The RBD, C-domains, PRR, and linker regions of type C, type D, syncytin-1, and syncytin-Mar1 are indicated. The deletion in the syncytin-2 model is indicated as dotted lines in panel C.
FIG 4
FIG 4
RBDs of type D gammaretroviruses, syncytin-1, and syncytin-Mar1. (A) First, amino-terminal β-sheet of the type D REV RBD. (B) Second, carboxy-terminal REV RBD β-sheet. (C) Syncytin-1 RBD. (D) Syncytin-Mar1 RBD. The β-sheets are shown in the same orientation in all panels with the three sequential β-strands indicated by numbers. Loops linking β-strands and flanking the β-sheet region are shown as dotted lines for clarity. Disulfides are shown as sticks. The amino and carboxy termini of each section are indicated.
FIG 5
FIG 5
Conserved orthoretroviral and filoviral PDs. (A) Orthoretroviral and filoviral PD sequences structurally aligned to the PD of Env-Aja. Note that the sequences are not aligned by sequence similarity but rather represent residue alignments in three-dimensional space to show the equivalent β-strand regions of the PD structure and the boundaries of connecting loops. The structural alignments were generated by the DALI server, except for the terminal β-strands 1 and 12. These two β-strands, which are not part of the core PD and are modeled in different orientations in different models, cannot be automatically aligned and were aligned manually. Insertions relative to the minimal Env-Aja SU model are not shown to highlight the β-strands shared by the models and structures, except for insertions in the major variable loop F and K regions, which are shown by the number of amino acid residues in parentheses. The lengths of all main loop regions within the PD are shown at the bottom of Fig. 7. Only one representative of each orthoretroviral and filoviral lineage is shown. The consensus β-strands are indicated by boxes and arrows. Cysteine residues are highlighted in yellow. Disulfide bonds in models and structures are shown below the structural alignment in matching lowercase letters, with the last line indicating the experimentally determined disulfide bonds in the MLV SU. The proximal domain is highlighted in green, except for the apical, layer 1, and loop K regions, which are highlighted in red, blue, and cyan. Terminal β-strands 1 and 12 are highlighted in orange. The boundaries of the HIV-1 gp120 and EBOV GP1 sequences correspond to residues labeled as aa 31 to 497 of chain A and aa 62 to 187 of chain I in the structures under PDB accession numbers 3JWD and 3CSY, respectively. (B) Schematic representation of the PD structures and major extended regions in different viral lineages. Regions are colored as described above for panel A, with the PD, apical region, layer 1, and K regions shown in green, red, blue, and cyan. The location of HIV-1 gp41 relative to the PD in the trimer structure is shown in gray. The asterisk in layer 1 indicates a β-strand that sometimes extends the β-sheet formed by extended β-strands 7 and 10. The conserved disulfide bond between β-strands 5 and 6 in the apical domain is shown as an orange line. The regions with major expansions in different lineages are indicated. MLD, mucin-like domain.
FIG 6
FIG 6
Conserved orthoretroviral SU proximal domain β-sandwich. (A) Structure of the HIV-1 gp120 PD region (PDB accession number 3JWD). (B to I) PD regions of the ALV (B), Mab-Env4 (C), MLV (D), REV (E), Env-Aja (F), syncytin-2 (G), syncytin-Mar1 (H), and syncytin-Car1 (I) SU models. Parts of layer 1 (L1) and regions F and G and the HIV-1 gp120 distal inner and outer domains are shown as dotted lines for clarity. The PD, apical domain, and layer 1 regions are shown in green, red, and blue. Selected loop and β-strand regions are labeled in each panel. Cysteine residues are shown as sticks. The locations of the conserved CWLC consensus motifs of gammaretroviral SU in β-strand 1 are indicated in panels D to I. The connections to the RBD in the models in panels D, E, and H are shown in magenta. All structures and models are shown in the same orientation as those in Fig. 2 and 3.
FIG 7
FIG 7
Orthoretroviral SU and filoviral GP1 DALI structural similarity Z-score matrix. The viral lineages and the scale for DALI Z-scores are shown on the right. The lengths in amino acids of selected PD regions of different viruses and endogenous elements are shown below the matrix. Color-coding indicates lengths below (blue tones), above (red tones), or equal to the median for each region.
FIG 8
FIG 8
Conservation and orientation of the PD in EBOV GP1. (A) EBOV GP1 base and head subdomains (PDB accession number 3CSY) comprising the PD, shown in an orientation similar to that of the PD of orthoretroviruses in Fig. 6. The β-strand and selected loop regions are labeled and colored as described in the legends of Fig. 5 and 6. Disulfides in the apical region are shown as sticks. (B and C) EBOV (PDB accession number 5HJ3) (B) and HIV-1 (PDB accession number 4TVP) (C) trimeric envelope protein crystal structures shown from the top, distal side. The apical domain in the GP1 protomers in panel B and the distal region of the inner domains and the outer domains of gp120 in panel C are omitted for clarity. The β-sandwich, terminal β-strand, and layer 1 homologues are shown in green, wheat, and blue. Region H and β-strand 3 homologues are shown in red and light blue and highlighted with red and light blue asterisks. The arrows in panel B indicate the clockwise direction of the major 120° rotation of GP1 relative to gp120 protomers in the trimeric structures. (D and E) The same structures as the ones in panels B and C, rotated 90°, with the virion-proximal side facing up.
FIG 9
FIG 9
Glycosylation sites of gammaretroviral PD regions. (A) Cartoon representation of the FELV PD model. (B) Space-filling representation of the same model as the one in panel A. (C to E) Sequential 90° rotations of the model in panel B. (F) Cartoon representation of the MPMV PD model. (G) Space-filling representation of the same model as the one in panel F. (H to J) Sequential 90° rotations of the model in panel G. Regions are colored as described in the legend of Fig. 6, with the PD, apical region, layer 1, and K regions shown in green, red, blue, and cyan. Asparagine residues in potential glycosylation sites are shown in yellow. The H region that in HIV-1 is closely associated with gp41 is indicated with an asterisk. Note the glycosylation site centrally located in region H in panels A to C and F to H. Regions prior to and beyond β-strands 1 and 12 are not shown. The FELV and MPMV PD surfaces homologous to the EBOV GP1 surface facing GP2 in the trimeric envelope protein structure are shown in panels D and I.
FIG 10
FIG 10
African green monkey simian foamy retrovirus SU model. The modeled structure is shown with colors indicating pLDDT scores along the chain, with the scale shown to the right. The amino and carboxy termini of the model are indicated with the number of residues not modeled on each end. The amino-terminal section outside the model shown has helical regions that do not pack with the rest of the SU and are not structurally similar to the SU of orthoretroviruses. Disulfide bonds are indicated by sticks. All cysteine residues in the modeled region participate in disulfide bonds. A cap minidomain located distally relative to the chain termini is indicated.

Similar articles

Cited by

References

    1. Johnson WE. 2019. Origins and evolutionary consequences of ancient endogenous retroviruses. Nat Rev Microbiol 17:355–370. 10.1038/s41579-019-0189-2. - DOI - PubMed
    1. Mi S, Lee X, Li X, Veldman GM, Finnerty H, Racie L, LaVallie E, Tang X-Y, Edouard P, Howes S, Keith JC, McCoy JM. 2000. Syncytin is a captive retroviral envelope protein involved in human placental morphogenesis. Nature 403:785–789. 10.1038/35001608. - DOI - PubMed
    1. Henzy JE, Johnson WE. 2013. Pushing the endogenous envelope. Philos Trans R Soc Lond B Biol Sci 368:20120506. 10.1098/rstb.2012.0506. - DOI - PMC - PubMed
    1. Henzy JE, Coffin JM. 2013. Betaretroviral envelope subunits are noncovalently associated and restricted to the mammalian class. J Virol 87:1937–1946. 10.1128/JVI.01442-12. - DOI - PMC - PubMed
    1. White JM, Delos SE, Brecher M, Schornberg K. 2008. Structures and mechanisms of viral membrane fusion proteins: multiple variations on a common theme. Crit Rev Biochem Mol Biol 43:189–219. 10.1080/10409230802058320. - DOI - PMC - PubMed

MeSH terms